
Rationale and Objectives
Novel image analysis methods may be useful adjuncts to standard cancer treatment response assessment techniques. The attenuation distribution across the long axis (ADLA) is a simple measure of lesion heterogeneity that can be obtained while measuring the long axis diameter of a target lesion. The purpose of this study was to obtain preliminary validation of the ADLA method for predicting treatment response in a small clinical trial.
Materials and Methods
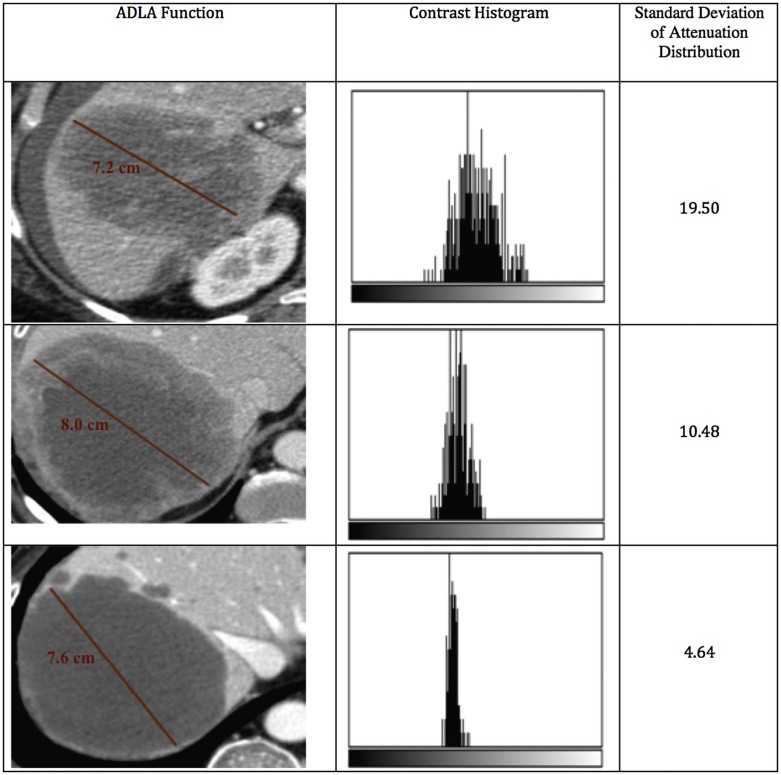
Under an Institutional Review Board waiver, we obtained de-identified imaging and clinical data from a phase 2 trial of an investigational anticancer therapy at our institution. We retrospectively analyzed all patients with at least one liver metastasis measuring ≥15 mm on baseline contrast-enhanced computed tomography. For each patient at every imaging time point, up to two target liver lesions were evaluated using Response Evaluation Criteria in Solid Tumors (RECIST) 1.1 and ADLA measurements. The ADLA was obtained as the standard deviation of the post-contrast computed tomography attenuation values in the portal venous phase across a linear function spanning the long-axis diameter. Using Kaplan-Meier survival analysis, the log-rank test was used to evaluate the ability of RECIST 1.1 and ADLA measurements to discriminate patients with longer overall survival (OS).
Results
Fifteen patients met inclusion criteria. Median survival was 149 days (range 57-487). Best overall response by the ADLA method successfully separated patients with longer OS (p = .04). Best overall response by RECIST 1.1 did not discriminate patients with longer survival ( P > .05).
Conclusion
In retrospective data analysis from a phase 2 clinical trial, the ADLA method was more predictive of OS than RECIST 1.1. Further studies are needed to explore the utility of this measurement in predicting response to cancer treatment.
Introduction
In recent years, a number of imaging techniques have been proposed for the assessment and prediction of response to anticancer therapy. These proposals span multiple modalities and range from fully quantitative to semiquantitative approaches . They are linked by the common goal of assessing response earlier or more accurately than traditional lesion size-based response techniques, with the end objective of triaging patients quickly to more beneficial therapies and sparing patients harmful side effects from ineffective regimens . In order for new response assessment techniques to be successfully translated into clinical trials and routine clinical practice, the data extraction methods must not create an unreasonable workflow burden. Many fully quantitative techniques require significant time and resources for image processing and analysis. Although such techniques may be appropriate for a dedicated imaging core laboratory, their workflow requirements make their incorporation into routine clinical practice unlikely.
This paper introduces the attenuation distribution across the long axis (ADLA) as a simple and easily extracted semiquantitative imaging biomarker for assessing treatment response in solid malignancies. The ADLA, described in more detail later, is a measure of intralesional heterogeneity that can be obtained while measuring the long axis diameter of a target lesion on cross-sectional imaging. ADLA measurements may be easily obtained as part of the typical radiologist’s workflow. As a measure of intralesional heterogeneity, we hypothesize that the ADLA measurement is promising as a biomarker for treatment response under the assumption that viable tumors will have a heterogeneous distribution of postcontrast computed tomography (CT) attenuation values reflecting healthy perfused soft tissue, whereas tumors responding to therapy will have a more homogeneous attenuation distribution reflecting decreased tumor perfusion and intralesional necrosis. We believe that with proper validation, this metric may be incorporated into clinical trials and into routine clinical evaluation to help assess tumor response across a wide range of anticancer therapies. The purpose of this preliminary study was to illustrate the ADLA technique and to provide preliminary biomarker validation against survival end points using imaging data from a phase 2 clinical trial.
Materials and Methods
Patient Selection and Data Collection
Get Radiology Tree app to read full this article<
Get Radiology Tree app to read full this article<
Get Radiology Tree app to read full this article<
Get Radiology Tree app to read full this article<
Data Analysis
Get Radiology Tree app to read full this article<
Statistical Methods
Get Radiology Tree app to read full this article<
Results
Get Radiology Tree app to read full this article<
Get Radiology Tree app to read full this article<
Table 1
Best Overall Response by ADLA and RECIST 1.1
Patient Number Maximum Change in Diameter (RECIST) Ψ Maximum Change in Weighted Average (ADLA) Ψ Best Overall Response RECIST 1.1 Best Overall Response ADLA Overall Survival (Days) 1 +17.9% +32.4% Nonresponse Nonresponse 126 2 +33.9% −35% Nonresponse Nonresponse 59 3 +26.5% +42% Nonresponse Nonresponse 89 4 −2.5% −43.9% NonresponseResponse 172 5 +17.5% +37% Nonresponse Nonresponse 95 6 +13.45% −53.8% NonresponseResponse 174 7 +.41% −29.8% Nonresponse Nonresponse 149 8 +6.2% −42.4% NonresponseResponse 461 9 +22.4% +73.6% Nonresponse Nonresponse 131 10 +14.3% −14.1% Nonresponse Nonresponse 57 11 −16.3% −44.8% NonresponseResponse 367 12 −24.7% −40.9% NonresponseResponse 487 13 +38.9% −5.5% Nonresponse Nonresponse 71 14 +30% +15.9% Nonresponse Nonresponse 281 15 +24.7% +20.5% Nonresponse Nonresponse 183
ADLA: attenuation distribution across the long axis; RECIST: Response Evaluation Criteria in Solid Tumors.
Get Radiology Tree app to read full this article<
Get Radiology Tree app to read full this article<
Get Radiology Tree app to read full this article<
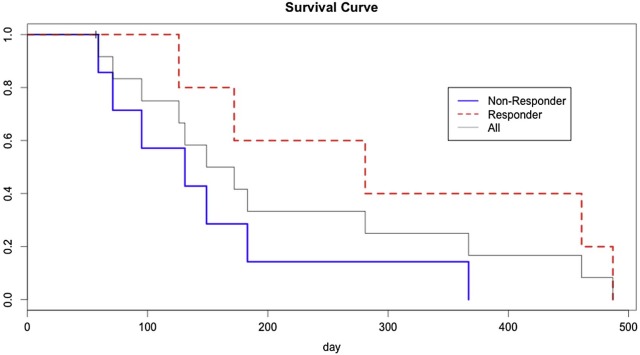
Table 2
Log-Rank Test Outcomes for Various ADLA Cutoff Thresholds
ADLA Cutoff Threshold Log-Rank Test P Value 0 0.228 −5% 0.228 −10% 0.081 −15% 0.081 −20% 0.081 −25% 0.081 −30% 0.053 −35% 0.012 −40% 0.012 −45% 0.973 −50% 0.973
ADLA, attenuation distribution across the long axis.
Get Radiology Tree app to read full this article<
Discussion
Get Radiology Tree app to read full this article<
Get Radiology Tree app to read full this article<
Get Radiology Tree app to read full this article<
Get Radiology Tree app to read full this article<
Get Radiology Tree app to read full this article<
Get Radiology Tree app to read full this article<
Acknowledgments
Get Radiology Tree app to read full this article<
Get Radiology Tree app to read full this article<
Get Radiology Tree app to read full this article<
References
1. Wahl R.L., Jacene H., Kasamon Y., et. al.: From RECIST to PERCIST: evolving considerations for PET response criteria in solid tumors. J Nucl Med 2009; 50: pp. 122S-150S.
2. Barker A.D., Sigman C.C., Kelloff G.J., et. al.: I-SPY 2: an adaptive breast cancer trial design in the setting of neoadjuvant chemotherapy. Clin Pharmacol Ther 2009; 86: pp. 97-100.
3. Whisenant J.G., Sorace A.G., McIntyre J.O., et. al.: Evaluating treatment response using DW-MRI and DCE-MRI in trastuzumab responsive and resistant HER2-overexpressing human breast cancer xenografts. Transl Oncol 2014; 7: pp. 768-779.
4. Choi H., Charnsangavej C., de Castro Faria S., et. al.: CT evaluation of the response of gastrointestinal stromal tumors after imatinib mesylate treatment: a quantitative analysis correlated with FDG PET findings. AJR Am J Roentgenol 2004; 183: pp. 1619-1628.
5. Abramson R.G., Li X., Hoyt T.L., et. al.: Early assessment of breast cancer response to neoadjuvant chemotherapy by semi-quantitative analysis of high-temporal resolution DCE-MRI: preliminary results. Magn Reson Imaging 2013; 31: pp. 1457-1464.
6. Hoyt K., Warram J.M., Umphrey H., et. al.: Determination of breast cancer response to bevacizumab therapy using contrast-enhanced ultrasound and artificial neural networks. J Ultrasound Med 2010; 29: pp. 577-585.
7. Eisenhauer E.A., Therasse P., Bogaerts J., et. al.: New response evaluation criteria in solid tumours: revised RECIST guideline (version 1.1). Eur J Cancer 2009; 45: pp. 228-247.
8. Schneider C.A., Rasband W.S., Eliceiri K.W.: NIH Image to ImageJ: 25 years of image analysis. Nat Methods 2012; 9: pp. 671-675.
9. Grothey A., Hedrick E.E., Mass R.D., et. al.: Response-independent survival benefit in metastatic colorectal cancer: a comparative analysis of N9741 and AVF2107. J Clin Oncol 2008; 26: pp. 183-189.
10. Chun Y.S., Vauthey J.-N., Boonsirikamchai P., et. al.: Association of computed tomography morphologic criteria with pathologic response and survival in patients treated with bevacizumab for colorectal liver metastases. JAMA 2009; 302: pp. 2338-2344.
11. Benjamin R.S., Choi H., Macapinlac H.A., et. al.: We should desist using RECIST, at least in GIST. J Clin Oncol 2007; 25: pp. 1760-1764.
12. Chung W.-S., Park M.-S., Shin S.J., et. al.: Response evaluation in patients with colorectal liver metastases: RECIST version 1.1 versus modified CT criteria. AJR Am J Roentgenol 2012; 199: pp. 809-815.
13. Smith A.D., Lieber M.L., Shah S.N.: Assessing tumor response and detecting recurrence in metastatic renal cell carcinoma on targeted therapy: importance of size and attenuation on contrast-enhanced CT. AJR Am J Roentgenol 2010; 194: pp. 157-165.
14. Yankeelov T.E., Lepage M., Chakravarthy A., et. al.: Integration of quantitative DCE-MRI and ADC mapping to monitor treatment response in human breast cancer: initial results. Magn Reson Imaging 2007; 25: pp. 1-13.
15. Yankeelov T.E., Luci J.J., Lepage M., et. al.: Quantitative pharmacokinetic analysis of DCE-MRI data without an arterial input function: a reference region model. Magn Reson Imaging 2005; 23: pp. 519-529.
16. Yaghmai V., Miller F.H., Rezai P., et. al.: Response to treatment series: part 2, tumor response assessment–using new and conventional criteria. AJR Am J Roentgenol 2011; 197: pp. 18-27.
17. Sahani D.V., Holalkere N.-S., Mueller P.R., et. al.: Advanced hepatocellular carcinoma: CT perfusion of liver and tumor tissue–initial experience. Radiology 2007; 243: pp. 736-743.
18. Hylton N.M., Blume J.D., Bernreuter W.K., et. al.: Locally advanced breast cancer: MR imaging for prediction of response to neoadjuvant chemotherapy–results from ACRIN 6657/I-SPY TRIAL. Radiology 2012; 263: pp. 663-672.
19. Smith A.D., Shah S.N., Rini B.I., et. al.: Morphology, Attenuation, Size, and Structure (MASS) criteria: assessing response and predicting clinical outcome in metastatic renal cell carcinoma on antiangiogenic targeted therapy. AJR Am J Roentgenol 2010; 194: pp. 1470-1478.
20. Choi H., Charnsangavej C., Faria S.C., et. al.: Correlation of computed tomography and positron emission tomography in patients with metastatic gastrointestinal stromal tumor treated at a single institution with imatinib mesylate: proposal of new computed tomography response criteria. J Clin Oncol 2007; 25: pp. 1753-1759.