
Rationale and Objectives
There is little agreement within the radiology literature as to the best single measurement for assessing splenomegaly. In this study, we evaluate the correlation of multiple unidirectional measurements of the spleen with splenic volume in patients with cirrhotic liver morphology on computed tomography (CT).
Materials and Methods
Splenic volume was retrospectively calculated from CT examinations of 179 adult patients, 47 of whom were approved as renal donors, and 132 of whom were referred for various other indications, and were found to have cirrhotic liver morphology on CT. Seven unidimensional measurements (long-axis, cranial-caudal, width, and four measures of thickness) of each spleen were evaluated to identify which most closely correlated with the calculated volume.
Results
The splenic width had the best correlation with splenic volume for mild-to-moderate splenomegaly, and the splenic cranial-caudal measurement had the best correlation with splenic volume for massive splenomegaly. Receiver operating characteristic analysis demonstrates that a splenic width measurement of approximately 10.5 cm has a sensitivity of 89% and a specificity of 78% for mild-to-moderate splenomegaly, and a cranial-caudal measurement of 14.6 cm has a sensitivity of 92% and a specificity of 91% for massive splenomegaly.
Conclusions
A splenic width threshold of 10.5 cm is the most sensitive (89%) and specific (78%) single measurement for mild-to-moderate splenomegaly in patients with cirrhotic liver morphology, whereas a cranial-caudal height threshold of 14.6 cm is the most sensitive (92%) and specific (91%) single measurement for massive splenomegaly.
Introduction
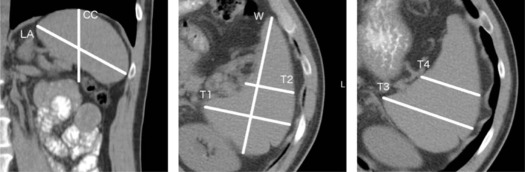
Although nonspecific, splenomegaly is an important finding in a variety of disease processes, including portal hypertension, hematologic disorders, and chronic inflammatory conditions . In patients who have cirrhosis or who are at risk of cirrhosis, identification of splenomegaly is of particular value, as splenomegaly is the most sensitive imaging finding of portal hypertension, and correlation between splenomegaly and the subsequent development of cirrhosis, as well as between splenomegaly and the severity of esophageal varices, has been established . However, determining splenomegaly on computed tomography (CT) imaging has long vexed the radiology community, and there is no established consensus for when or how to diagnose it. The gold standard for determining splenomegaly requires calculating the splenic volume, although this is rarely performed, as it is both technically challenging and time-consuming . Rather, radiologists commonly rely on unidimensional proxy measurements, including cranial-caudal (CC) and long-axis (LA) measurements, as seen in Figure 1 . Despite the common use of these measurements, no single unidimensional measurement has been established in the literature with both a high sensitivity and a high specificity for all cases of splenomegaly, owing largely to the complex and varied shape and orientation of the spleen. For example, the commonly accepted LA and CC measurements of the spleen, ranging from 10 to 13 cm, have been demonstrated to have a low sensitivity (33%–68%) and specificity (68%–76%) for sub-massive splenomegaly, resulting in both underdiagnosis and misdiagnosis .
Get Radiology Tree app to read full this article<
Materials and Methods
Study Patients
Get Radiology Tree app to read full this article<
Get Radiology Tree app to read full this article<
Get Radiology Tree app to read full this article<
Get Radiology Tree app to read full this article<
Segmentation
Get Radiology Tree app to read full this article<
Get Radiology Tree app to read full this article<
Definition of Splenomegaly and Volumetric Thresholds
Get Radiology Tree app to read full this article<
TABLE 1
Studies of Normal Splenic Volume on Computed Tomography
Study Inclusion Criteria Population Volume Linguraru et al., 2013 45 renal donors American Mean: 237 cm 3 Harris et al., 2010 230 consecutive patients who underwent computed tomography (CT) scans for various indications. Patients with conditions that have a known effect on the spleen size were excluded. Japanese Mean: 127 cm 3
Range: 22–417 cm 3 Kaneko et al., 2002 150 liver donors Japanese Mean: 112 cm 3
Range: 32–209 cm 3 Prassopoulos et al., 1997 140 patients referred for an indication unrelated to splenic disease European Mean: 215 cm 3
Range: 107–315 cm 3
Get Radiology Tree app to read full this article<
Get Radiology Tree app to read full this article<
Statistical Analysis
Get Radiology Tree app to read full this article<
Results
Study Patients
Get Radiology Tree app to read full this article<
TABLE 2
Splenic Volume Statistics of the Renal Donor and Cirrhotic Liver Morphology Populations
Population Mean Volume (cc) St. Dev. (cc) Range (cc) Renal donors (48) 251 88 117-462 Cirrhotic liver morphology (132) 742 474 87-2745 <5 St. Dev (64) \* 385 135 87-606 ≥ 5 St. Dev (68) \* 1134 430 631-2745
Get Radiology Tree app to read full this article<
Get Radiology Tree app to read full this article<
Segmentation
Get Radiology Tree app to read full this article<
![Figure 3, Bland-Altman volumetric measurement agreement. Bland-Altman volumetric measurement agreement plots between two observers. The mean error is shown as the central dashed line, and the 95% limits of agreement (±1.96 standard deviation [SD]) are shown as the peripheral dashed lines.](https://storage.googleapis.com/dl.dentistrykey.com/clinical/TheBestSingleMeasurementforAssessingSplenomegalyinPatientswithCirrhoticLiverMorphology/2_1s20S1076633217302970.jpg)
Get Radiology Tree app to read full this article<
Relationship Between Splenic Volume and Unidirectional Measurements
Get Radiology Tree app to read full this article<
![Figure 4, Bland-Altman unidirectional measurement agreement. Bland-Altman unidirectional measurement agreement plots between two observers. The mean error is shown as the central dashed line and the 95% limits of agreement (±1.96 standard deviation [SD]) are shown as the peripheral dashed lines.](https://storage.googleapis.com/dl.dentistrykey.com/clinical/TheBestSingleMeasurementforAssessingSplenomegalyinPatientswithCirrhoticLiverMorphology/3_1s20S1076633217302970.jpg)
Get Radiology Tree app to read full this article<
Get Radiology Tree app to read full this article<
TABLE 3
Correlation Between Unidirectional Measurements and Splenic Volume
R Value Dimension <5 St. Dev. ≥5 St. Dev. Long axis 0.68 0.76 Cranial-caudal 0.69 0.86 Width 0.75 0.69 Transverse 1 0.62 0.59 Transverse 2 0.62 0.60 Transverse 3 0.74 0.74 Transverse 4 0.66 0.70
Correlation coefficients for each of the unidirectional measurements obtained in the cirrhotic liver morphology population. Correlation is greatest for width within 5 standard deviations of the mean (mild-to-moderate splenomegaly), and greatest for cranial-caudal above 5 standard deviations (massive splenomegaly).
Get Radiology Tree app to read full this article<
Get Radiology Tree app to read full this article<
![Figure 5, Receiver operating characteristic curves. Width has both the greatest area under the curve for the population of patients with cirrhotic liver morphology and mild-to-moderate splenomegaly (splenic volume less than 5 standard deviations [SD] above the mean) ( left ), as well as for the entire population of patients with cirrhotic liver morphology ( right ). Note that only the line corresponding to the W measurement is labeled in each figure.](https://storage.googleapis.com/dl.dentistrykey.com/clinical/TheBestSingleMeasurementforAssessingSplenomegalyinPatientswithCirrhoticLiverMorphology/4_1s20S1076633217302970.jpg)
Get Radiology Tree app to read full this article<
Discussion
Get Radiology Tree app to read full this article<
Get Radiology Tree app to read full this article<
Get Radiology Tree app to read full this article<
Get Radiology Tree app to read full this article<
Get Radiology Tree app to read full this article<
Get Radiology Tree app to read full this article<
References
1. Balato N., Napolitano M., Ayala F., et. al.: Nonalcoholic fatty liver disease, spleen and psoriasis: new aspects of low-grade chronic inflammation. World J Gastroenterol 2015; 21: pp. 6892-6897.
2. Berzigotti A., Seijo S., Reverter E., et. al.: Assessing portal hypertension in liver diseases. Expert Rev Gastroenterol Hepatol 2013; 7: pp. 141-155.
3. Kalpadakis C., Pangalis G.A., Angelopoulou M.K., et. al.: Treatment of splenic marginal zone lymphoma with rituximab monotherapy: progress report and comparison with splenectomy. Oncologist 2013; 18: pp. 190-197.
4. Kotlyar S., Nteziyaremye J., Olupot-Olupot P., et. al.: Spleen volume and clinical disease manifestations of severe Plasmodium falciparum malaria in African children. Trans R Soc Trop Med Hyg 2014; 108: pp. 283-289.
5. Picardi M., Martinelli V., Ciancia R., et. al.: Measurement of spleen volume by ultrasound scanning in patients with thrombocytosis: a prospective study. Blood 2002; 99: pp. 4228-4230.
6. Sahota P., Vahidy F., Nguyen C., et. al.: Changes in spleen size in patients with acute ischemic stroke: a pilot observational study. Int J Stroke 2013; 8: pp. 60-67.
7. Suzuki K., Kirikoshi H., Yoneda M., et. al.: Measurement of spleen volume is useful for distinguishing between simple steatosis and early-stage non-alcoholic steatohepatitis. Hepatol Res 2010; 40: pp. 693-700.
8. Tsushima Y., Endo K.: Spleen enlargement in patients with nonalcoholic fatty liver: correlation between degree of fatty infiltration in liver and size of spleen. Dig Dis Sci 2000; 45: pp. 196-200.
9. Vahidy F.S., Parsha K.N., Rahbar M.H., et. al.: Acute splenic responses in patients with ischemic stroke and intracerebral hemorrhage. J Cereb Blood Flow Metab 2016; 36: pp. 1012-1021.
10. Mandal L., Mandal S.K., Bandyopadhyay D., et. al.: Correlation of portal vein diameter and splenic size with gastro-oesophageal varices in cirrhosis of liver. J Ind Aca Clin Med 2011; 12: pp. 266-270.
11. Singh I.K., Bhatnagar V., Gupta A.K., et. al.: Correlation of splenic volume with hematological parameters, splenic vein diameter, portal pressure and grade of varices in extrahepatic portal vein obstruction in children. Pediatr Surg Int 2011; 27: pp. 467-471.
12. Pozo A.L., Godfrey E.M., Bowles K.M.: Splenomegaly: investigation, diagnosis and management. Blood Rev 2009; 23: pp. 105-111.
13. Linguraru M.G., Sandberg J.K., Jones E.C., et. al.: Assessing splenomegaly: automated volumetric analysis of the spleen. Acad Radiol 2013; 20: pp. 675-684.
14. Harris A., Kamishima T., Hao H.Y., et. al.: Splenic volume measurements on computed tomography utilizing automatically contouring software and its relationship with age, gender, and anthropometric parameters. Eur J Radiol 2010; 75: pp. e97-e101.
15. Kaneko J., Sugawara Y., Matsui Y., et. al.: Normal splenic volume in adults by computed tomography. Hepatogastroenterology 2002; 49: pp. 1726-1727.
16. Prassopoulos P., Daskalogiannaki M., Raissaki M., et. al.: Determination of normal splenic volume on computed tomography in relation to age, gender and body habitus. Eur Radiol 1997; 7: pp. 246-248.
17. Bezerra A.S., D’Ippolito G., Faintuch S., et. al.: Determination of splenomegaly by CT: is there a place for a single measurement?. Am J Roentgenol 2005; 184: pp. 1510-1513.
18. Yushkevich P.A., Piven J., Hazlett H.C., et. al.: User-guided 3D active contour segmentation of anatomical structures: significantly improved efficiency and reliability. Neuroimage 2006; 31: pp. 1116-1128.
19. Friedberg R.C., Souers R., Wagar E.A., et. al.: The origin of reference intervals. Arch Pathol Lab Med 2007; 131: pp. 348-357.
20. Inai K., Noriki S., Kinoshita K., et. al.: Feasibility of liver weight estimation by postmortem computed tomography images: an autopsy study. Pathol Int 2014; 64: pp. 315-324.
21. Patel A.G., Parker J.E., Wallwork B., et. al.: Massive splenomegaly is associated with significant morbidity after laparoscopic splenectomy. Ann Surg 2003; 238: pp. 235-240.
22. Letoquart J.-P., Gamma A.L., Kunin N., et. al.: Splenectomy for splenomegaly exceeding 1000 grams: analysis of 47 patients. Br J Surg 1993; 80: pp. 334-335.
23. Schrier S.L.: Approach to the adult patient with splenomegaly and other splenic disorders.Mentzer W.UpToDate.2016.UpToDateWaltham, MA:
24. Lackner K., Brecht G., Janson R., et. al.: The value of computer tomography in the staging of primary lymph node neoplasms. Rofo Fortschr Geb Rontgenstr Neuen Bildgeb Verfahr Fortschr Geb Rontgenstr Nuklearmed 1980; 132: pp. 21-30. in German
25. EasyROC : a web-tool for ROC curve analysis (ver. 1.3). n.d.; Available at: http://www.biosoft.hacettepe.edu.tr/easyROC/
26. Jones E., Oliphant E., Peterson P., et. al.: SciPy: Open Source Scientific Tools for Python. Available at: http://www.scipy.org/