
Rationale and Objectives
We sought to determine how measures of nodule diameter and volume on computed tomography (CT) vary with changes in inspiratory level.
Materials and Methods
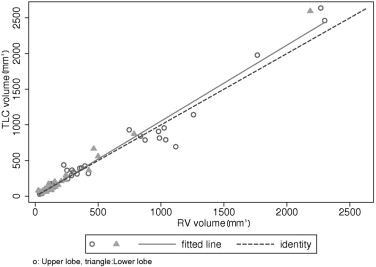
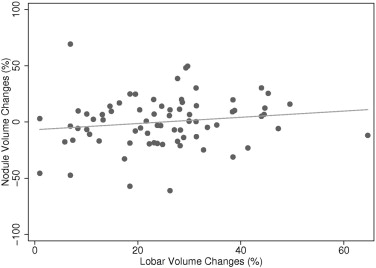
CT scans were performed with inspiration suspended at total lung capacity (TLC) and then at residual volume (RV) in 41 subjects, in whom 75 indeterminate lung nodules were detected. A fully automated contouring program was used to segment the lungs; followed by segmentation of all nodules and the corresponding lobe using semiautomated contouring in both TLC and RV scans. The percent changes in lung and lobar volumes between TLC and RV were correlated with percent changes in nodule diameters and volumes.
Results
Both nodule diameter and volume varied nonuniformly from TLC to RV—some nodules decreased in size, while others increased. There was a 16.8% mean change in absolute volume across all nodules. Stratified by size, the mean value of the absolute percent volume changes for nodules ≥5 mm and <5 mm were not significantly different ( P = .26). Stratified by maximum attenuation, the mean value of the absolute percent volume changes between the TLC and RV series for noncalcified (17.7%, SD = 13.1) and completely calcified nodules (8.6% SD = 5.7) were significantly different ( P < .05).
Conclusion
Significant differences in nodule size were measured between TLC and RV scans. This has important implications for standardizing acquisition protocols in any setting where size and, more important, size change are being used for purposes of lung cancer staging, nodule characterization, or treatment response assessment.
The lung is one of the predilection organs of metastases in the body, and also the site of the most frequently occurring cancer in the world ( ). On CT, primary lung cancers and extrapulmonary metastatic lesions commonly present as noncalcified pulmonary nodules.
The measurement of pulmonary nodules can be made using unidimensional, bidimensional, or volumetric techniques. Historically, size measurements derived from CT have been the mainstay in determining response assessment to cytotoxic therapies. Using bidimensional methods developed by the World Health Organization (WHO), measurements are achieved by multiplying a tumor’s maximum diameter in the transverse plane by its largest perpendicular diameter on the same image, yielding a cross product. Pretreatment and post-treatment cross products are used to determine treatment response ( ). Under these guidelines, tumor response to treatment is classified into one of four categories: complete response, partial response, stable disease, and disease progression ( ). Response Evaluation Criteria in Solid Tumors (RECIST) criteria offer a simplified extraction of imaging data for wide application in clinical trials, presuming that linear measures are an adequate substitute for 2D methods ( ). RECIST criteria represent a unidimensional method, which corresponds to the sums of nodules’ longest diameters in pretreatment and post-treatment image sequences ( ).
Get Radiology Tree app to read full this article<
Get Radiology Tree app to read full this article<
Get Radiology Tree app to read full this article<
Get Radiology Tree app to read full this article<
Methods and materials
Nodule Database
Get Radiology Tree app to read full this article<
Imaging Protocol
Get Radiology Tree app to read full this article<
Get Radiology Tree app to read full this article<
Get Radiology Tree app to read full this article<
Lung, Lobar, and Nodule Segmentation and Measurement
Get Radiology Tree app to read full this article<
Get Radiology Tree app to read full this article<
Get Radiology Tree app to read full this article<
Get Radiology Tree app to read full this article<
Get Radiology Tree app to read full this article<
Statistical Analyses
Get Radiology Tree app to read full this article<
Get Radiology Tree app to read full this article<
Results
Get Radiology Tree app to read full this article<
Table 1
Size Characteristics of the nodule dataset
Value (75 nodules) Maximum axial diameter (mm) at TLC Maximum axial diameter (mm) at RV Nodule volume (mm 3 ) at TLC Nodule volume (mm 3 ) at RV Mean 9.3 9.3 390 377 Median 7.6 7.6 165 156 SD 4.6 4.7 559 516 Minimum 3.2 3.4 30 25 Maximum 22.4 22.5 2638 2300
TLC = total lung capacity; RV = residual volume.
Get Radiology Tree app to read full this article<
Get Radiology Tree app to read full this article<
Get Radiology Tree app to read full this article<
Get Radiology Tree app to read full this article<
Get Radiology Tree app to read full this article<
Get Radiology Tree app to read full this article<
Get Radiology Tree app to read full this article<
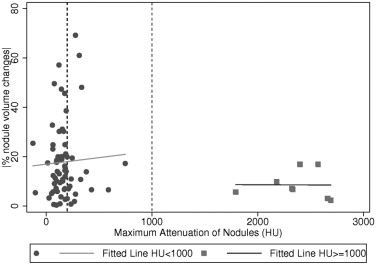
Table 2
Mean value of the absolute percent changes of nodule volume when the nodules are stratified by maximum HU (<200, [200, 1000], ≥1000) and size of nodules (<5 mm and ≥5 mm)
TLC maximum diameter Nodule maximum HU at TLC Total Variable <200 HU 200–1000 HU ≥1000 HU <5 mm N 6 2 0 8 Mean 22.21 8.42 • 18.76 SD 13.45 7.68 • 13.36 Median 21.54 8.42 • 17.20 Interquartile range 10.41 10.86 • 14.34 ≥5 mm N 45 14 8 67 Mean 17.14 19.44 8.55 16.60 SD 13.09 22.65 5.65 15.12 Median 14.00 9.37 6.89 11.95 Interquartile range 13.93 12.87 9.01 13.36 Total N 51 16 8 75 Mean 17.74 18.06 8.55 16.83 SD 13.10 21.51 5.65 14.87 Median 15.84 9.37 6.89 13.06 Interquartile range 17.56 12.65 9.01 13.42
TLC = total lung capacity; HU = Hounsfield units; SD = standard deviation; Interquartile range = 75th percentile − 25th percentile.
Get Radiology Tree app to read full this article<
Get Radiology Tree app to read full this article<
Get Radiology Tree app to read full this article<
Discussion
Get Radiology Tree app to read full this article<
Get Radiology Tree app to read full this article<
Get Radiology Tree app to read full this article<
Get Radiology Tree app to read full this article<
Get Radiology Tree app to read full this article<
Get Radiology Tree app to read full this article<
Get Radiology Tree app to read full this article<
Get Radiology Tree app to read full this article<
Get Radiology Tree app to read full this article<
Get Radiology Tree app to read full this article<
Get Radiology Tree app to read full this article<
Conclusion
Get Radiology Tree app to read full this article<
Acknowledgments
Get Radiology Tree app to read full this article<
Get Radiology Tree app to read full this article<
References
1. Alberg A.J., Samet J.M.: Epidemiology of lung cancer. Chest 2003; 123: pp. 21S-49S.
2. World Health Organization: 1979.World Health OrganizationGeneva, Switzerland World Health Organization offset publication No. 48.
3. Tsuchida Y., Therasse P.: Response evaluation criteria in solid tumors (RECIST): New guidelines. Med Pediatr Oncol 2001; 37: pp. 1-3.
4. Dachman A.H., MacEneaney P.M., Adedipe A., Carlin M., Schumm L.P.: Tumor size on computed tomography scans. Cancer 2001; 91: pp. 555-560.
5. Sohaib S.A., Turner B., Hanson J.A., Farguharson M., Oliver R.T., Reznek R.H.: CT assessment of tumor response to treatment comparison of linear, cross-sectional and volumetric measures of tumour size. Br J Radiol 2000; 73: pp. 1118-1178.
6. Werner-Wasik M., Xiao Y., Pequignot E., Curran W.J., Hauck W.: Assessment of lung cancer response after nonoperative therapy tumor diameter, bidimensional product, and volume: A serial CT scan-based study. Int J Radiat Oncol Biol Phys 2001; 51: pp. 56-61.
7. Hopper K.D., Kasales C.J., Egglie K.D.: The impact of 2D versus 3D quantitation of tumor bulk determination on current methods of assessing response to treatment. J Comput Assist Tomogr 1996; 20: pp. 930-937.
8. Van Hoe L., Van Cutsem E., Vergote I., Baert A.L., Bellon E., Dupont P., et. al.: Size quantification of liver metastases in patients undergoing cancer treatment: Reproducibility of one-, two-, and three-dimensional measurements determined with spiral CT. Radiology 1997; 202: pp. 671-675.
9. Tran L.N., Brown M.S., Goldin J.G., Yan X., Pais R.C., McNitt-Gray M.F., et. al.: Comparison of treatment response classifications between unidimensional, bidimensional, and volumetric measurements of metastatic lung lesions on chest computed tomography. Acad Radiol 2004; 11: pp. 1355-1360.
10. Yankelevitz D.L., Henschke C.I.: Does 2-year stability imply that pulmonary nodules are benign?. AJR Am J Roentgenol 1997; 168: pp. 325-328.
11. Mountain C.F.: Revisions in the International System for Staging Lung Cancer. Chest 1997; 111: pp. 1710-1717.
12. Austin J.H., Mueller N.L., Friedman P.J., Hansell D.M., Naidich D.P., Remy-Jardin M., et. al.: Glossary of terms for CT of the lungs: Recommendations of the Nomenclature Committee of the Fleischner Society. Radiology 1996; 200: pp. 327-331.
13. Armato S.G., McLennan G., McNitt-Gray M.F., Meyer C.R., Yankelevitz D., Aberle D.R., et. al., Lung Image Database Consortium Research Group Lung Image Database Consortium: Developing a resource for the medical imaging research community. Radiology 2004; 232: pp. 739-748.
14. Brown M.S., Feng W.C., Hall T.R., McNitt-Gray M.F., Churchill B.M.: Knowledge-based segmentation of pediatric kidneys in CT images for measurement of parenchymal volume. J Comp Assist Tomogr 2001; 25: pp. 639-648.
15. Brown M.S., Goldin J.G., McNitt-Gray M.F., Greaser L.E., Sapra A., Li K.T., et. al.: Knowledge-based segmentation of thoracic computed tomography images for assessment of split lung function. Med Phys 2000; 27: pp. 592-598.
16. Schaefer J.F., Vollmar J., Schick F., Vonthein R., Seemann M.D., Aebert H., et. al.: Solitary pulmonary nodules: Dynamic contrast-enhanced MR imaging—Perfusion differences in malignant and benign lesions. Radiology 2004; 232: pp. 544-553.
17. Yankelevitz D.F., Reeves A.P., Kostis W.J., Zhao B., Henschke C.I.: Small pulmonary nodules: Volumetrically determined growth rates based on CT evaluation. Radiology 2000; 217: pp. 251-256.
18. Ko J.P., Rusinek H., Jacobs E.L., Babb J.S., Betke M., McGuinness G., et. al.: Small pulmonary nodules: Volume measurement at chest CT—phantom study. Radiology 2003; 228: pp. 864-870.
19. Winer-Muram H.T., Jennings S.G., Meyer C.A., Liang Y., Aisen A.M., Tarver R.D., et. al.: Effect of varying CT section width on volumetric measurement of lung tumors and application of compensatory equations. Radiology 2003; 229: pp. 184-194.
20. Wormanns D., Kohl G., Klotz E., Marheine A., Beyer F., Heindel W., et. al.: Volumetric measurements of pulmonary nodules at multi-row detector CT: In vivo reproducibility. Eur Radiol 2004; 14: pp. 86-92.
21. Revel M.P., Lefort C., Bissery A., Bienvenu M., Avcard L., Chatellier G., et. al.: Pulmonary nodules: Preliminary experience with three-dimensional evaluation. Radiology 2004; 231: pp. 459-466.
22. Goodman L.R., Gulsun M., Washington L., Nagy P.G., Piacsek K.L.: Inherent variability of CT lung nodule measurements in vivo using semiautomated volumetric measurements. AJR Am J Roentgenol 2006; 186: pp. 989-994.
23. Gietema H.A., Wang Y., Dongming X., Van Klaveren R.J.: Pulmonary nodules detected at lung cancer screening: Interobserver variability of semiautomated volume measurements. Radiology 2006; 241: pp. 251-257.
24. Bogot N.R., Kazerooni E.A., Kelly A.M., Quint L.E., Desjardins B., Nan B.: Interobserver and intraobserver variability in the assessment of pulmonary nodule size on CT using film and computer display methods. Acad Radiol 2005; 12: pp. 948-956.
25. Reeves A.P., Chan A.B., Yankelevitz D.F., Henschke C.I., Kressler B., Kostis W.J.: On measuring the change in size of pulmonary nodules. IEEE Trans Med Imaging 2006; 25: pp. 435-450.
26. Matsuoka S., Kurihara Y., Yagihashi K., Niimi H., Nakajima Y.: Peripheral solitary pulmonary nodule: CT findings in patients with pulmonary emphysema. Radiology 2005; 235: pp. 266-273.
27. Boll D.T., Gilkeson R.C., Fleiter T.R., Blackham K.A., Duerk J.L., Lewin J.S.: Volumetric assessment of pulmonary nodules with ECG-gated MDCT. AJR Am J Roentgenol 2004; 183: pp. 1217-1223.