
Rationale and Objectives
To examine the effect of changes in utilization and advances in cross-sectional imaging on radiologists’ workload.
Materials and Methods
All computed tomography (CT) and magnetic resonance imaging (MRI) examinations performed at a single institution between 1999 and 2010 were identified and associated with the total number of images for each examination. Annual trends in institutional numbers of interpreted examinations and images were translated to changes in daily workload for the individual radiologist by normalizing to the number of dedicated daily CT and MRI work assignments, assuming a 255-day/8-hour work day schedule. Temporal changes in institutional and individual workload were assessed by Sen’s slope analysis ( Q = median slope) and Mann–Kendall test ( Z = Z statistic).
Results
From 1999 to 2010, a total of 1,517,149 cross-sectional imaging studies (CT = 994,471; MRI = 522,678) comprising 539,210,581 images (CT = 339,830,947; MRI = 199,379,634) were evaluated at our institution. Total annual cross-sectional studies steadily increased from 84,409 in 1999 to 147,336 in 2010, representing a twofold increase in workload ( Q = 6465/year, Z = 4.2, P < .0001). Concomitantly, the number of annual departmental cross-sectional images interpreted increased from 9,294,140 in 1990 to 94,271,551 in 2010, representing a 10-fold increase ( Q = 8707876/year, Z = 4.5, P < .0001). Adjusting for staffing changes, the number of images requiring interpretation per minute of every workday per staff radiologist increased from 2.9 in 1999 to 16.1 in 2010 ( Q = 1.7/year, Z = 4.3, P < .0001).
Conclusions
Imaging volumes have grown at a disproportionate rate to imaging utilization increases at our institution. The average radiologist interpreting CT or MRI examinations must now interpret one image every 3–4 seconds in an 8-hour workday to meet workload demands.
Over the past decade, advanced cross-sectional imaging utilization has been rapidly increasing . Fueled by technical innovations that have improved the anatomic resolution, sensitivity, and specificity of computed tomography (CT) and magnetic resonance imaging (MRI) modalities, medical practice has evolved to heavily rely on these imaging techniques over older, conventional radiographic imaging modalities . Indeed, many clinical practice guidelines, particularly in the emergent setting, have supplanted conventional radiography with CT and MRI examinations as the key elements in their clinical decision-making algorithm . Much of this evolution has been driven by evidence-based medicine of the superiority of cross-sectional imaging over conventional radiography in the accurate detection of disease . Advances in multidetector CT, dual-source CT, gradient-based MR pulse sequences, and novel pulse sequences have also greatly diminished the acquisition time of these studies, permitting a higher-throughput model of health care delivery .
As imaging reimbursements decline, health care providers are being forced to compensate by increasing their productivity . Although the information technology infrastructure of radiology has evolved to meet the demands of higher imaging volumes vis-a-vis improved computational power, storage capacity, and workflow efficiency in the picture archiving and communication system (PACS) environment, the amount of information (images) generated per examination has also substantially increased as a result of the technological advances noted previously . In turn, the modern radiologist must now interpret many times more examination images when compared to similar examinations performed 10–20 years ago. Although these advances in sensitivity and specificity are thought to translate to improved patient care, these increasing imaging volumes are placing an ever-increasing burden on the practicing radiologist . As the workload continues to increase, there is concern that the quality of the health care delivered by the radiologist will decline in the form of increased detection errors as a result of increased fatigue and stress . As errors in the interpretation of radiologic images can be associated with catastrophic clinical outcomes, such concerns are tantamount to patient safety.
Get Radiology Tree app to read full this article<
Materials and methods
Study Design
Get Radiology Tree app to read full this article<
Study Grouping
Get Radiology Tree app to read full this article<
Departmental Staffing/Practice Patterns
Get Radiology Tree app to read full this article<
Departmental Imaging and Data Storage Policies
Get Radiology Tree app to read full this article<
Outcomes
Get Radiology Tree app to read full this article<
Statistical Analysis
Get Radiology Tree app to read full this article<
Results
Trends in Number of Examinations Over Time
Get Radiology Tree app to read full this article<
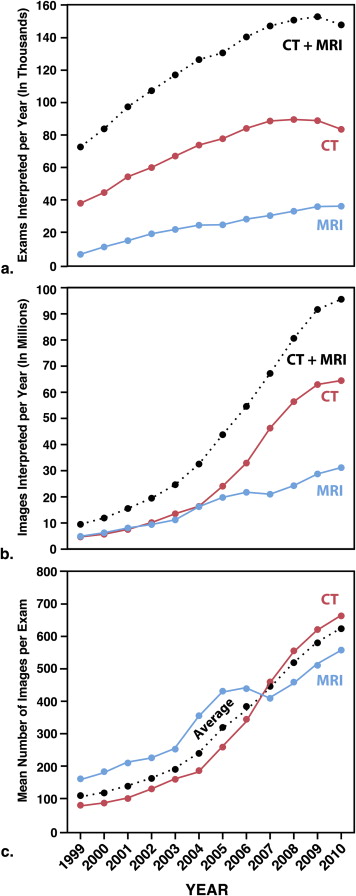
Table 1
Trends Over Time in Radiologist’s Workloads
Type Change Per Year Median Change (95% CI) ∗ P Value Total examinations interpreted/year CT 4499 (3218 to 5317) <.0001 MRI 2215 (1885 to 2408) <.0001 CT + MRI 6464 (5069 to 7885) <.0001 Total images interpreted/year CT 6,112,616 (8,160,952 to 3,870,723) <.0001 MRI 2,401,985 (2,868,584 to 2,051,647) <.0001 CT + MRI 8,707,876 (8,160,952 to 10,993,169) <.0001 Mean number of images/study CT 59 (39 to 78) <.0001 MRI 38 (29 to 45) <.0001 CT + MRI 54 (43 to 63) <.0001 Number of worklines † CT 1.2 (0.9 to 1.3) <.001 MRI 0.3 (−0.1 to 0.6) .08 Examinations interpreted/year/workline † CT −86 (−170 to 12) .04 MRI 76 (21 to 135) .01 CT + MRI 18 (−75 to 70) .32 Images interpreted/year/workline † CT 214,873 (164,376 to 249,607) <.0001 MRI 107,145 (74,876 to 134,855) <.0001 CT + MRI 179,071 (152,309 to 199,931) <.0001 Images interpreted/minute CT 1.8 (1.34 to 2.04) <.0001 MRI 0.9 (0.61 to 1.01) <.0001 CT + MRI 1.5 (1.24 to 1.63) <.0001
CI, confidence interval; CT, computed tomography; MRI, magnetic resonance imaging.
Get Radiology Tree app to read full this article<
Get Radiology Tree app to read full this article<
Get Radiology Tree app to read full this article<
Trends in Number of Images per Examination
Get Radiology Tree app to read full this article<
Imaging Trends by Examination Type and Subspecialty
Get Radiology Tree app to read full this article<
![Figure 2, Imaging utilization by examination type and subspecialty. (a) Trends in annual numbers of CT ( solid lines ) and MRI ( dashed lines ) images, sorted by type of examination (angiographic studies [ red lines ], diagnostic studies [ blue lines ], interventional studies [ green lines ]). (b) Trends in annual numbers of CT ( solid lines ) and MRI ( dashed lines ) images, sorted by subspecialty. Tabular displays of the average change in the annual number of interpreted images (Sen's slope [ Q ]) and the associated P value are shown for each modality–examination type and modality–subspecialty combination. CT, computed tomography; MRI, magnetic resonance imaging. (Color version of figure is available online.)](https://storage.googleapis.com/dl.dentistrykey.com/clinical/TheEffectsofChangesinUtilizationandTechnologicalAdvancementsofCrossSectionalImagingonRadiologistWorkload/1_1s20S1076633215002457.jpg)
Get Radiology Tree app to read full this article<
Trends in Radiologist Workload Over Time
Get Radiology Tree app to read full this article<
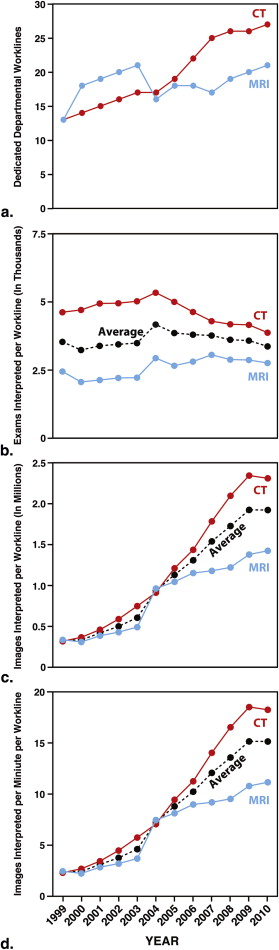
Get Radiology Tree app to read full this article<
Discussion
Get Radiology Tree app to read full this article<
Get Radiology Tree app to read full this article<
Get Radiology Tree app to read full this article<
Get Radiology Tree app to read full this article<
Get Radiology Tree app to read full this article<
Get Radiology Tree app to read full this article<
Get Radiology Tree app to read full this article<
References
1. Brenner D.J., Hall E.J.: Computed tomography–an increasing source of radiation exposure. N Engl J Med 2007; 357: pp. 2277-2284.
2. Boland G.W., Houghton M.P., Marchione D.G., et. al.: Maximizing outpatient computed tomography productivity using multiple technologists. J Am Coll Radiol 2008; 5: pp. 119-125.
3. Boland G.W., Guimaraes A.S., Mueller P.R.: The radiologist’s conundrum: benefits and costs of increasing CT capacity and utilization. Eur Radiol 2009; 19: pp. 9-11. discussion 2
4. Korley F.K., Pham J.C., Kirsch T.D.: Use of advanced radiology during visits to US emergency departments for injury-related conditions, 1998-2007. Jama 2010; 304: pp. 1465-1471.
5. Limkakeng A.T., Halpern E., Takakuwa K.M.: Sixty-four-slice multidetector computed tomography: the future of ED cardiac care. Am J Emerg Med 2007; 25: pp. 450-458.
6. Robb R.A.: X-ray computed tomography: an engineering synthesis of multiscientific principles. Crit Rev Biomed Eng 1982; 7: pp. 265-333.
7. Siegel M.J., Evens R.G.: Advances in the use of computed tomography. Jama 1999; 281: pp. 1252-1254.
8. Villafana T.: Technologic advances in computed tomography. Curr Opin Radiol 1991; 3: pp. 275-283.
9. Alvarez-Linera J.: 3T MRI: advances in brain imaging. Eur J Radiol 2008; 67: pp. 415-426.
10. Blackwell C.D., Gorelick M., Holmes J.F., et. al.: Pediatric head trauma: changes in use of computed tomography in emergency departments in the United States over time. Ann Emerg Med 2007; 49: pp. 320-324.
11. Doria A.S., Moineddin R., Kellenberger C.J., et. al.: US or CT for diagnosis of appendicitis in children and adults? A meta-analysis. Radiology 2006; 241: pp. 83-94.
12. Holmes J.F., Akkinepalli R.: Computed tomography versus plain radiography to screen for cervical spine injury: a meta-analysis. J Trauma 2005; 58: pp. 902-905.
13. Jones C., Jazayeri F.: Evolving standards of practice for cervical spine imaging in trauma: a retrospective review. Australas Radiol 2007; 51: pp. 420-425.
14. Markel T.A., Kumar R., Koontz N.A., et. al.: The utility of computed tomography as a screening tool for the evaluation of pediatric blunt chest trauma. J Trauma 2009; 67: pp. 23-28.
15. Pines J.M.: Trends in the rates of radiography use and important diagnoses in emergency department patients with abdominal pain. Med Care 2009; 47: pp. 782-786.
16. Raja A.S., Andruchow J., Zane R., et. al.: Use of neuroimaging in US emergency departments. Arch Intern Med 2011; 171: pp. 260-262.
17. Rosengren D., Brown A.F., Chu K.: Radiological imaging to improve the emergency department diagnosis of acute appendicitis. Emerg Med Australas 2004; 16: pp. 410-416.
18. Street M., Brady Z., Van Every B., et. al.: Radiation exposure and the justification of computed tomography scanning in an Australian hospital emergency department. Intern Med J 2009; 39: pp. 713-719.
19. Kochergaev O.V., Shapovalov M.V.: [Efficacy of spiral computed tomography in diagnosis of thorax injuries due to combined trauma]. Khirurgiia (Mosk) 2006; 3: pp. 38-42.
20. Blamire A.M.: The technology of MRI–the next 10 years?. Br J Radiol 2008; 81: pp. 601-617.
21. Ortendahl D.A., Crooks L.E.: Directions in magnetic resonance imaging technology. Med Prog Technol 1989; 15: pp. 171-184.
22. Runge V.M.: Current technological advances in magnetic resonance with critical impact for clinical diagnosis and therapy. Invest Radiol 2013; 48: pp. 869-877.
23. Bates D.W., Gawande A.A.: Improving safety with information technology. N Engl J Med 2003; 348: pp. 2526-2534.
24. Erickson B.J., Persons K.R., Hangiandreou N.J., et. al.: Requirements for an enterprise digital image archive. J Digit Imaging 2001; 14: pp. 72-82.
25. Thrall J.H.: Quality and safety revolution in health care. Radiology 2004; 233: pp. 3-6.
26. Dhanoa D., Dhesi T.S., Burton K.R., et. al.: The evolving role of the radiologist: the Vancouver workload utilization evaluation study. J Am Coll Radiol 2013; 10: pp. 764-769.
27. Pitman A.G., Jones D.N.: Radiologist workloads in teaching hospital departments: measuring the workload. Australas Radiol 2006; 50: pp. 12-20.
28. Lee C.S., Nagy P.G., Weaver S.J., et. al.: Cognitive and system factors contributing to diagnostic errors in radiology. AJR Am J Roentgenol 2013; 201: pp. 611-617.
29. Krupinski E.A., Berbaum K.S., Caldwell R.T., et. al.: Long radiology workdays reduce detection and accommodation accuracy. J Am Coll Radiol 2010; 7: pp. 698-704.
30. Computing RFfS. R: A language and environment for statistical computing. Available at: http://www.R-project.org . Accessed February 1, 2014.
31. Sen P.K.: Estimates of the regression coefficient based on Kendall’s tau. Journal of the American Statistical Association 1968; 63: pp. 1379-1389.
32. Mann H.B.: Nonparametric tests against trend. Econometrica 1945; 13: pp. 245-259.
33. Wickham H.: ggplot2: elegant graphics for data analysis.2009.SpringerNew York, NY
34. Boone J.M., Brunberg J.A.: Computed tomography use in a tertiary care university hospital. J Am Coll Radiol 2008; 5: pp. 132-138.
35. Broder J., Fordham L.A., Warshauer D.M.: Increasing utilization of computed tomography in the pediatric emergency department, 2000-2006. Emerg Radiol 2007; 14: pp. 227-232.
36. Broder J., Warshauer D.M.: Increasing utilization of computed tomography in the adult emergency department, 2000-2005. Emerg Radiol 2006; 13: pp. 25-30.
37. Kocher K.E., Meurer W.J., Fazel R., et. al.: National trends in use of computed tomography in the emergency department. Ann Emerg Med 2011; 58: pp. 452-462 e3.
38. Lee J., Kirschner J., Pawa S., et. al.: Computed tomography use in the adult emergency department of an academic urban hospital from 2001 to 2007. Ann Emerg Med 2010; 56: pp. 591-596.
39. Tsze D.S., Asnis L.M., Merchant R.C., et. al.: Increasing computed tomography use for patients with appendicitis and discrepancies in pain management between adults and children: an analysis of the NHAMCS. Ann Emerg Med 2012; 59: pp. 395-403.
40. Weir I.D., Drescher F., Cousin D., et. al.: Trends in use and yield of chest computed tomography with angiography for diagnosis of pulmonary embolism in a Connecticut hospital emergency department. Conn Med 2010; 74: pp. 5-9.
41. Zhou J.C., Zheng S.W., Yu Y.X., et. al.: Trends in computed tomography utilization and association with hospital outcomes in a Chinese emergency department. PLoS One 2012; 7: pp. e40403.
42. Prakken N.H., Velthuis B.K., Cramer M.J., et. al.: Advances in cardiac imaging: the role of magnetic resonance imaging and computed tomography in identifying athletes at risk. Br J Sports Med 2009; 43: pp. 677-684.
43. Hendee W.R., Becker G.J., Borgstede J.P., et. al.: Addressing overutilization in medical imaging. Radiology 2010; 257: pp. 240-245.