
Rational and Objectives
Low intensity vibration (LIV) may represent a nondrug strategy to mitigate bone deficits in patients with end-stage renal disease.
Materials and Methods
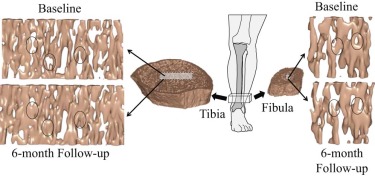
Thirty end-stage renal patients on maintenance hemodialysis were randomized to stand for 20 minutes each day on either an active or placebo LIV device. Analysis at baseline and completion of 6-month intervention included magnetic resonance imaging (tibia and fibula stiffness; trabecular thickness, number, separation, bone volume fraction, plate-to-rod ratio; and cortical bone porosity), dual-energy X-ray absorptiometry (hip and spine bone mineral density [BMD]), and peripheral quantitative computed tomography (tibia trabecular and cortical BMD; calf muscle cross-sectional area).
Results
Intention-to-treat analysis did not show any significant changes in outcomes associated with LIV. Subjects using the active device and with greater than the median adherence (70%) demonstrated an increase in distal tibia stiffness (5.3%), trabecular number (1.7%), BMD (2.3%), and plate-to-rod ratio (6.5%), and a decrease in trabecular separation (−1.8%). Changes in calf muscle cross-sectional area were associated with changes in distal tibia stiffness (R = 0.85), trabecular bone volume/total volume (R = 0.91), number (R = 0.92), and separation (R = −0.94) in the active group but not in the placebo group. Baseline parathyroid hormone levels were positively associated with increased cortical bone porosity over the 6-month study period in the placebo group (R = 0.55) but not in the active group (R = 0.01). No changes were observed in the nondistal tibia locations for either group except a decrease in hip BMD in the placebo group (−1.7%).
Conclusion
Outcomes and adherence thresholds identified from this pilot study could guide future longitudinal studies involving vibration therapy.
Introduction
Renal osteodystrophy is a multifactorial and pervasive disorder of bone and mineral metabolism that parallels chronic kidney disease. This pernicious disease reduces bone quantity, disrupts bone turnover, and compromises mineralization processes, resulting in a skeleton highly susceptible to fracture . This higher susceptibility to fracture is based on several factors. For one, elevated expression of the hormone fibroblast growth factor 23 in osteocytes during the early course of chronic kidney disease plays a critical role in the progression of abnormal mineral ion homeostasis by decreasing 1,25(OH) 2 vitamin D and ultimately impairing intestinal calcium absorption and increasing serum parathyroid hormone (PTH) . The overall relative risk for hip fracture has been estimated to be about 4.4 times greater for patients on dialysis as compared to people of the same sex in the general population, and mortality risk following fractures are markedly greater in end-stage renal disease patients compared to healthy adults .
The clinical effectiveness of osteoporosis therapies, such as phosphate binders, calcium, vitamin D, and conventional antiresorptive drugs to prevent fractures in end-stage renal disease has not been well established . To avoid adding yet another drug to their daily intake, it would be useful to improve the bone health of these patients by nonpharmacologic means. Recent studies have suggested that whole-body vibration may have a therapeutic role to play in improving bone health, particularly for individuals who are unable to tolerate exercise . In a 1-year study of adult female sheep, a 20-minute exposure each day to 30 Hz and 0.3g (where g = Earth’s gravitational acceleration, or 9.8m/s 2 ) stimulation resulted in a 30% increase in trabecular bone mineral density (BMD) of the distal femur . In a follow-up study, finite element modeling was used to show that the anabolic response yields reduction in apparent strain magnitude in the trabeculae as well as produces a structure that is stiffer and less prone to fracture for a given load .
Get Radiology Tree app to read full this article<
Get Radiology Tree app to read full this article<
Get Radiology Tree app to read full this article<
Materials and Methods
Get Radiology Tree app to read full this article<
Randomization
Get Radiology Tree app to read full this article<
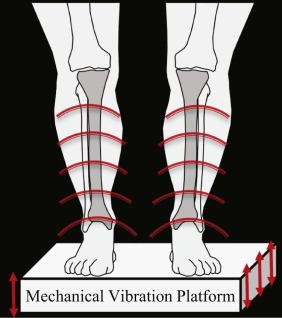
Intervention
Get Radiology Tree app to read full this article<
Get Radiology Tree app to read full this article<
Get Radiology Tree app to read full this article<
Outcome Measures
Get Radiology Tree app to read full this article<
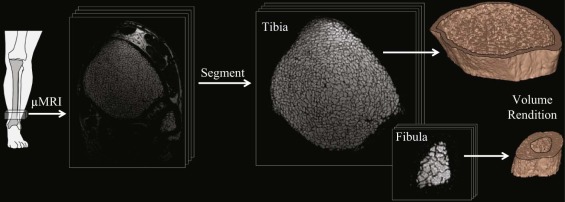
MRI Acquisition
Get Radiology Tree app to read full this article<
Get Radiology Tree app to read full this article<
MRI-based Analysis
Get Radiology Tree app to read full this article<
DXA
Get Radiology Tree app to read full this article<
pQCT
Get Radiology Tree app to read full this article<
Outcome Analyses
Get Radiology Tree app to read full this article<
Statistical Analysis
Get Radiology Tree app to read full this article<
Results
Participant Characteristics
Get Radiology Tree app to read full this article<
Table 1
Characteristics of Participants Randomized to Active or Placebo Device Use
Active
N = 14 Placebo
N = 15 Mean Age (SD), yr 50 (11) 48 (10) Sex, n (%) Male 8 (57) 9 (60) Female 6 (43) 6 (40) Mean body mass (SD), kg 72.7 (18.7) 69.7 (16.4) Mean height (SD), m 1.69 (0.092) 1.68 (0.070) Mean body-mass index (SD), kg/m 2 25.3 (5.33) 24.4 (4.36) Cause of renal disease, n (%) Hypertension 6 (43) 6 (40) Diabetes 1 (7) 1 (7) Focal segmental glomerulosclerosis 4 (29) 2 (13) Other 3 (21) 6 (40) Median dialysis duration [range], yr 2.13 [0.172–15.2] 3.52 [0.339–7.12] Median intentional exercise [range], min/day 25 [0–100] 39 [0–90] Medication intake, n Prednisone 2 2 Cinacalcet 7 3 Vitamin D sterol 15 13 Phosphate binder 14 14
SD, standard deviation.
None of the parameters were significantly different between the two groups.
Get Radiology Tree app to read full this article<
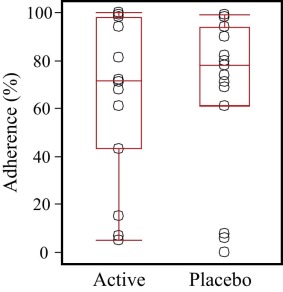
Adherence to Daily Device Use
Get Radiology Tree app to read full this article<
Get Radiology Tree app to read full this article<
Intention-to-Treat and Post Hoc Analyses
Get Radiology Tree app to read full this article<
Table 2
Percent Changes Between the Two Time Points for the Outcomes (Reported as Mean ± SD), Based on the Intention-to-Treat Data Analysis
Active % Change Placebo % Change_P_ Tibia stiffness, GPa 2.43 ± 5.15 1.61 ± 6.90 .72 Tibia trabecular BV/TV, % 0.30 ± 3.82 −1.21 ± 5.77 .42 Tibia trabecular thickness, mm −0.02 ± 1.32 0.29 ± 1.83 .70 Tibia trabecular number 0.30 ± 2.85 −1.53 ± 4.85 .23 Tibia trabecular separation, mm −0.24 ± 3.31 1.97 ± 5.59 .22 Tibia trabecular plate-to-rod ratio 3.59 ± 8.59 1.26 ± 10.2 .52 Tibia trabecular BMD, mg/cm 3 0.95 ± 2.68 −0.68 ± 3.64 .21 Tibia cortical porosity, % 2.26 ± 13.0 1.63 ± 11.8 .89 Tibia cortical BMD, mg/cm 3 −0.26 ± 1.25 −0.04 ± 0.57 .58 Hip BMD, mg/cm 2 −1.27 ± 3.48 −1.17 ± 2.48 .93 Lumbar PA spine BMD, mg/cm 2 −1.09 ± 2.25 −1.34 ± 4.21 .85 Calf muscle CSA, cm 2 −1.72 ± 3.47 −0.40 ± 6.72 .58 PTH, pg/mL 51.0 ± 134 104 ± 340 .60
BMD, bone mineral density; BV/TV, bone volume/total volume; CSA, cross-sectional area; PA, posteroanterior; PTH, parathyroid hormone; SD, standard deviation.
The P value indicates the significance of the difference in percent change in parameters between the active and placebo groups.
Table 3
Baseline, 6-Month Absolute Values, and Percent Changes Between the Two Time Points for the Outcomes (Reported as Mean ± SD), Based on the Post Hoc Longitudinal Data Analysis
Baseline 6 Months % Change_P_ Tibia stiffness, GPa Active 1.11 ± 0.09 1.17 ± 0.11 5.26 ± 4.5 .022 \* Placebo 1.20 ± 0.17 1.21 ± 0.18 0.94 ± 6.1 .49 Tibia trabecular BV/TV, % Active 8.98 ± 0.06 9.15 ± 0.60 1.87 ± 2.3 .078 Placebo 9.69 ± 1.53 9.56 ± 1.56 −1.23 ± 5.3 .30 Tibia trabecular thickness, mm Active 0.104 ± 0.004 0.104 ± 0.004 0.16 ± 1.2 .75 Placebo 0.108 ± 0.014 0.109 ± 0.012 0.12 ± 1.7 .73 Tibia trabecular number Active 0.862 ± 0.04 0.877 ± 0.05 1.70 ± 1.40 .018 \* Placebo 0.893 ± 0.095 0.880 ± 0.096 −1.39 ± 4.32 .16 Tibia trabecular separation, mm Active 1.06 ± 0.05 1.04 ± 0.06 −1.84 ± 1.55 .020 \* Placebo 1.03 ± 0.13 1.04 ± 0.14 1.76 ± 5.00 .12 Tibia trabecular plate-to-rod ratio Active 1.33 ± 0.27 1.36 ± 0.28 6.51 ± 3.8 .004 \* Placebo 1.27 ± 0.30 1.31 ± 0.31 1.06 ± 10 .64 Tibia trabecular BMD, mg/cm 3 Active 202 ± 32 207 ± 30 2.34 ± 2.3 .034 \* Placebo 216 ± 58 217 ± 49 −0.76 ± 3.3 .31 Tibia cortical porosity, % Active 39.5 ± 7.0 39.5 ± 5.6 −1.64 ± 11 .71 Placebo 37.9 ± 8.3 38.5 ± 6.3 3.07 ± 13 .27 Tibia cortical BMD, mg/cm 3 Active 1135 ± 46.2 1137 ± 43 0.13 ± 0.42 .45 Placebo 1159 ± 45.3 1150 ± 50 −0.25 ± 1.08 .33 Hip BMD, mg/cm 2 Active 1.00 ± 0.19 1.00 ± 0.19 0.14 ± 4.1 .93 Placebo 0.98 ± 0.20 0.91 ± 0.20 −1.65 ± 2.7 .0049 \* Lumbar PA Spine BMD, mg/cm 2 Active 1.06 ± 0.11 1.05 ± 0.11 −0.92 ± 2.3 .32 Placebo 1.05 ± 0.22 1.03 ± 0.23 −1.32 ± 3.7 .11 Calf muscle CSA, cm 2 Active 67.4 ± 13.0 67.1 ± 12.3 −0.34 ± 2.4 .77 Placebo 60.0 ± 13.9 60.2 ± 14.0 −1.08 ± 6.2 .44 PTH, pg/mL Active 333 ± 222 399 ± 238 34 ± 69 .24 Placebo 373 ± 316 352 ± 306 94 ± 299 .18
BMD, bone mineral density; BV/TV, bone volume/total volume; CSA, cross-sectional area; PA, posteroanterior; PTH, parathyroid hormone; SD, standard deviation.
Participants who complied more than the median adherence (70%) in the active mechanical stimulation arm were considered “active” and all other participants are grouped as “placebo.” The P value indicates the significance of the percent change in parameters between the two time points within each group.
Get Radiology Tree app to read full this article<
Table 4
Correlation Between the 6-Month Changes in Measured Parameters and Daily Device Adherence in the Active Group Using Post Hoc Analysis
Change (%) vs Adherence R_P_ Tibia stiffness 0.66 .050 \* Tibia trabecular BV/TV 0.87 .0021 \* Tibia trabecular thickness 0.80 .0095 \* Tibia trabecular number 0.75 .021 \* Tibia trabecular separation −0.77 .016 \* Tibia trabecular plate-to-rod ratio 0.75 .020 \* Tibia trabecular BMD 0.60 .11 Tibia cortical porosity −0.86 .0028 \* Tibia cortical density −0.15 .72 Hip BMD 0.14 .72 Lumbar spine BMD −0.29 .44 Calf muscle CSA 0.70 .12 PTH 0.41 .28
BMD, bone mineral density; BV/TV, bone volume/total volume; CSA, cross-sectional area; PTH, parathyroid hormone.
Get Radiology Tree app to read full this article<
Get Radiology Tree app to read full this article<
Muscle-Bone Interaction
Get Radiology Tree app to read full this article<
Table 5
Correlation Between the 6-Month Changes in Measured Parameters and Changes in Calf Muscle CSA in the Active Group Using the Post Hoc Analysis
Change (%) vs Change (%) in Calf Muscle CSA R_P_ Tibia stiffness 0.85 .033 \* Tibia trabecular BV/TV 0.91 .011 \* Tibia trabecular thickness 0.38 .46 Tibia trabecular number 0.92 .0082 \* Tibia trabecular separation −0.94 .0057 \* Tibia trabecular plate-to-rod ratio 0.70 .12 Tibia trabecular BMD 0.44 .38 Tibia cortical porosity −0.44 .38 Tibia cortical density 0.29 .57 Hip BMD 0.26 .62 Lumbar spine BMD 0.19 .72 PTH 0.31 .55
BMD, bone mineral density; BV/TV, bone volume/total volume; CSA, cross-sectional area; PTH, parathyroid hormone.
Get Radiology Tree app to read full this article<
Get Radiology Tree app to read full this article<
Effect of PTH on Cortical Bone
Get Radiology Tree app to read full this article<
Location Dependence of Mechanical Stimulation Effect
Get Radiology Tree app to read full this article<
Get Radiology Tree app to read full this article<
Discussion
Get Radiology Tree app to read full this article<
Get Radiology Tree app to read full this article<
Get Radiology Tree app to read full this article<
Get Radiology Tree app to read full this article<
Get Radiology Tree app to read full this article<
Get Radiology Tree app to read full this article<
Get Radiology Tree app to read full this article<
Get Radiology Tree app to read full this article<
Get Radiology Tree app to read full this article<
Get Radiology Tree app to read full this article<
Get Radiology Tree app to read full this article<
Get Radiology Tree app to read full this article<
Get Radiology Tree app to read full this article<
Get Radiology Tree app to read full this article<
Get Radiology Tree app to read full this article<
Get Radiology Tree app to read full this article<
Acknowledgments
Get Radiology Tree app to read full this article<
References
1. Kazama J.J., Matsuo K., Iwasaki Y., et. al.: Chronic kidney disease and bone metabolism. J Bone Miner Metab 2015; 33: pp. 245-252.
2. Wesseling-Perry K., Juppner H.: The osteocyte in CKD: new concepts regarding the role of FGF23 in mineral metabolism and systemic complications. Bone 2013; 54: pp. 222-229.
3. Ball A.M., Gillen D.L., Sherrard D., et. al.: Risk of hip fracture among dialysis and renal transplant recipients. JAMA 2002; 288: pp. 3014-3018.
4. Coco M., Rush H.: Increased incidence of hip fractures in dialysis patients with low serum parathyroid hormone. Am J Kidney Dis 2000; 36: pp. 1115-1121.
5. Mittalhenkle A., Gillen D.L., Stehman-Breen C.O.: Increased risk of mortality associated with hip fracture in the dialysis population. Am J Kidney Dis 2004; 44: pp. 672-679.
6. Lau E., Al-Dujaili S., Guenther A., et. al.: Effect of low-magnitude, high-frequency vibration on osteocytes in the regulation of osteoclasts. Bone 2010; 46: pp. 1508-1515.
7. Jankovich J.P.: The effects of mechanical vibration on bone development in the rat. J Biomech 1972; 5: pp. 241-250.
8. Judex S., Boyd S., Qin Y.X., et. al.: Adaptations of trabecular bone to low magnitude vibrations result in more uniform stress and strain under load. Ann Biomed Eng 2003; 31: pp. 12-20.
9. Judex S., Donahue L.R., Rubin C.: Genetic predisposition to low bone mass is paralleled by an enhanced sensitivity to signals anabolic to the skeleton. FASEB J 2002; 16: pp. 1280-1282.
10. Rubin C., Xu G., Judex S.: The anabolic activity of bone tissue, suppressed by disuse, is normalized by brief exposure to extremely low-magnitude mechanical stimuli. FASEB J 2001; 15: pp. 2225-2229.
11. Tezval M., Biblis M., Sehmisch S., et. al.: Improvement of femoral bone quality after low-magnitude, high-frequency mechanical stimulation in the ovariectomized rat as an osteopenia model. Calcif Tissue Int 2011; 88: pp. 33-40.
12. Xie L., Jacobson J.M., Choi E.S., et. al.: Low-level mechanical vibrations can influence bone resorption and bone formation in the growing skeleton. Bone 2006; 39: pp. 1059-1066.
13. Beck B.R.: Vibration therapy to prevent bone loss and falls: mechanisms and efficacy. Curr Osteoporos Rep 2015; 13: pp. 381-389.
14. Rubin C., Turner A.S., Bain S., et. al.: Anabolism. Low mechanical signals strengthen long bones. Nature 2001; 412: pp. 603-604.
15. Gilsanz V., Wren T.A., Sanchez M., et. al.: Low-level, high-frequency mechanical signals enhance musculoskeletal development of young women with low BMD. J Bone Miner Res 2006; 21: pp. 1464-1474.
16. Rubin C., Recker R., Cullen D., et. al.: Prevention of postmenopausal bone loss by a low-magnitude, high-frequency mechanical stimuli: a clinical trial assessing compliance, efficacy, and safety. J Bone Miner Res 2004; 19: pp. 343-351.
17. Verschueren S.M., Roelants M., Delecluse C., et. al.: Effect of 6-month whole body vibration training on hip density, muscle strength, and postural control in postmenopausal women: a randomized controlled pilot study. J Bone Miner Res 2004; 19: pp. 352-359.
18. Ward K., Alsop C., Caulton J., et. al.: Low magnitude mechanical loading is osteogenic in children with disabling conditions. J Bone Miner Res 2004; 19: pp. 360-369.
19. Leonard M.B., Shults J., Long J., et. al.: Effect of low-magnitude mechanical stimuli on bone density and structure in pediatric Crohn’s disease: a randomized placebo-controlled trial. J Bone Miner Res 2016; 31: pp. 1177-1188.
20. Ness K.: The effects of low magnitude high frequency mechanical stimulation (LMS) on bone density in childhood cancer survivors (CCS). APTA Combined Sections Meeting; Indianapolis2015.
21. Kiel D.P., Hannan M.T., Barton B.A., et. al.: Low-magnitude mechanical stimulation to improve bone density in persons of advanced age: a randomized, placebo-controlled trial. J Bone Miner Res 2015; 30: pp. 1319-1328.
22. Judex S., Rubin C.T.: Is bone formation induced by high-frequency mechanical signals modulated by muscle activity?. J Musculoskelet Neuronal Interact 2010; 10: pp. 3-11.
23. Fritton S.P., McLeod K.J., Rubin C.T.: Quantifying the strain history of bone: spatial uniformity and self-similarity of low-magnitude strains. J Biomech 2000; 33: pp. 317-325.
24. Griffin M.J.: Predicting the hazards of whole-body vibration—considerations of a standard. Ind Health 1998; 36: pp. 83-91.
25. Ozcivici E., Luu Y.K., Adler B., et. al.: Mechanical signals as anabolic agents in bone. Nat Rev Rheumatol 2010; 6: pp. 50-59.
26. Cheung J.T.M., Zhang M., Chow D.H.K.: Biomechanical responses of the intervertebral joints to static and vibrational loading: a finite element study. Clin Biomech (Bristol, Avon) 2003; 18: pp. 790-799.
27. Stewart J.M., Karman C., Montgomery L.D., et. al.: Plantar vibration improves leg fluid flow in perimenopausal women. Am J Physiol Regul Integr Comp Physiol 2005; 288: pp. R623-R629.
28. Uzer G., Pongkitwitoon S., Ian C., et. al.: Gap junctional communication in osteocytes is amplified by low intensity vibrations in vitro. PLoS ONE 2014; 9: e90840
29. Uzer G., Thompson W.R., Sen B., et. al.: Cell mechanosensitivity to extremely low-magnitude signals is enabled by a LINCed nucleus. Stem Cells 2015; 33: pp. 2063-2076.
30. Fritton J.C., Rubin C.T., Qin Y.X., et. al.: Whole-body vibration in the skeleton: development of a resonance-based testing device. Ann Biomed Eng 1997; 25: pp. 831-839.
31. Magland J.F., Wald M.J., Wehrli F.W.: Spin-echo micro-MRI of trabecular bone using improved 3D fast large-angle spin-echo (FLASE). Magn Reson Med 2009; 61: pp. 1114-1121.
32. Magland J.F., Jones C.E., Leonard M.B., et. al.: Retrospective 3D registration of trabecular bone MR images for longitudinal studies. J Magn Reson Imaging 2009; 29: pp. 118-126.
33. Rajapakse C.S., Magland J.F., Wald M.J., et. al.: Computational biomechanics of the distal tibia from high-resolution MR and micro-CT images. Bone 2010; 47: pp. 556-563.
34. Saha P.K., Wehrli F.W.: Measurement of trabecular bone thickness in the limited resolution regime of in vivo MRI by fuzzy distance transform. IEEE Trans Med Imaging 2004; 23: pp. 53-62.
35. Rüegsegger P.: Imaging of bone structure.Cowin S.C.Bone mechanics handbook.2001.CRC Press
36. Vasilic B., Rajapakse C.S., Wehrli F.W.: Classification of trabeculae into three-dimensional rodlike and platelike structures via local inertial anisotropy. Med Phys 2009; 36: pp. 3280-3291.
37. Magland J.F., Zhang N., Rajapakse C.S., et. al.: Computationally-optimized bone mechanical modeling from high-resolution structural images. PLoS ONE 2012; 7: e35525
38. Lam S.C., Wald M.J., Rajapakse C.S., et. al.: Performance of the MRI-based virtual bone biopsy in the distal radius: serial reproducibility and reliability of structural and mechanical parameters in women representative of osteoporosis study populations. Bone 2011; 49: pp. 895-903.
39. Bhagat Y.A., Rajapakse C.S., Magland J.F., et. al.: Performance of muMRI-based virtual bone biopsy for structural and mechanical analysis at the distal tibia at 7T field strength. J Magn Reson Imaging 2011; 33: pp. 372-381.
40. Wald M.J., Magland J.F., Rajapakse C.S., et. al.: Structural and mechanical parameters of trabecular bone estimated from in vivo high-resolution magnetic resonance images at 3 tesla field strength. J Magn Reson Imaging 2010; 31: pp. 1157-1168.
41. Shepherd J.A., Wang L., Fan B., et. al.: Optimal monitoring time interval between DXA measures in children. J Bone Miner Res 2011; 26: pp. 2745-2752.
42. Baker J.F., Davis M., Alexander R., et. al.: Associations between body composition and bone density and structure in men and women across the adult age spectrum. Bone 2013; 53: pp. 34-41.
43. Adams J.E.E.K., Zemel B.S., Ward K.A.: Quantitative computer tomography in children and adolescents: the 2013 ISCD pediatric official positions. J Clin Densitom 2014; 17: pp. 258-274.
44. Goh J.C., Mech A.M., Lee E.H., et. al.: Biomechanical study on the load-bearing characteristics of the fibula and the effects of fibular resection. Clin Orthop Relat Res 1992; 279: pp. 223-228.
45. Sen B., Xie Z., Case N., et. al.: Mechanical signal influence on mesenchymal stem cell fate is enhanced by incorporation of refractory periods into the loading regimen. J Biomech 2011; 44: pp. 593-599.
46. Afzal S.Y., Wender A.R., Jones M.D., et. al.: The effect of low magnitude mechanical stimulation (LMMS) on bone density in patients with Rett syndrome: a pilot and feasibility study. J Pediatr Rehabil Med 2014; 7: pp. 167-178.
47. Mogil R.J., Kaste S.C., Ferry R.J., et. al.: Effect of low-magnitude, high-frequency mechanical stimulation on BMD among young childhood cancer survivors: a randomized clinical trial. JAMA Oncol 2016; 2: pp. 908-914.
48. Dutra M.C., de Oliveira M.L., Marin R.V., et. al.: Whole-body vibration improves neuromuscular parameters and functional capacity in osteopenic postmenopausal women. Menopause 2016; 23: pp. 870-875.
49. Hannan M.T., Cheng D.M., Green E., et. al.: Establishing the compliance in elderly women for use of a low level mechanical stress device in a clinical osteoporosis study. Osteoporos Int 2004; 15: pp. 918-926.
50. Clowes J.A., Peel N.F., Eastell R.: The impact of monitoring on adherence and persistence with antiresorptive treatment for postmenopausal osteoporosis: a randomized controlled trial. J Clin Endocrinol Metab 2004; 89: pp. 1117-1123.
51. Adler R.A.F.G., Bauer D.C., Camacho P.M., et. al.: Managing osteoporosis in patients on long-term bisphosphonate treatment: report of a Task Force of the American Society for Bone and Mineral Research. J Bone Miner Res 2016; 31: pp. 16-35.
52. Organizatoin IS : Vibration and shock with respect to human beings. 13 Environment Health Protection Safety2014.
53. Kiiski J., Heinonen A., Jarvinen T.L., et. al.: Transmission of vertical whole body vibration to the human body. J Bone Miner Res 2008; 23: pp. 1318-1325.
54. Muir J., Kiel D.P., Rubin C.T.: Safety and severity of accelerations delivered from whole body vibration exercise devices to standing adults. J Sci Med Sport 2013; 16: pp. 526-531.
55. Parfitt A.M.: The actions of parathyroid hormone on bone: relation to bone remodeling and turnover, calcium homeostasis, and metabolic bone disease. Part IV of IV parts: the state of the bones in uremic hyperaparathyroidism—the mechanisms of skeletal resistance to PTH in renal failure and pseudohypoparathyroidism and the role of PTH in osteoporosis, osteopetrosis, and osteofluorosis. Metab Clin Exp 1976; 25: pp. 1157-1188.
56. Nishiyama K.K., Pauchard Y., Nikkel L.E., et. al.: Longitudinal HR-pQCT and image registration detects endocortical bone loss in kidney transplantation patients. J Bone Miner Res 2014; 30: pp. 554-561.
57. Bouassida A., Latiri I., Bouassida S., et. al.: Parathyroid hormone and physical exercise: a brief review. J Sports Sci Med 2006; 5: pp. 367-374.
58. Slatkovska L., Alibhai S.M., Beyene J., et. al.: Effect of 12 months of whole-body vibration therapy on bone density and structure in postmenopausal women: a randomized trial. Ann Intern Med 2011; 155: pp. 668-679. W205
59. Dudley-Javoroski S., Petrie M.A., McHenry C.L., et. al.: Bone architecture adaptations after spinal cord injury: impact of long-term vibration of a constrained lower limb. Osteoporos Int 2016; 27: pp. 1149-1160.
60. Rajapakse C.S., Leonard M.B., Bhagat Y.A., et. al.: Micro-MR imaging-based computational biomechanics demonstrates reduction in cortical and trabecular bone strength after renal transplantation. Radiology 2012; 262: pp. 912-920.
61. Liu X.S., Zhang X.H., Rajapakse C.S., et. al.: Accuracy of high-resolution in vivo micro magnetic resonance imaging for measurements of microstructural and mechanical properties of human distal tibial bone. J Bone Miner Res 2010; 25: pp. 2039-2050.