
Rationale and Objectives
Heterogeneity of skeletal muscle structure, composition, and perfusion results in spatial differences in oxidative function between muscles and muscle regions. The simultaneous measurement of the postexercise phosphocreatine (PCr) recovery rate across all muscles of a human limb cross-section may provide new insights into normal physiology and disease states. The objective of this work was to assess the feasibility of acquiring PCr rapid acquisition with relaxation enhancement (RARE) images with sufficient temporal and spatial resolution to accurately measure PCr recovery kinetics in a cross-section of a human limb.
Materials and Methods
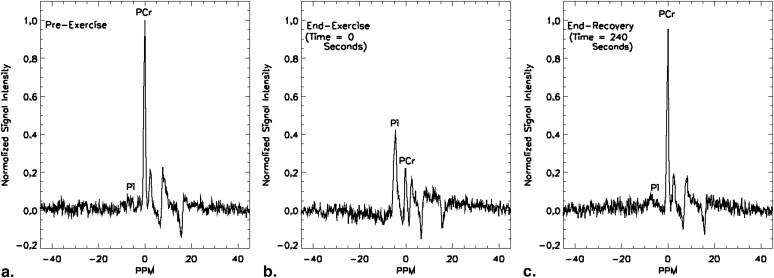
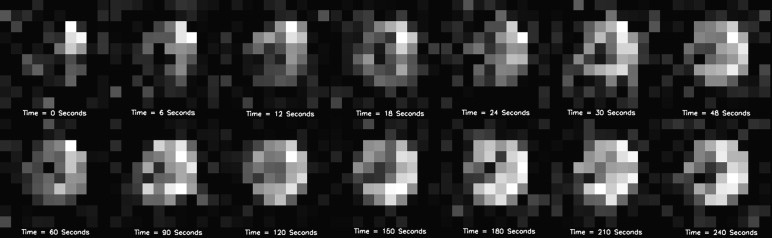
One normal subject performed a finger exercise until fatigued. At cessation of exercise surface coil localized pulse-and-acquire phosphorus-31 MR spectra ( 31 P- magnetic resonance spectroscopy [MRS]) of the forearm were acquired at 6 S intervals for 4 minutes. The exercise protocol was repeated 7 days later and axial PCr RARE images of the forearm were acquired following exercise with 5.6 cm 3 voxels at 6-second intervals for 4 minutes.
Results
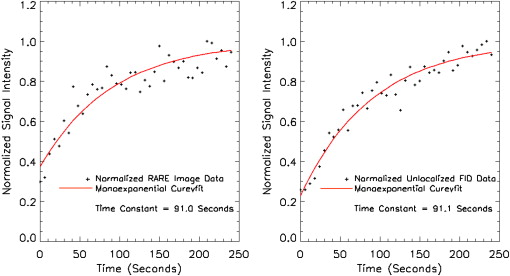
The PCr recovery time constants for the PCr RARE and 31 P-MRS measurements were 91.0 and 91.1 seconds, respectively, based on a monoexponential fit. A Pearson correlation test showed that the PCr recovery data that resulted from the RARE PCr imaging were highly correlated with the data resulting from the 31 P-MRS ( r = 0.91, P < .0001).
Discussion
Data from selected regions of RARE PCr images acquired at 6-second intervals compare well to those acquired using surface coil 31 P MR spectroscopy and can provide an accurate assessment of PCr recovery kinetics.
Substantial variation in the biochemical properties, vascular supplies, and composition (eg, fiber type) among human skeletal muscles has been well-documented . These characteristics influence the mitochondrial capacity to varying degrees in different muscles in normal and athletically trained individuals . Further changes in these characteristics occur because of normal aging and some disease states, which may result in a heterogeneous pattern of altered metabolic function .
The rate of resynthesis of phosphocreatine (PCr) in skeletal muscle following exercise is an index of the capacity of the mitochondria to carry out oxidative metabolism . Phosphorus-31 magnetic resonance spectroscopy ( 31 P-MRS) with surface coil localization is an accepted method for measuring the postexercise recovery rate of skeletal muscle PCr and can provide insights into normal physiology and pathophysiology in disease states . A limitation of surface coil 31 P-MRS is that it does not provide precise spatial information and is limited to superficial muscle regions. It is also uncertain whether the acquired signal is from only a single muscle or from multiple muscles with different characteristics within the sensitive region of the surface coil . Current 31 P-MRS localization methods require times that are too long for the precise assessment of postexercise PCr recovery kinetics .
Get Radiology Tree app to read full this article<
Get Radiology Tree app to read full this article<
Get Radiology Tree app to read full this article<
Get Radiology Tree app to read full this article<
Materials and methods
Study Subject
Get Radiology Tree app to read full this article<
Exercise Protocol
Get Radiology Tree app to read full this article<
MRS
Get Radiology Tree app to read full this article<
Get Radiology Tree app to read full this article<
Mapping the region of sensitivity of the 31 P surface coil
Get Radiology Tree app to read full this article<
MR Imaging
Get Radiology Tree app to read full this article<
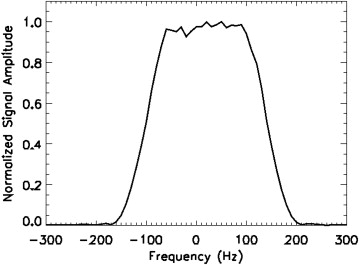
Measurement of RF excitation pulse width
Get Radiology Tree app to read full this article<
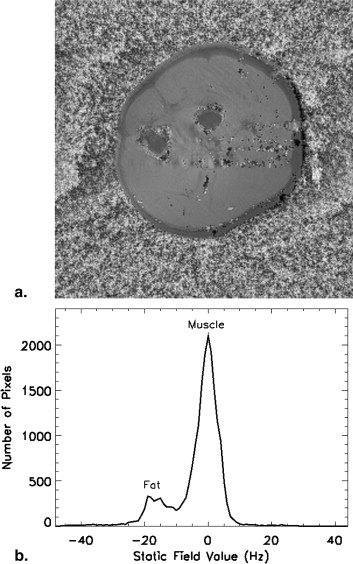
Mapping of the static field
Get Radiology Tree app to read full this article<
Proton imaging
Get Radiology Tree app to read full this article<
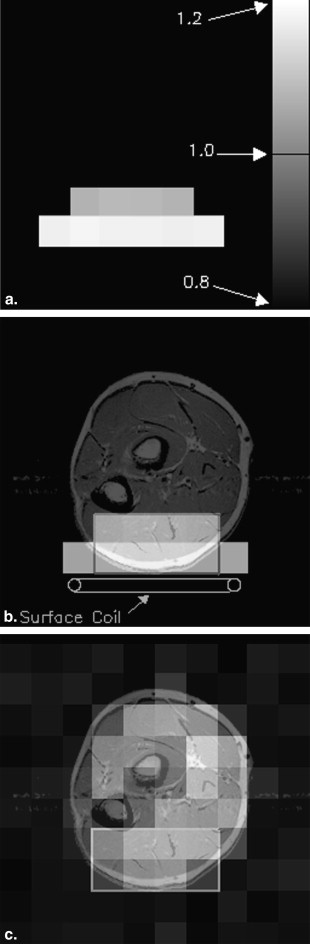
PCr imaging
Get Radiology Tree app to read full this article<
Data Analysis
Spectroscopy
Get Radiology Tree app to read full this article<
Imaging
Get Radiology Tree app to read full this article<
Calculation of recovery time constants
Get Radiology Tree app to read full this article<
Get Radiology Tree app to read full this article<
SNR measurements
Get Radiology Tree app to read full this article<
Results
Get Radiology Tree app to read full this article<
Get Radiology Tree app to read full this article<
Get Radiology Tree app to read full this article<
Get Radiology Tree app to read full this article<
Get Radiology Tree app to read full this article<
Get Radiology Tree app to read full this article<
Get Radiology Tree app to read full this article<
Get Radiology Tree app to read full this article<
Get Radiology Tree app to read full this article<
Get Radiology Tree app to read full this article<
Get Radiology Tree app to read full this article<
Get Radiology Tree app to read full this article<
Discussion
Get Radiology Tree app to read full this article<
Get Radiology Tree app to read full this article<
Get Radiology Tree app to read full this article<
Get Radiology Tree app to read full this article<
Get Radiology Tree app to read full this article<
Get Radiology Tree app to read full this article<
Get Radiology Tree app to read full this article<
Get Radiology Tree app to read full this article<
Get Radiology Tree app to read full this article<
References
1. Johnson M.A., Polgar J., Weightman D., et. al.: Data on the distribution of fibre types in thirty-six human muscles. An autopsy study. J Neurol Sci 1973; 18: pp. 111-129.
2. Martin P., Gibson H., Edwards R.: MRS of muscle.Young I.A.Charles H.C.MR Spectroscopy - Clinical Applications and Techniques.1996.Martin Dunitz, Ltdpp. 55-73.
3. Kalliokoski K.K., Kemppainen J., Larmola K., et. al.: Muscle blood flow and flow heterogeneity during exercise studied with positron emission tomography in humans. Eur J Appl Physiol 2000; 83: pp. 395-401.
4. Askew C.D., Green S., Walker P.J., et. al.: Skeletal muscle phenotype is associated with exercise tolerance in patients with peripheral arterial disease. J Vasc Surg 2005; 41: pp. 802-807.
5. Oberbach A., Bossenz Y., Lehmann S., et. al.: Altered fiber distribution and fiber-specific glycolytic and oxidative enzyme activity in skeletal muscle of patients with type 2 diabetes. Diabetes Care 2006; 29: pp. 895-900.
6. Mancini D.M., Coyle E., Coggan A., et. al.: Contribution of intrinsic skeletal muscle changes to 31P NMR skeletal muscle metabolic abnormalities in patients with chronic heart failure. Circulation 1989; 80: pp. 1338-1346.
7. Lanza I.R., Larsen R.G., Kent-Braun J.A.: Effects of old age on human skeletal muscle energetics during fatiguing contractions with and without blood flow. J Physiol 2007; 583: pp. 1093-1105.
8. Arnold D.L., Matthews P.M., Radda G.K.: Metabolic recovery after exercise and the assessment of mitochondrial function in vivo in human skeletal muscle by means of 31P NMR. Magn Reson Med 1984; 1: pp. 307-315.
9. Isbell D.C., Berr S.S., Toledano A.Y., et. al.: Delayed calf muscle phosphocreatine recovery after exercise identifies peripheral arterial disease. J Am Coll Cardiol 2006; 47: pp. 2289-2295.
10. Hands L., Bore P., Galloway G., et. al.: Muscle metabolism in patients with peripheral vascular disease investigated by 31P nuclear magnetic resonance spectroscopy. Clin Sci 1986; 71: pp. 283-290.
11. Suzuki E., Kashiwag A., Hidaka H., et. al.: 1H and 31P-magnetic resonance spectroscopy and imaging as a new diagnostic tool to evaluate neuropathic foot ulcers in type II diabetes. Diabetologia 2000; 43: pp. 165-172.
12. Brown T.R., Kincaid B.M., Ugurbil K.: NMR chemical shift imaging in three dimensions. Proc Natl Acad Sci 1982; 79: pp. 3523-3526.
13. Forbes S.C., Slade J.M., Francis R.M., et. al.: Comparison of oxidative capacity among leg muscles in humans using gated 31P 2-D chemical shift imaging. NMR Biomed 2009; 22: pp. 1063-1071.
14. Slade J.M., Towse T.F., Delano M.C., et. al.: A gated 31P NMR method for the estimation of phosphocreatine recovery time and contractile ATP cost in human muscle. NMR Biomed 2006; 19: pp. 573-580.
15. Chao H., Bowers J.L., Holtzman D., et. al.: Fast PCr Imaging of Forearm Muscles Pre- and Post-Exercise. Proc., ISMRM, 5th Annual Meeting 1997; pp. 1323.
16. Greenman R.L.: Quantification of the 31P metabolite concentration in human skeletal muscle from RARE signal intensity. Magn Reson Med 2004; 52: pp. 1036-1042.
17. Greenman R.L., Rakow-Penner R.: Evaluation of the RF field uniformity of a double-tuned 31P/1H birdcage RF coil for spin-echo MRI/MRS of the diabetic foot. J Magn Reson Imaging 2005; 22: pp. 427-432.
18. Insko E., Bolinger L.: Mapping of the radio frequency field. J Magn Reson 1993; 103: pp. 82-85.
19. Freeman R.: Selective excitation in high-resolution NMR. Chem Rev 1991; 91: pp. 1397-1412.
20. Maril N., Collins C.M., Greenman R.L., et. al.: Strategies for shimming the breast. Magn Reson Med 2005; 54: pp. 1139-1145.
21. Schenck J., Hart H., Foster T., et. al.: High resolution magnetic resonance imaging using surface coils.Kressel H.Magnetic Resonance Annu.1986.Raven PressNew York:pp. 123-160.
22. Argov Z., Lofberg M., Arnold D.L.: Insights into muscle diseases gained by phosphorus magnetic resonance spectroscopy. Muscle Nerve 2000; 23: pp. 1316-1334.
23. Arsac L.M., Thiaudiere E., Diolez P., et. al.: Parameter estimation in modeling phosphocreatine recovery in human skeletal muscle. Eur J Appl Physiol 2004; 91: pp. 419-424.
24. Greenman R.L., Panasyuk S., Wang X., et. al.: Early changes in the skin microcirculation and muscle metabolism of the diabetic foot. Lancet 2005; 366: pp. 1711-1717.