
Rationale and Objectives
The h index is a recently developed tool to assess the impact of an author’s publications. The purpose of this study was to apply and evaluate the h indexes of US academic radiologists.
Materials and Methods
Radiology programs that participated in the residency match in 2009 were identified through the National Resident Matching Program’s Web site. One third of programs were randomly selected. The academic ranks (instructor, assistant professor, associate professor, professor, or chairperson) of faculty members were determined on the basis of information from the programs’ Web sites during October and November 2009. One third of radiologists at each randomly selected institution were randomly selected for detailed analysis. For each radiologist, an automatically computed h index was obtained through the Scopus database. The h index was compared across ranks using analysis of variance. A multivariate logistic regression analysis was also performed to determine the best predictors (number of publications, number of citations, h index, and number of citations per publication) of academic rank.
Results
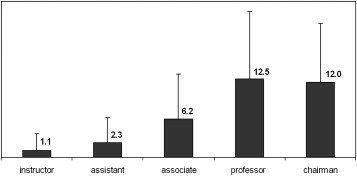
Sixty hundred eighty-three radiologists from 47 programs were included in this study. The mean h indexes were 1.1 ± 2.7 for instructors, 2.3 ± 4.1 for assistant professors, 6.2 ± 7.2 for associate professors, 12.5 ± 10.8 for full professors, and 12.0 ± 9.5 for chairpersons. There was a significant relationship between h index and academic rank ( P < .0001). Multivariate logistic regression analysis demonstrated that h index ( P < .0001) and number of publications ( P < .0001) were the best predictors of academic rank.
Conclusion
There exists a significant relationship between h index and academic rank, with h index increasing with academic rank. These results offer a benchmark for comparing a given academic radiologist to national averages.
Excellence in teaching, patient care, service, and research are important factors in assessing academic faculty members. In assessing excellence in research, publications, research grants, and resident and fellow mentorship are important factors in the assessment of physicians who work in an academic research setting. Perhaps the most important of these factors is the number of publications an academic physician produces. However, simply counting the number of publications a faculty member produces may not be an accurate means of assessing his or her performance as a researcher or impact on his or her research field. A number of calculated indexes have been proposed as a means of assessing a researcher’s impact. These include the h index, m quotient, g index, m index, r index, and a index . Although there is debate regarding the accuracy of each of these indexes, it seems as though the new h index is now increasingly in use .
The h index was created in 2005 by Hirsch and has been applied to a number of scientific and medical fields. It is an appropriate tool to evaluate the combination of quantity and clinical significance of papers, because it depends largely on peers’ citations of publications. Hirsch proposed “the index h , defined as the number of papers with citation number ≥ h .” For example, to calculate the h index for an investigator with 10 total papers, one first ranks from highest to lowest the number of citations for each paper. If that list shows that five papers have been cited ≥5 times, that investigator’s h index is 5. The availability of the h index in Scopus, the Institute for Scientific Information’s Web of Knowledge, and Google Scholar facilitates its widespread use.
Get Radiology Tree app to read full this article<
Methods
Selection of Programs and Radiologists
Get Radiology Tree app to read full this article<
The h Index
Get Radiology Tree app to read full this article<
Comparison of the Top 25 National Institutes of Health (NIH)–funded Radiology Research Programs to Non–Top 25 NIH-funded Radiology Research Programs
Get Radiology Tree app to read full this article<
Statistical Analysis
Get Radiology Tree app to read full this article<
Results
Program and Faculty Member Selection
Get Radiology Tree app to read full this article<
Comparison of h Index Among Groups
Get Radiology Tree app to read full this article<
Get Radiology Tree app to read full this article<
Comparison of Number of Papers, Number of Citations, and Number of Citations per Paper Among Academic Ranks
Get Radiology Tree app to read full this article<
Table 1
Numbers of Publications and Citations for Various Ranks
Instructor Assistant Professor Associate Professor Professor Chairman Variable ( n = 31) ( n = 289) ( n = 153) ( n = 163) ( n = 47)P ∗ Number of publications 15 ± 25.8 18.4 ± 23.0 36 ± 35 105 ± 83 92 ± 67 <.0001 Total citations to publications 125 ± 286 209 ± 351 542 ± 654 1443 ± 1435 1359 ± 1293 <.0001 Citations per document 7.7 ± 5.9 11.9 ± 15.4 13.3 ± 8.7 13.1 ± 7.4 14.3 ± 7.9 .081
Data are expressed as mean ± SD.
Get Radiology Tree app to read full this article<
Get Radiology Tree app to read full this article<
Comparison of Top 25 NIH-funded Programs to Non–Top 25 NIH-funded Programs
Get Radiology Tree app to read full this article<
Table 2
Comparison of Top 25 NIH-funded Programs to Non–Top 25 NIH-funded Programs
Top 25 NIH-funded Programs Non–Top 25 NIH-funded Programs Variable ( n = 11) ( n = 36)P Instructors_n_ ( n per center) 18 (1.6) 18 (2.0)h index 0.6 ± 3.6 1.5 ± 1.3 .33 Have publications 5/18 (28%) 6/18 (33%) .72 Number of publications 9.6 ± 11.6 19.2 ± 34.2 .54 Citations per document 5.7 ± 5.1 9.3 ± 6.4 .33 Assistant professors_n_ ( n per center) 107 (9.7) 182 (5.1)h index 2.8 ± 4.0 2.0 ± 4.1 .12 Have publications 53/107 (50%) 78/182 (43%) .19 Number of publications 21 ± 20.2 16.7 ± 24.8 .27 Citations per document 12.5 ± 21.8 11.4 ± 8.8 .74 Associate professors_n_ ( n per center) 66 (6.0) 87 (2.4)h index 8.2 ± 8.4 4.7 ± 5.9 .004 Have publications 52/66 (79%) 55/87 (63%) .03 Number of publications 41.8 ± 32.4 30.8 ± 36.2 .10 Citations per document 15.0 ± 9.2 11.7 ± 7.9 .04 Professors_n_ ( n per center) 88 (8.0) 75 (2.1)h index 16.2 ± 11.3 8.2 ± 8.4 <.0001 Have publications 85 (97%) 69 (92%) .19 Number of publications 130 ± 91 74 ± 60 <.0001 Citations per document 14.9 ± 6.8 11.0 ± 7.6 .001 Chairpersons_n_ ( n per center) 11 (1) 36 (1)h index 18.4 ± 9.8 10.0 ± 8.6 .02 Have publications 11 (100%) 33 (92%) .20 Number of publications 133 ± 60 78 ± 64 .02 Citations per document 18 ± 7.7 13 ± 7.7 .13
NIH, National Institutes of Health.
Data are expressed as number (percentage) or as mean ± SD.
Get Radiology Tree app to read full this article<
Multivariate Logistic Regression Analysis
Get Radiology Tree app to read full this article<
Discussion
Get Radiology Tree app to read full this article<
Get Radiology Tree app to read full this article<
Get Radiology Tree app to read full this article<
Get Radiology Tree app to read full this article<
Get Radiology Tree app to read full this article<
Get Radiology Tree app to read full this article<
Limitations
Get Radiology Tree app to read full this article<
Get Radiology Tree app to read full this article<
Get Radiology Tree app to read full this article<
Conclusion
Get Radiology Tree app to read full this article<
References
1. Thompson D.F., Callen E.C., Nahata M.C.: New indices in scholarship assessment. Am J Pharm Educ 2009; 73: pp. 111.
2. Hirsch J.E.: An index to quantify an individual’s scientific research output. Proc Natl Acad Sci U S A 2005; 102: pp. 16569-16572.
3. Maguire M.A., Gore J.C.: The current state of NIH funding of research in diagnostic radiology at U.S. medical schools. J Am Coll Radiol 2005; 2: pp. 436-443.
4. Vitzthum K., Mache S., Quarcoo D., et. al.: Scoliosis: density-equalizing mapping and scientometric analysis. Scoliosis 2009; 4: pp. 15.
5. Fuller C.D., Choi M., Thomas C.R.: Bibliometric analysis of radiation oncology departmental scholarly publication productivity at domestic residency training institutions. J Am Coll Radiol 2009; 6: pp. 112-118.
6. Benway B.M., Kalidas P., Cabello J.M., et. al.: Does citation analysis reveal association between h-index and academic rank in urology?. Urology 2009; 74: pp. 30-33.
7. Lee J., Kraus K.L., Couldwell W.T.: Use of the h index in neurosurgery. Clinical article. J Neurosurg 2009; 111: pp. 387-392.
8. Garcia-Perez M.A.: The Hirsch h index in a non-mainstream area: methodology of the behavioral sciences in Spain. Span J Psychol 2009; 12: pp. 833-849.
9. Hirsch J.E.: Does the h index have predictive power?. Proc Natl Acad Sci U S A 2007; 104: 19193–19198
10. Gisbert J.P., Panes J.: The Hirsch’s h-index: a new tool for measuring scientific production [article in Spanish]. Cir Esp 2009; 86: pp. 193-195.
11. Sypsa V., Hatzakis A.: Assessing the impact of biomedical research in academic institutions of disparate sizes. BMC Med Res Methodol 2009; 9: pp. 33.
12. Castillo M. Measuring academic output: the h-index. AJNR Am J Neuroradiol. In press.