
Rationale and Objectives
Higher patient exposure levels have been reported for 64-row multidetector computed tomography (MDCT) compared to 16-row MDCT. The objective of this study was to make a thorough comparison by evaluating the impact of scan length on the exposure levels at 16-row MDCT and 64-row MDCT.
Materials and Methods
Dose-length product (DLP) values were determined to compare exposure levels in 16- and 64-row MDCT. This phantom study does not deal with a possible reduction in image quality induced by an increase in scattered radiation in 64-row MDCT compared to 16-row MDCT.
Results
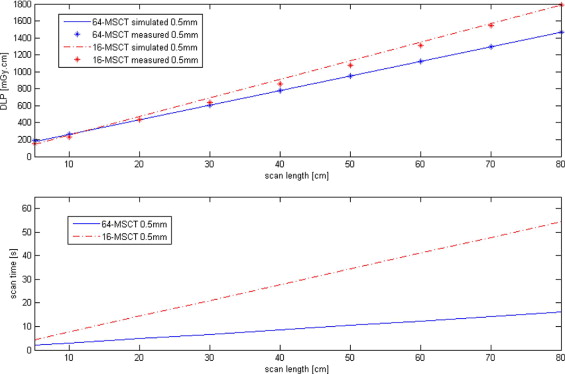
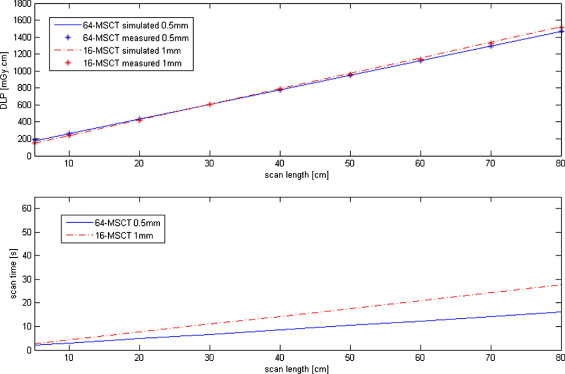
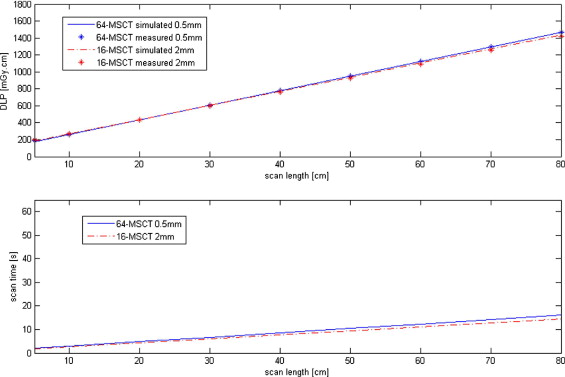
The exposure levels of 64-row MDCT (scan slice thickness, 0.5 mm) are up to 18% lower than those of 16-row MDCT at slice thickness 0.5 mm when scanning an object larger than 12.3 cm. At this value, the plots of the 16- and 64-row DLP values versus scan length cross. The DLP curves of 1- and 2-mm slice thickness 16-row MDCT are in closer resemblance to those of 0.5-mm 64-row MDCT. The respective exposure levels of 1- and 2-mm slice thickness 16-row MDCT exceed those of 0.5-mm 64-row MDCT by up to 4% and 3%, with intersections of 30 and 25 cm, respectively.
Conclusion
Lower effective doses are obtained in 64-row MDCT compared to 16-row MDCT (0.5-mm slice thickness) provided that scan length exceeds 12.3, 30, and 25 cm, for 16-row MDCT slice thickness of 0.5, 1, and 2 mm, respectively. Reduced effective dosage in 64-row MDCT compared to 16-row MDCT has not been demonstrated before. Differences in object size may thus explain discrepancies between previous studies with regard to the exposure levels at 64-slice CT compared to 16-slice CT.
Multidetector computed tomography (MDCT) has become increasingly important as a noninvasive imaging modality since its introduction in 1998 ( ). Research on patient dosage, a major concern in MDCT examinations, has been ongoing for many years ( ). In young patients in particular, special attention to this matter is required. An accurate analysis of patient dose in MDCT as a function of beam width, often referred to as collimation, is nevertheless still lacking.
The CT dose index (CTDI) value is frequently used as reference for dose exposed under clinical conditions. CTDI can be measured inside a defined phantom (CTDI weighted ) in air (CTDI air ) or in other ways. As CTDI measurements inside a phantom are linearly related to those in air, an analysis of exposure ratios can be done using CTDI air . Furthermore, CTDI represents the output of tube/filter combination under specified conditions. Exposure to the patient, specified as dose-length product (DLP), is used as measure of exposure in the scan procedure ( ).
Get Radiology Tree app to read full this article<
Get Radiology Tree app to read full this article<
Materials and methods
System Parameters
Get Radiology Tree app to read full this article<
Effective Exposure Analyses
Get Radiology Tree app to read full this article<
CDTIair=1NT∫−50mm50mmd(z)dz[mGy] C
D
T
I
a
i
r
=
1
N
T
∫
−
50
m
m
50
m
m
d
(
z
)
d
z
[
m
G
y
]
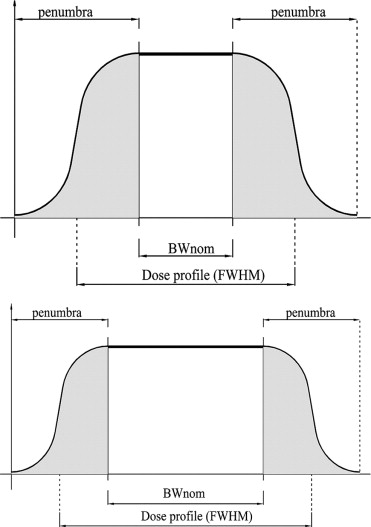
where N s the number of slices, T (mm) is the nominal slice thickness, d(z) is the dose profile for an axial scan, and the integral is taken over the interval of 100-mm scan length. Figure 1 demonstrates that the dose profile varies with the beam width, resulting in different CTDI values. Because the absolute width of the penumbra (hatched areas) and thus additional radiation exposure, due to the penumbra is almost independent of the nominal beam width, the contribution of the penumbra will have the greatest relative effect on both image quality and patient exposure if the nominal band width is small ( Fig. 1 , top).
Get Radiology Tree app to read full this article<
Get Radiology Tree app to read full this article<
dlpair=CTDIair×N×T(mGy⋅cm). d
l
p
a
i
r
=
C
T
D
I
a
i
r
×
N
×
T
(
mGy
·
cm
)
.
Get Radiology Tree app to read full this article<
Get Radiology Tree app to read full this article<
DLPair=dlpair×R(mGy⋅cm) D
L
P
a
i
r
=
d
l
p
a
i
r
×
R
(
mGy
·
cm
)
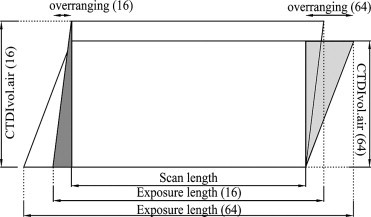
where R is the total number of rotations, which includes over-ranging (the hatched areas in Fig. 2 ). Mathematically, R can be expressed as:
R=L+overrangingBWnom×P R
=
L
+
o
v
e
r
r
a
n
g
i
n
g
B
W
n
o
m
×
P
where L is the scan length, BW nom is the nominal beam width, and P is the CT pitch, which is determined by the couch-top movement and the number of slices ( ). The enumerator represents the exposure length. Over-ranging therefore relates to exposure length according to the following equation:
overranging=exposurelength−L(cm). o
v
e
r
r
a
n
g
i
n
g
=
e
x
p
o
s
u
r
e
l
e
n
g
t
h
-
L
(
cm
)
.
Get Radiology Tree app to read full this article<
Get Radiology Tree app to read full this article<
Radd=overrangingBWnom×P. R
a
d
d
=
o
v
e
r
r
a
n
g
i
n
g
B
W
n
o
m
×
P
.
Get Radiology Tree app to read full this article<
Get Radiology Tree app to read full this article<
Get Radiology Tree app to read full this article<
Results
Get Radiology Tree app to read full this article<
Table 1
Comparison of DLP air in 16- and 64-Row MDCT With Variable Scan Lengths
Exposure: length (cm) Scan: length (cm) DLP air (mGy · cm) 16-row MDCT 64-row MDCT 16-row MDCT 64-row MDCT 6.6 10.4 5 143.9 178.4 11.6 15.4 10 253.7 264.6 13.9 17.7 12.3 ⁎ 304.2 304.2 21.6 25.4 20 473.3 436.9 31.6 35.4 30 692.9 609.3 41.6 45.4 40 912.5 781.7 51.6 55.4 50 1132.1 954.0 61.6 65.4 60 1351.8 1126.4 71.6 75.4 70 1571.4 1298.7 81.6 85.4 80 1791.0 1471.1
DLP, dose-length product.
P = .9375 for 16-row multidetector computed tomography (MDCT) and P = .8281 for 64-row MDCT. Separate experiments had established that the CT dose index (CTDI) varies with beam width. For beam widths of 8 mm (16 × 0.5) and 32 mm (64 × 0.5), the CTDI air values were 20.6 and 14.3 mGy, respectively. For 139 mAs effective, this results in CTDI vol-air = 21.97 mGy (16-row MDCT) and CTDI vol-air = 17.27 mGy (64-row MDCT).
Get Radiology Tree app to read full this article<
Get Radiology Tree app to read full this article<
Get Radiology Tree app to read full this article<
Get Radiology Tree app to read full this article<
Get Radiology Tree app to read full this article<
Get Radiology Tree app to read full this article<
Discussion
Get Radiology Tree app to read full this article<
Get Radiology Tree app to read full this article<
Get Radiology Tree app to read full this article<
Conclusion
Get Radiology Tree app to read full this article<
References
1. Kalender W.A., Seissler W., Klotz E., et. al.: Spiral volumetric CT with single-breath-hold technique, continuous transport, and scanner rotation. Radiology 1998; 176: pp. 181-183.
2. Aoki C., Nishizawa K., Tonari A., et. al.: Effective dosing for multi-detector CT scanning. Jpn J Med Imaging 2001; 20: pp. 101-109.
3. Nagel H.S., Galanski M., Hidajat N., et. al.: Radiation Exposure in Computed Tomography—Fundamentals, Influencing Parameters, Dose Assessment, Optimisation, Scanner Data, Terminology.2001.CTB PublicationsHamburg
4. Thomas L.T., Neil B.B., Tin-Su P., et. al.: A dose reduction X-ray beam positioning system for high-speed multislice CT scanners. Med Phys 2000; 27: pp. 2659-2668.
5. Deetjen A., Möllmann S., Conradi G., et. al.: Use of automatic exposure control in multislice computed tomography of the coronaries: Comparison of 16-slice and 64-slice scanner data with conventional coronary angiography. Heart 2007; 93: pp. 1040-1043.
6. Hausleiter J., Meyer T., Hadamitzky M., et. al.: Radiation dose estimates from cardiac multislice computed tomography in daily practice: Impact of different scanning protocols on effective dose estimates. Circulation 2007; 113: pp. 1305-1310.
7. Dewey M., Hoffmann H., Hamm B.: CT coronary angiography using 16 and 64 simultaneous detector rows: Intraindividual comparison. Rofo 2007; 179: pp. 581-586.
8. International Electrotechnical Commission: Evaluation and Routine Testing in Medical Imaging Departments Constancy Tests: X-ray Equipment for Computed Tomography.1994.IECGeneva, Switzerland:pp. 1223-1226.