
Rationale and Objectives
To determine whether the mammographic technologist has an effect on the radiologists’ interpretative performance of screening mammography in community practice.
Materials and Methods
In this institutional review board–approved retrospective cohort study, we included Carolina Mammography Registry data from 372 radiologists and 356 mammographic technologists from 1994 to 2009 who performed 1,003,276 screening mammograms. Measures of interpretative performance (recall rate, sensitivity, specificity, positive predictive value [PPV 1 ], and cancer detection rate [CDR]) were ascertained prospectively with cancer outcomes collected from the state cancer registry and pathology reports. To determine if the mammographic technologist influenced the radiologists’ performance, we used mixed effects logistic regression models, including a radiologist-specific random effect and taking into account the clustering of examinations across women, separately for screen-film mammography (SFM) and full-field digital mammography (FFDM).
Results
Of the 356 mammographic technologists included, 343 performed 889,347 SFM examinations, 51 performed 113,929 FFDM examinations, and 38 performed both SFM and FFDM examinations. A total of 4328 cancers were reported for SFM and 564 cancers for FFDM. The technologists had a statistically significant effect on the radiologists’ recall rate, sensitivity, specificity, and CDR for both SFM and FFDM ( P values <.01). For PPV 1 , variability by technologist was observed for SFM ( P value <.0001) but not for FFDM ( P value = .088).
Conclusions
The interpretative performance of radiologists in screening mammography varies substantially by the technologist performing the examination. Additional studies should aim to identify technologist characteristics that may explain this variation.
Breast cancer is the most common cancer in women, excluding cancers of the skin and is expected to account for an estimated 232,670 cases and 40,000 deaths in the United States in 2014 . Routine screening mammography is the primary means of early breast cancer detection with radiologic technologists fulfilling an essential role in the mammography process. Although routine screening mammography has been shown to be effective in reducing breast cancer mortality , many factors lead to variability in interpretative performance by radiologists .
Several studies have found radiologists’ gender, work patterns, postresidency training, years of experience, specialization, and screening versus diagnostic mix influence mammography performance measures . It is also likely that the radiologists’ ability to interpret mammograms is affected by technologists who work with the radiologists. Possible sources of variation in radiologists’ interpretative ability may include the interface between the radiologist and technologist and the ability of the radiologic technologist to obtain a high-quality image in terms of positioning, compression, and sharpness.
Get Radiology Tree app to read full this article<
Materials and methods
Get Radiology Tree app to read full this article<
Study Population
Get Radiology Tree app to read full this article<
Definitions
Get Radiology Tree app to read full this article<
Get Radiology Tree app to read full this article<
Get Radiology Tree app to read full this article<
Statistical Analysis
Get Radiology Tree app to read full this article<
Get Radiology Tree app to read full this article<
Get Radiology Tree app to read full this article<
Results
Get Radiology Tree app to read full this article<
Table 1
Patient Characteristics for 1,003,276 Screening Mammograms by Modality
Patient Characteristic SFM Examinations ( n = 889,347) FFDM Examinations ( n = 113,929) No Cancer ( n = 885,019) Cancer ( n = 4328) No Cancer ( n = 113,365) Cancer ( n = 564) N (%) N (%) N (%) N (%) Age (years) 18-39 44,850 (5.1) 106 (2.5) 4023 (3.6) 6 (1.1) 40-49 240,640 (27.2) 700 (16.2) 26,443 (23.3) 78 (13.8) 50-59 249,940 (28.2) 1174 (27.1) 31,125 (27.5) 120 (21.3) 60-69 185,846 (21.0) 1140 (26.3) 27,513 (24.3) 167 (29.6) 70-79 125,030 (14.1) 892 (20.6) 18,094 (16.0) 134 (23.8) ≥80 38,713 (4.4) 316 (7.3) 6167 (5.4) 59 (10.5) Race Black 143,750 (16.2) 712 (16.5) 20,155 (17.8) 96 (17.0) White 651,721 (73.6) 3193 (73.8) 84,409 (74.5) 433 (76.8) Other 12,273 (1.4) 55 (1.3) 1507 (1.3) 5 (0.9) Missing 77,275 (8.7) 368 (8.5) 7294 (6.4) 30 (5.3) Breast density Almost entirely fat 48,057 (5.4) 119 (2.8) 6894 (6.1) 24 (4.3) Scattered fibroglandular densities 395,301 (44.7) 1840 (42.5) 44,387 (39.2) 197 (34.9) Heterogenously dense 346,786 (39.2) 1862 (43.0) 46,272 (40.8) 290 (51.4) Extremely dense 67,949 (7.7) 321 (7.4) 5681 (5.0) 26 (4.6) Missing 26,926 (3.0) 186 (4.3) 10,131 (8.9) 27 (4.8) Family history of breast cancer Yes 70,766 (8.0) 467 (10.8) 12,538 (11.1) 81 (14.4) No/missing 814,253 (92.0) 3861 (89.2) 100,827 (88.9) 483 (85.6) History of breast procedure Yes 187,652 (21.2) 1285 (29.7) 27,705 (24.4) 192 (34.0) No/missing 697,367 (78.8) 3043 (70.3) 85,660 (75.6) 372 (66.0) Time since prior mammogram No prior 88,270 (10.0) 549 (12.7) 6856 (6.1) 48 (8.5) <1 year 11,110 (1.3) 66 (1.5) 437 (0.4) 2 (0.4) 1 to <3 years 649,189 (73.4) 2906 (67.1) 81,772 (72.1) 374 (66.3) ≥3 years 79,892 (9.0) 546 (12.6) 8437 (7.4) 79 (14.1) Missing 56,558 (6.4) 261 (6.0) 15,863 (14.0) 61 (10.8) Year of examination 1994 4843 (0.6) 19 (0.4) 0 0 1995 14,616 (1.7) 56 (1.3) 0 0 1996 31,192 (3.5) 167 (3.9) 0 0 1997 45,199 (5.1) 231 (5.3) 0 0 1998 67,056 (7.6) 311 (7.2) 0 0 1999 76,359 (8.6) 389 (9.0) 0 0 2000 84,707 (9.6) 405 (9.4) 0 0 2001 91,532 (10.3) 447 (10.3) 0 0 2002 97,266 (11.0) 474 (11.0) 0 0 2003 83,159 (9.4) 431 (10.0) 5631 (5.0) 28 (5.0) 2004 68,809 (7.8) 320 (7.4) 5877 (5.2) 24 (4.3) 2005 67,451 (7.6) 298 (6.9) 5800 (5.1) 32 (5.7) 2006 59,576 (6.7) 310 (7.2) 7602 (6.7) 44 (7.8) 2007 45,424 (5.1) 224 (5.2) 19,986 (17.6) 107 (19.0) 2008 35,339 (4.0) 171 (4.0) 31,099 (27.4) 150 (26.6) 2009 12, 471 (1.4) 75 (1.7) 37,370 (33.0) 179 (31.7)
FFDM, full-field digital mammography; SFM, screen-film mammography.
Get Radiology Tree app to read full this article<
Get Radiology Tree app to read full this article<
Get Radiology Tree app to read full this article<
Table 2
Mean (95% Confidence Intervals) and Median (25th–75th Percentile) Interpretative Performance Measures for Screen-Film Mammography and Full-Field Digital Mammography
SFM Examinations FFDM Examinations Mean (95%CI) Median (25th–75th Percentile) Mean (95%CI) Median (25th–75th Percentile) Recall rate (per 100 examinations) 8.1 (7.7–8.6) 7.6 (5.1–10.7) 10.5 (9.6–11.5) 9.9 (8.2–13.1) Sensitivity 78.7 (76.3–81.2) 81.8 (68.8–100) 79.3 (70.0–88.7) 90.9 (80.0–100) Specificity 92.2 (91.8–92.7) 92.7 (89.8–95.2) 89.8 (88.9–90.8) 90.4 (87.5–92.0) Positive predictive value 5.6 (5.1–6.1) 4.6 (2.9–7.4) 4.0 (2.9–5.1) 3.8 (1.9–5.3) Cancer detection rate (per 1000 examinations) 3.8 (3.6–4.1) 3.7 (2.3–4.9) 4.0 (3.1–5.1) 3.6 (1.2–5.8)
CI, confidence interval; FFDM, full-field digital mammography; SFM, screen-film mammography.
Get Radiology Tree app to read full this article<
Get Radiology Tree app to read full this article<
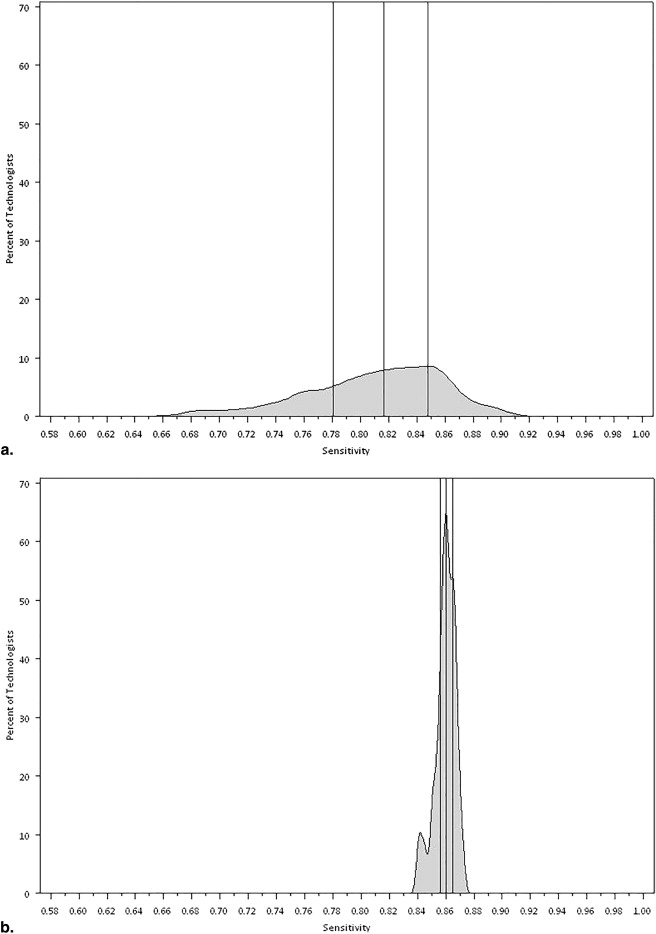
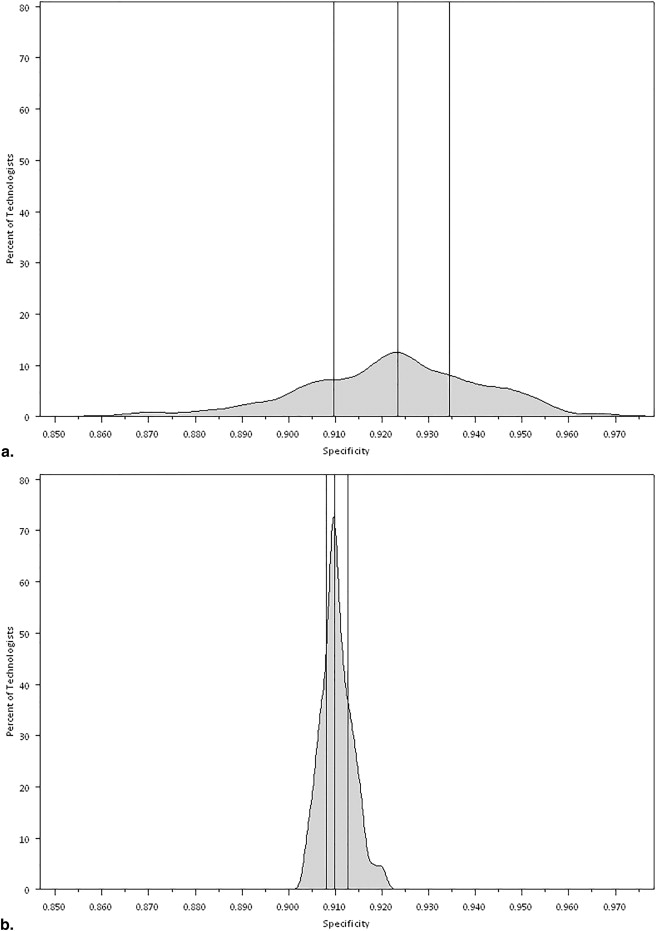
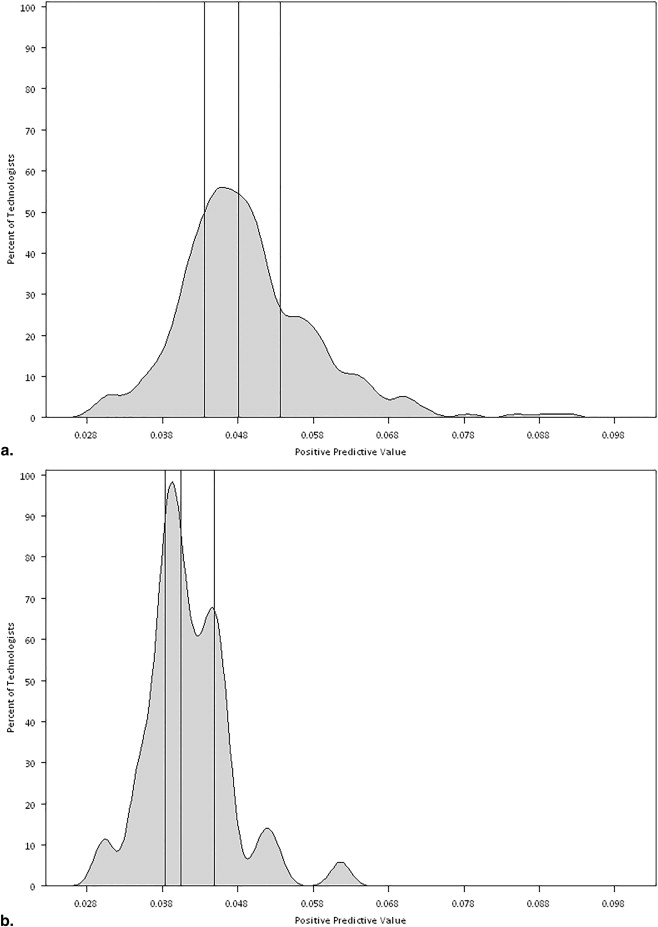
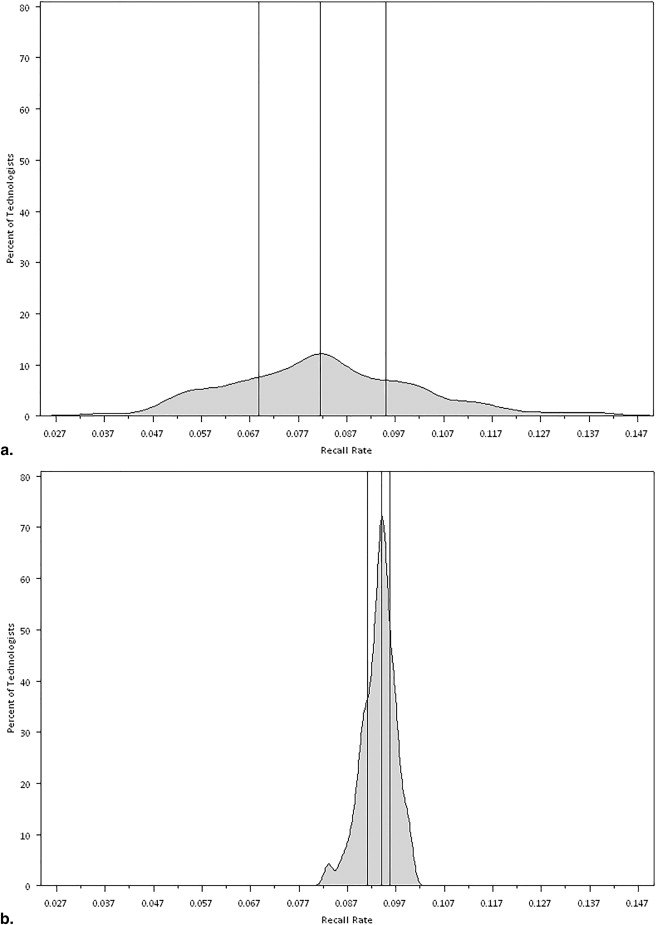

Table 3
Resulting P Values From Mixed-Effects Logistic Regression Models Assessing Variability of Performance Measures by Technologist
Performance Measure SFM Examinations ( n = 889,347) FFDM Examinations ( n = 113,929) Recall Rate <.0001 .001 Sensitivity <.0001 .019 Specificity <.0001 .003 Positive predictive value <.0001 .088 Cancer detection rate <.0001 .0001
FFDM, full-field digital mammography; SFM, screen-film mammography.
Get Radiology Tree app to read full this article<
Discussion
Get Radiology Tree app to read full this article<
Get Radiology Tree app to read full this article<
Get Radiology Tree app to read full this article<
Get Radiology Tree app to read full this article<
Get Radiology Tree app to read full this article<
Get Radiology Tree app to read full this article<
Study Limitations
Get Radiology Tree app to read full this article<
Conclusions
Get Radiology Tree app to read full this article<
Acknowledgments
Get Radiology Tree app to read full this article<
Get Radiology Tree app to read full this article<
References
1. American Cancer Society: What are the key statistics about breast cancer?.2013.In: Society AC
2. National Cancer Institute: Breast cancer screening (PDQ).2010.National Cancer InstituteIn. Bethesda, MD
3. Miglioretti D.L., Smith-Bindman R., Abraham L., et. al.: Radiologist characteristics associated with interpretive performance of diagnostic mammography. J Natl Cancer Inst 2007; 99: pp. 1854-1863.
4. Elmore J.G., Miglioretti D.L., Reisch L.M., et. al.: Screening mammograms by community radiologists: variability in false-positive rates. J Natl Cancer Inst 2002; 94: pp. 1373-1380.
5. Barlow W.E., Chi C., Carney P.A., et. al.: Accuracy of screening mammography interpretation by characteristics of radiologists. J Natl Cancer Inst 2004; 96: pp. 1840-1850.
6. Carney P.A., Elmore J.G., Abraham L.A., et. al.: Radiologist uncertainty and the interpretation of screening. Med Decis Making 2004; 24: pp. 255-264.
7. Elmore J.G., Jackson S.L., Abraham L., et. al.: Variability in interpretive performance at screening mammography and radiologists’ characteristics associated with accuracy. Radiology 2009; 253: pp. 641-651.
8. Elmore J.G., Wells C.K., Howard D.H.: Does diagnostic accuracy in mammography depend on radiologists’ experience?. J Womens Health 1998; 7: pp. 443-449.
9. Molins E., Macia F., Ferrer F., et. al.: Association between radiologists’ experience and accuracy in interpreting screening mammograms. BMC Health Serv Res 2008; 8: pp. 91.
10. Esserman L., Cowley H., Eberle C., et. al.: Improving the accuracy of mammography: volume and outcome relationships. J Natl Cancer Inst 2002; 94: pp. 369-375.
11. Beam C.A., Layde P.M., Sullivan D.C.: Variability in the interpretation of screening mammograms by US radiologists. Findings from a national sample. Arch Intern Med 1996; 156: pp. 209-213.
12. Elmore J.G., Wells C.K., Lee C.H., et. al.: Variability in radiologists’ interpretations of mammograms. N Engl J Med 1994; 331: pp. 1493-1499.
13. van den Biggelaar F.J., Flobbe K., van Engelshoven J.M., et. al.: Pre-reading mammograms by specialised breast technologists: legal implications for technologist and radiologist in The Netherlands. Eur J Health Law 2009; 16: pp. 271-279.
14. Wivell G., Denton E.R., Eve C.B., et. al.: Can radiographers read screening mammograms?. Clin Radiol 2003; 58: pp. 63-67.
15. Pauli R., Hammond S., Cooke J., et. al.: Radiographers as film readers in screening mammography: an assessment of competence under test and screening conditions. Br J Radiol 1996; 69: pp. 10-14.
16. Bassett L.W., Hollatz-Brown A.J., Bastani R., et. al.: Effects of a program to train radiologic technologists to identify abnormalities on mammograms. Radiology 1995; 194: pp. 189-192.
17. Haiart D.C., Henderson J.: A comparison of interpretation of screening mammograms by a radiographer, a doctor and a radiologist: results and implications. Br J Clin Pract 1991; 45: pp. 43-45.
18. Breast Cancer Surveillance Consortium glossary of terms.Data dictionary version 5.0.2009.Breast Cancer Surveillance ConsortiumSeattle, WA:
19. Taplin S.H., Ichikawa L.E., Kerlikowske K., et. al.: Concordance of breast imaging reporting and data system assessments and management recommendations in screening mammography. Radiology 2002; 222: pp. 529-535.
20. American College of Radiology: Illustrated Breast Imaging Reporting and Data System (BI-RADS).1998.American College of RadiologyReston, VA
21. Rosenberg R.D., Yankaskas B.C., Abraham L.A., et. al.: Performance benchmarks for screening mammography. Radiology 2006; 241: pp. 55-66.
22. Wolfinger R., O’Connell M.: Generalized linear mixed models a pseudo-likelihood approach. J Stat Comput Simul 1993; 48: pp. 233-243.
23. Carney P.A., Cook A.J., Miglioretti D.L., et. al.: Use of clinical history affects accuracy of interpretive performance of screening mammography. J Clin Epidemiol 2012; 65: pp. 219-230.
24. Cook A.J., Elmore J.G., Miglioretti D.L., et. al.: Decreased accuracy in interpretation of community-based screening mammography for women with multiple clinical risk factors. J Clin Epidemiol 2010; 63: pp. 441-451.
25. Miglioretti D.L., Gard C.C., Carney P.A., et. al.: When radiologists perform best: the learning curve in screening mammogram interpretation. Radiology 2009; 253: pp. 632-640.
26. Buist D.S., Anderson M.L., Haneuse S.J., et. al.: Influence of annual interpretive volume on screening mammography performance in the United States. Radiology 2011; 259: pp. 72-84.
27. Geller B.M., Bowles E.J., Sohng H.Y., et. al.: Radiologists’ performance and their enjoyment of interpreting screening mammograms. AJR Am J Roentgenol 2009; 192: pp. 361-369.
28. Smith-Bindman R., Chu P., Miglioretti D.L., et. al.: Physician predictors of mammographic accuracy. J Natl Cancer Inst 2005; 97: pp. 358-367.
29. Tan A., Freeman D.H., Goodwin J.S., et. al.: Variation in false-positive rates of mammography reading among 1067 radiologists: a population-based assessment. Breast Cancer Res Treat 2006; 100: pp. 309-318.
30. Theberge I., Hebert-Croteau N., Langlois A., et. al.: Volume of screening mammography and performance in the Quebec population-based Breast Cancer Screening Program. CMAJ 2005; 172: pp. 195-199.
31. Taplin S., Abraham L., Barlow W.E., et. al.: Mammography facility characteristics associated with interpretive accuracy of screening mammography. J Natl Cancer Inst 2008; 100: pp. 876-887.
32. Leader J.K., Hakim C.M., Ganott M.A., et. al.: A multisite telemammography system for remote management of screening mammography: an assessment of technical, operational, and clinical issues. J Digit Imaging 2006; 19: pp. 216-225.
33. Sumkin J.H., Klaman H.M., Graham M., et. al.: Prescreening mammography by technologists: a preliminary assessment. AJR Am J Roentgenol 2003; 180: pp. 253-256.
34. Tonita J.M., Hillis J.P., Lim C.H.: Medical radiologic technologist review: effects on a population-based breast cancer screening program. Radiology 1999; 211: pp. 529-533.
35. Apffelstaedt J., Steenkamp V., Baatjes K.: Surgeon-read screening mammography: an analysis of 11,948 examinations. Ann Surg Oncol 2010; 17: pp. 249-254.
36. Duijm L.E.M., Groenewoud J.H., Fracheboud J., et. al.: Additional double reading of screening mammograms by radiologic technologists: impact on screening performance parameters. J Natl Cancer Inst 2007; 99: pp. 1162-1170.
37. Duijm L.E.M., Groenewoud J.H., Fracheboud J., et. al.: Introduction of additional double reading of mammograms by radiographers: effects on a biennial screening programme outcome. Eur J Cancer 2008; 44: pp. 1223-1228.
38. Duijm L.E.M., Louwman M.W.J., Groenewoud J.H., et. al.: Inter-observer variability in mammography screening and effect of type and number of readers on screening outcome. Br J Cancer 2009; 100: pp. 901-907.
39. Moran S., Warren-Forward H.: A retrospective study of the performance of radiographers in interpreting screening mammograms. Radiography 2011; 17: pp. 126-131.
40. Mucci B., Lawson S., Athey G., et. al.: Radiographers as readers in breast screening: experience with a ‘red dot’ method. The Breast 1997; 6: pp. 183-185.
41. Alcorn F.S., O’Donnell E., Ackerman L.V.: The protocol and results of training nonradiologists to scan mammograms. Radiology 1971; 99: pp. 523-529.
42. Engelman K.K., Cizik A.M., Ellerbeck E.F.: Women’s satisfaction with their mammography experience: results of a qualitative study. Women Health 2005; 42: pp. 17-35.
43. Ndikum-Moffor F.M., Braiuca S., Daley C.M., et. al.: Assessment of mammography experiences and satisfaction among American Indian/Alaska Native women. Womens Health Issues 2013; 23: pp. e395-402.
44. Fox S.A., Klos D.S., Worthen N.J., et. al.: Improving the adherence of urban women to mammography guidelines: strategies for radiologists. Radiology 1990; 174: pp. 203-206.
45. Administration USFDA. Radiologic Technologist Mammography Specific Training. Mammography Quality Standards Act and Program Policy Guidance Help System. Available at: http://www.fda.gov/Radiation-EmittingProducts/MammographyQualityStandardsActandProgram/Guidance/PolicyGuidanceHelpSystem/ucm052484.htm . Accessed November 6, 2013.
46. FDA - MQSA Rules and Regulations. Available at: https://www.radcomm.net/regulations/ . Accessed April 15, 2014.