
Rationale and Objectives
Computer-aided diagnostic (CAD) systems fundamentally require the opinions of expert human observers to establish “truth” for algorithm development, training, and testing. The integrity of this “truth,” however, must be established before investigators commit to this “gold standard” as the basis for their research. The purpose of this study was to develop a quality assurance (QA) model as an integral component of the “truth” collection process concerning the location and spatial extent of lung nodules observed on computed tomography (CT) scans to be included in the Lung Image Database Consortium (LIDC) public database.
Materials and Methods
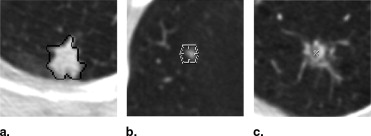
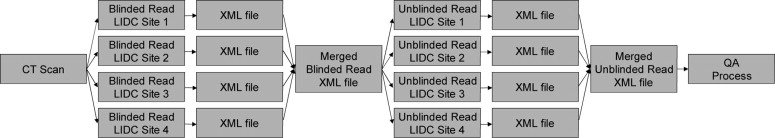
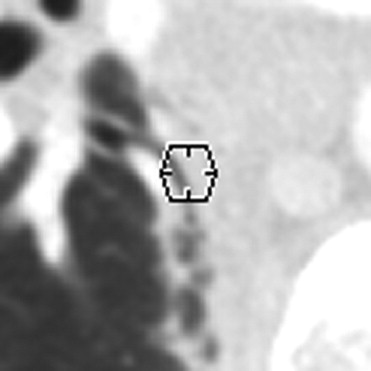
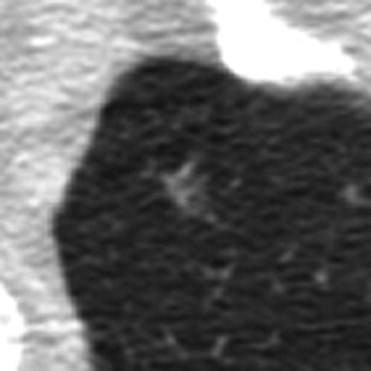
One hundred CT scans were interpreted by four radiologists through a two-phase process. For the first of these reads (the “blinded read phase”), radiologists independently identified and annotated lesions, assigning each to one of three categories: “nodule ≥3 mm,” “nodule <3 mm,” or “non-nodule ≥3 mm.” For the second read (the “unblinded read phase”), the same radiologists independently evaluated the same CT scans, but with all of the annotations from the previously performed blinded reads presented; each radiologist could add to, edit, or delete their own marks; change the lesion category of their own marks; or leave their marks unchanged. The post-unblinded read set of marks was grouped into discrete nodules and subjected to the QA process, which consisted of identification of potential errors introduced during the complete image annotation process and correction of those errors. Seven categories of potential error were defined; any nodule with a mark that satisfied the criterion for one of these categories was referred to the radiologist who assigned that mark for either correction or confirmation that the mark was intentional.
Results
A total of 105 QA issues were identified across 45 (45.0%) of the 100 CT scans. Radiologist review resulted in modifications to 101 (96.2%) of these potential errors. Twenty-one lesions erroneously marked as lung nodules after the unblinded reads had this designation removed through the QA process.
Conclusions
The establishment of “truth” must incorporate a QA process to guarantee the integrity of the datasets that will provide the basis for the development, training, and testing of CAD systems.
The Lung Image Database Consortium (LIDC) was established by the National Cancer Institute through a peer review of applications submitted in response to its Request for Applications in 2000 entitled “Lung Image Database Resource for Imaging Research.” Through this Request for Applications, the National Cancer Institute outlined the requirements for a well-characterized repository of computed tomography (CT) scans to stimulate the development of computer-aided diagnostic (CAD) methods by the thoracic imaging research community. The intent of this initiative was to create a consortium of institutions that would develop consensus guidelines for a standardized database of thoracic CT scans that would serve as a reference standard for CAD investigators ( ). The mission of the LIDC is to develop the database as an “international research resource for the development, training, and evaluation of CAD methods for lung cancer detection and diagnosis” ( ).
The distinction between the collection of images as a repository of clinical CT scans and the creation of a reference standard as a robust research resource has guided the efforts of the LIDC since its inception. The LIDC database has been designed to serve specifically as a reference standard. Accordingly, the CT scans that comprise the database are accompanied by associated “truth” information to more completely facilitate lung nodule CAD research ( ). The creation of a reference database carries a burden of accuracy and completeness that demands a complex process; the multi-institutional nature of the LIDC effort further compounds the complexity of the task. This same complexity necessitates a systematic review of the collected “truth” information to identify and correct potential errors.
Get Radiology Tree app to read full this article<
Get Radiology Tree app to read full this article<
Get Radiology Tree app to read full this article<
Materials and methods
“Truth” Collection Process
Get Radiology Tree app to read full this article<
Get Radiology Tree app to read full this article<
Get Radiology Tree app to read full this article<
Get Radiology Tree app to read full this article<
Get Radiology Tree app to read full this article<
QA Model
Get Radiology Tree app to read full this article<
Get Radiology Tree app to read full this article<
Get Radiology Tree app to read full this article<
Get Radiology Tree app to read full this article<
Get Radiology Tree app to read full this article<
Get Radiology Tree app to read full this article<
Get Radiology Tree app to read full this article<
Get Radiology Tree app to read full this article<
Patient Image Data
Get Radiology Tree app to read full this article<
Results
Get Radiology Tree app to read full this article<
Table 1
The Number of Lesions with QA Errors and the Number of Individual QA Errors (ie, Individual Marks that were Flagged) in Each of the Seven QA Categories
QA Category Definition Number of Lesions with QA Issues Number of Individual QA Issues 1 Errant marks on nonpulmonary regions of the image or stray marks within the lungs 14 16 2 Marks from multiple categories assigned to the same lesion by the same radiologist 13 14 3 More than a single nodule mark assigned to the same lesion by a single radiologist 20 28 4 “Nodule ≥3 mm” contours for a single lesion that are recorded as more than one lesion 0 0 5 “Nodule ≥3 mm” contours that are not contiguous across sections 11 12 6 Lesion marked as “nodule ≥3 mm” by 3 radiologists with no mark at all by the fourth 21 21 7 Inconsistency between lesion size and the assigned nodule category 14 14 Total 93 ⁎ 105
QA: quality assurance.
Get Radiology Tree app to read full this article<
Get Radiology Tree app to read full this article<
Get Radiology Tree app to read full this article<
Get Radiology Tree app to read full this article<
Discussion
Get Radiology Tree app to read full this article<
Get Radiology Tree app to read full this article<
Get Radiology Tree app to read full this article<
Get Radiology Tree app to read full this article<
Get Radiology Tree app to read full this article<
Get Radiology Tree app to read full this article<
Get Radiology Tree app to read full this article<
Get Radiology Tree app to read full this article<
Get Radiology Tree app to read full this article<
Get Radiology Tree app to read full this article<
References
1. Clarke L.P., Croft B.Y., Staab E., et. al.: National Cancer Institute initiative: Lung image database resource for imaging research. Acad Radiol 2001; 8: pp. 447-450.
2. Armato S.G., McLennan G., McNitt-Gray M.F., et. al.: Lung Image Database Consortium: developing a resource for the medical imaging research community. Radiology 2004; 232: pp. 739-748.
3. Dodd L.E., Wagner R.F., Armato S.G., et. al.: Assessment methodologies and statistical issues for computer-aided diagnosis of lung nodules in computed tomography: contemporary research topics relevant to the Lung Image Database Consortium. Acad Radiol 2004; 11: pp. 462-475.
4. Rogers S.R., Brown M.S., Goldin J.G., et. al.: Automated lung nodule detection in CT: nodule inclusion criteria for determining ground “truth”. Radiology 2002; 225: pp. 407.
5. Wormanns D., Ludwig K., Beyer F., et. al.: Detection of pulmonary nodules at multirow-detector CT: effectiveness of double reading to improve sensitivity at standard-dose and low-dose chest CT. Eur Radiol 2005; 15: pp. 14-22.
6. Leader J.K., Warfel T.E., Fuhrman C.R., et. al.: Pulmonary nodule detection with low-dose CT of the lung: Agreement among radiologists. AJR Am J Roentgenol 2005; 185: pp. 973-978.
7. Novak C.L., Qian J., Fan L., et. al.: Inter-observer variations on interpretation of multi-slice CT lung cancer screening studies, and the implications for computer-aided diagnosis. SPIE Proc 2002; 4684: pp. 68-79.
8. Wormanns D., Beyer F., Diederich S., et. al.: Diagnostic performance of a commercially available computer-aided diagnosis system for automatic detection of pulmonary nodules: comparison with single and double reading. Rofo: Fortschritte auf dem Gebiete der Rontgenstrahlen und der Nuklearmedizin 2004; 176: pp. 953-958.
9. Marten K., Seyfarth T., Auer F., et. al.: Computer-assisted detection of pulmonary nodules: performance evaluation of an expert knowledge-based detection system in consensus reading with experienced and inexperienced chest radiologists. Eur Radiol 2004; 14: pp. 1930-1938.
10. Revesz G., Kundel H.L., Bonitatibus M.: The effect of verification on the assessment of imaging techniques. Invest Radiol 1983; 18: pp. 194-198.
11. Eckstein M.P., Wickens T.D., Aharonov G., et. al.: Quantifying the limitations of the use of consensus expert committees in ROC studies. SPIE Proc 1998; 3340: pp. 128-134.
12. Nishikawa R.M., Yarusso L.M.: Variations in measured performance of CAD schemes due to database composition and scoring protocol. SPIE Proceedings 1998; 3338: pp. 840-844.
13. McNitt-Gray M.F., Armato S.G., Meyer C.R., et. al.: The Lung Image Database Consortium (LIDC) data collection process for nodule detection and annotation. Acad Rad 2007; 14: pp. 1464-1474.
14. Armato S.G., Roberts R.Y., McLennan G., et. al.: The Lung Image Database Consortium (LIDC): A quality assurance model for the collection of expert-defined “truth” in lung-nodule-based image analysis studies. SPIE Proceedings 2007; 6514: 651429-1-651429-7