
Rationale and Objectives
The purpose of this study was to analyze the variability of experienced thoracic radiologists in the identification of lung nodules on computed tomography (CT) scans and thereby to investigate variability in the establishment of the “truth” against which nodule-based studies are measured.
Materials and Methods
Thirty CT scans were reviewed twice by four thoracic radiologists through a two-phase image annotation process. During the initial “blinded read” phase, radiologists independently marked lesions they identified as “nodule ≥3 mm (diameter),” “nodule <3 mm,” or “non-nodule ≥3 mm.” During the subsequent “unblinded read” phase, the blinded read results of all four radiologists were revealed to each radiologist, who then independently reviewed their marks along with the anonymous marks of their colleagues; a radiologist’s own marks then could be deleted, added, or left unchanged. This approach was developed to identify, as completely as possible, all nodules in a scan without requiring forced consensus.
Results
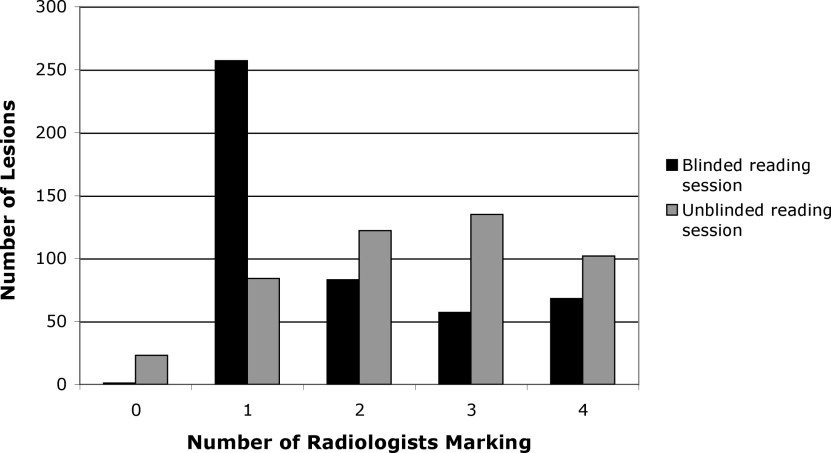
After the initial blinded read phase, 71 lesions received “nodule ≥3 mm” marks from at least one radiologist; however, all four radiologists assigned such marks to only 24 (33.8%) of these lesions. After the unblinded reads, a total of 59 lesions were marked as “nodule ≥3 mm” by at least one radiologist. Twenty-seven (45.8%) of these lesions received such marks from all four radiologists, three (5.1%) were identified as such by three radiologists, 12 (20.3%) were identified by two radiologists, and 17 (28.8%) were identified by only a single radiologist.
Conclusion
The two-phase image annotation process yields improved agreement among radiologists in the interpretation of nodules ≥3 mm. Nevertheless, substantial variabilty remains across radiologists in the task of lung nodule identification.
Both the interest in and demand for computer-aided diagnostic (CAD) methods for a variety of radiologic tasks involving lung nodules and computed tomography (CT) scans have been rapidly accelerating. CAD for thoracic CT is no longer in its infancy. The field has matured to the point that regulatory approval is now a practical consideration, and clinical radiologists faced with the task of both identifying and characterizing lung nodules on large, multidetector row CT datasets recognize the need for computerized assistance ( ). As more investigators seek to contribute to this expanding field, a common constraint has become evident—limited access to well-characterized image data.
Recognizing that the development of CAD methods by the medical imaging research community would be facilitated and stimulated through access to a well-characterized repository of CT scans, the National Cancer Institute formed the Lung Image Database Consortium (LIDC) ( ). The publicly accessible database of CT scans and corresponding “truth” being created by the LIDC is expected to hasten advancement of lung nodule CAD research by 1) providing clinical images to investigators who might not have access to patient images and 2) allowing for a direct comparison of CAD methods reported in the literature by eliminating database composition as a source of variability in system performance ( ).
Get Radiology Tree app to read full this article<
Get Radiology Tree app to read full this article<
Get Radiology Tree app to read full this article<
Materials and methods
Patient Image Data
Get Radiology Tree app to read full this article<
Get Radiology Tree app to read full this article<
Data Collection Process
Get Radiology Tree app to read full this article<
Get Radiology Tree app to read full this article<
Get Radiology Tree app to read full this article<
Get Radiology Tree app to read full this article<
Get Radiology Tree app to read full this article<
Get Radiology Tree app to read full this article<
Analysis of Lesions
Get Radiology Tree app to read full this article<
Get Radiology Tree app to read full this article<
Get Radiology Tree app to read full this article<
Get Radiology Tree app to read full this article<
Get Radiology Tree app to read full this article<
Results
Numbers of Identified Lesions
Get Radiology Tree app to read full this article<
Get Radiology Tree app to read full this article<
Get Radiology Tree app to read full this article<
Table 1
Numbers of Lesions Marked by Different Radiologists During Blinded and Unblinded Reads
Radiologist Total Number of Lesions in Scans Read by Radiologist (Blinded Read) Marked Blinded Lesions Total Number of Lesions in Scans Read by Radiologist (Unblinded Read) Marked Unblinded Lesions A 338 159 (47.0%) 323 286 (88.5%) B 359 115 (32.0%) 349 122 (35.0%) C 386 282 (73.1%) 364 332 (91.2%) D 376 131 (34.8%) 355 142 (40.0%) E 401 179 (44.6%) 381 259 (68.0%)
Each of the five sites contributed six scans (for a total of 30 scans), and the LIDC radiologist at each site did not read scans from their own institution; accordingly, the total number of lesions in scans read by each radiologist was different.
Get Radiology Tree app to read full this article<
Lesion Category Evaluation
Get Radiology Tree app to read full this article<
Get Radiology Tree app to read full this article<
Get Radiology Tree app to read full this article<
Get Radiology Tree app to read full this article<
Table 2
Numbers of Lesions Assigned to Each Lesion Category During the Blinded and Unblinded Reads
Unblinded Read Nodule Micronodule Non-nodule No mark Radiologist A Blinded Read Nodule 38 (11.2) 0 1 (0.3) 1 (0.3) Micronodule 0 21 (6.2) 0 0 Non-nodule 0 1 (0.3) 94 (27.8) 3 (0.9) No mark 4 (1.2) 69 (20.4) 58 (17.2) 48 (14.2) Radiologist B Blinded Read Nodule 25 (6.9) 0 0 0 Micronodule 0 24 (6.7) 0 0 Non-nodule 0 0 66 (18.3) 0 No mark 1 (0.3) 2 (0.6) 4 (1.1) 238 (66.1) Radiologist C Blinded Read Nodule 23 (5.9) 1 (0.3) 1 (0.3) 1 (0.3) Micronodule 1 (0.3) 97 (25.1) 6 (1.6) 22 (5.7) Non-nodule 0 0 115 (29.7) 15 (3.9) No mark 2 (0.5) 25 (6.5) 61 (15.8) 17 (4.4) Radiologist D Blinded Read Nodule 23 (6.1) 0 0 1 (0.3) Micronodule 3 (0.8) 32 (8.5) 2 (0.5) 8 (2.1) Non-nodule 1 (0.3) 2 (0.5) 47 (12.5) 12 (3.2) No mark 0 18 (4.8) 14 (3.7) 214 (56.8) Radiologist E Blinded Read Nodule 34 (8.5) 7 (1.7) 7 (1.7) 1 (0.2) Micronodule 0 20 (5.0) 1 (0.2) 0 Non-nodule 0 2 (0.5) 96 (23.9) 11 (2.7) No mark 3 (0.7) 35 (8.7) 54 (13.4) 131 (32.6)
For scans reviewed by each radiologist, the table tracks individual lesions marked by at least one of the four radiologists who reviewed that scan during the blinded or unblinded reads. These lesions are recorded by the lesion category, if any, to which the lesion was assigned during the two reading sessions of the specified radiologist. The numbers in parentheses convert the numbers of lesions to percentages based on all identified lesions in the scans reviewed by the radiologist.
Table 3
Number of Lesions (Across Radiologists) for Which Changes in Lesion Category Occurred Between the Blinded and Unblinded Reads of a Particular Radiologist
Blinded-to-Unblinded Lesion Category Change Number of Radiologist-Lesions Nodule → micronodule 8 Nodule → non-nodule 9 Nodule → no mark 4 Micronodule → non-nodule 9 Micronodule → no mark 30 Non-nodule → no mark 41 micronodule → nodule 4 Non-nodule → nodule 1 Non-nodule → micronodule 5 No mark → nodule 10 No mark → micronodule 149 No mark → non-nodule 191
For example, if two radiologists both assigned the category “nodule” to a specific lesion during their respective blinded reads and then both radiologists changed their assigned category for that lesion to “micronodule” during their respective unblinded reads, then this lesion would be counted twice in the first row of the table. The data presented in this table were extracted from Table 2 .
Get Radiology Tree app to read full this article<
Get Radiology Tree app to read full this article<
Table 4
Total Number of Lesions Marked by Each Radiologist During Blinded and Unblinded Reads Presented by Lesion Category
Nodule Micronodule Non-nodule No Mark Radiologist A Blinded read 40 21 98 179 Unblinded read 42 91 153 52 Radiologist B Blinded read 25 24 66 245 Unblinded read 26 26 70 238 Radiologist C Blinded read 26 126 130 105 Unblinded read 26 123 183 55 Radiologist D Blinded read 24 45 62 246 Unblinded read 27 52 63 235 Radiologist E Blinded read 49 21 109 223 Unblinded read 37 64 158 143
Note that because each case was reviewed by four of the five LIDC radiologists, different subsets of cases were reviewed by different groupings of four radiologists so that no two radiologists reviewed the same subset of cases; therefore, the total number of lesions is not the same across radiologists. The data presented in this table were extracted from Table 3 . The “no mark” category indicates that a radiologist did not mark a lesion that was marked by at least one other radiologist.
Table 5
Agreement (Kappa) Among Pairwise Combinations of Radiologists for the Blinded Reading Phase (First Value) and the Unblinded Reading Phase (Second Value)
Radiologist A B C D E A — 0.36/0.25 (259) 0.20/0.65 (232) 0.31/0.33 (249) 0.32/0.56 (274) B — 0.17/0.26 (281) 0.34/0.36 (271) 0.38/0.29 (296) C — 0.045/0.24 (298) 0.076/0.47 (323) D — 0.30/0.44 (313) E —
The number of lesions in scans reviewed by both radiologists is given in parentheses.
Get Radiology Tree app to read full this article<
Get Radiology Tree app to read full this article<
Get Radiology Tree app to read full this article<
Evaluation of Nodules ≥3 mm
Get Radiology Tree app to read full this article<
Get Radiology Tree app to read full this article<
Get Radiology Tree app to read full this article<
Get Radiology Tree app to read full this article<
Discussion
Get Radiology Tree app to read full this article<
Get Radiology Tree app to read full this article<
Get Radiology Tree app to read full this article<
Get Radiology Tree app to read full this article<
Get Radiology Tree app to read full this article<
Get Radiology Tree app to read full this article<
Get Radiology Tree app to read full this article<
Get Radiology Tree app to read full this article<
Get Radiology Tree app to read full this article<
Get Radiology Tree app to read full this article<
Get Radiology Tree app to read full this article<
Get Radiology Tree app to read full this article<
Get Radiology Tree app to read full this article<
Get Radiology Tree app to read full this article<
Get Radiology Tree app to read full this article<
References
1. Ko J.P.: Lung nodule detection and characterization with multi-slice CT. J Thoracic Imaging 2005; 20: pp. 196-209.
2. Rubin G.D.: 3-D imaging with MDCT. Eur J Radiol 2003; 45: pp. S37-S41.
3. Armato S.G., McLennan G., McNitt-Gray M.F., et. al.: Lung Image Database Consortium: developing a resource for the medical imaging research community. Radiology 2004; 232: pp. 739-748.
4. Clarke L.P., Croft B.Y., Staab E., et. al.: National Cancer Institute initiative: Lung image database resource for imaging research. Acad Radiol 2001; 8: pp. 447-450.
5. Nishikawa R.M., Yarusso L.M.: Variations in measured performance of CAD schemes due to database composition and scoring protocol. SPIE Proc 1998; 3338: pp. 840-844.
6. Department of Health and Human Services: Standards for privacy of individually identifiable health information: final rules. Fed Register 2002; 67: pp. 53182-53272.
7. Dodd L.E., Wagner R.F., Armato S.G., et. al.: Assessment methodologies and statistical issues for computer-aided diagnosis of lung nodules in computed tomography: contemporary research topics relevant to the Lung Image Database Consortium. Acad Radiol 2004; 11: pp. 462-475.
8. Naidich D.P., Rusinek H., McGuinness G., et. al.: Variables affecting pulmonary nodule detection with computed tomography: Evaluation with three-dimensional computer simulation. J Thorac Imaging 1993; 8: pp. 291-299.
9. Gruden J.F., Ouanounou S., Tigges S., et. al.: Incremental benefit of maximum-intensity-projection images on observer detection of small pulmonary nodules revealed by multidetector CT. AJR Am J Roentgenol 2002; 179: pp. 149-157.
10. Rogers S.R., Brown M.S., Goldin J.G., et. al.: Automated lung nodule detection in CT: nodule inclusion criteria for determining ground truth. Radiology 2002; 225: pp. 407.
11. Wormanns D., Ludwig K., Beyer F., et. al.: Detection of pulmonary nodules at multirow-detector CT: effectiveness of double reading to improve sensitivity at standard-dose and low-dose chest CT. Eur Radiol 2005; 15: pp. 14-22.
12. Leader J.K., Warfel T.E., Fuhrman C.R., et. al.: Pulmonary nodule detection with low-dose CT of the lung: Agreement among radiologists. Am J Roentgenol 2005; 185: pp. 973-978.
13. Novak C.L., Qian J., Fan L., et. al.: Inter-observer variations on interpretation of multi-slice CT lung cancer screening studies, and the implications for computer-aided diagnosis. SPIE Proc 2002; 4684: pp. 68-79.
14. Wormanns D., Beyer F., Diederich S., et. al.: Diagnostic performance of a commercially available computer-aided diagnosis system for automatic detection of pulmonary nodules: comparison with single and double reading. Rofo 2004; 176: pp. 953-958.
15. Marten K., Seyfarth T., Auer F., et. al.: Computer-assisted detection of pulmonary nodules: performance evaluation of an expert knowledge-based detection system in consensus reading with experienced and inexperienced chest radiologists. Eur Radiol 2004; 14: pp. 1930-1938.
16. Revesz G., Kundel H.L., Bonitatibus M.: The effect of verification on the assessment of imaging techniques. Invest Radiol 1983; 18: pp. 194-198.
17. Austin J.H.M., Mueller N.L., Friedman P.J., et. al.: Glossary of terms for CT of the lungs: recommendations of the Nomenclature Committee of the Fleischner Society. Radiology 1996; 200: pp. 327-331.
18. Cascade P.N.: The American College of Radiology. Radiology 2000; 214: pp. 3-46.
19. Hillman B.J., Hessel S.J., Swensson R.G., et. al.: Improving diagnostic accuracy: a comparison of interactive and Delphi consultation. Investig Radiol 1977; 12: pp. 112-115.
20. Kundel H.L., Nodine C.F., Carmody D.: Visual scanning, pattern recognition and decision-making in pulmonary nodule detection. Invest Radiol 1978; 13: pp. 175-181.
21. Meyer C.R., Johnson T.D., McLennan G., et. al.: Evaluation of lung MDCT nodule annotations across radiologists and methods. Acad Radiol 2006; 13: pp. 1254-1265.
22. Kung J.W., Matsumoto S., Hasegawa I., et. al.: Mixture distribution analysis of a computer assisted diagnostic method for the evaluation of pulmonary nodules on computed tomography scan. Acad Radiol 2004; 11: pp. 281-285.
23. Potchen E.J., Cooper T.G., Sierra A.E., et. al.: Measuring performance in chest radiography. Radiology 2000; 217: pp. 456-459.
24. Beam C.A., Layde P.M., Sullivan D.C.: Variability in the interpretation of screening mammograms by U.S. radiologists. Arch Intern Med 1996; 156: pp. 209-213.