
Rationale and Objectives
The characterization of payments made to physicians by pharmaceutical companies, device manufacturers, and group purchasing organizations is crucial for assessing potential conflicts of interest and their impact on practice patterns. This study examines the compensation received by general radiologists (GR) in the United States, as well as radiologists in the following five subspecialties: body imaging, neuroradiology, pediatric radiology, nuclear radiology and radiological physics, and vascular and interventional radiology.
Materials and Methods
Data were extracted from the Open Payments database for radiology subspecialists in the United States who received installments in calendar year 2015 from pharmaceutical and device manufacturing companies.
Results
In 2015, a total of $43,685,052 was paid in 65,507 payments (mean $667/payment; median $32/payment) to radiologists, including 9826 GR, 362 body imaging radiologists, 479 neuroradiologists, 127 pediatric radiologists, 175 physicians in nuclear radiology and radiological physics, and 1584 vascular and interventional radiologists. Payments were unequally distributed across these six major subspecialties of radiology ( p < 0.01), with GR receiving the largest number of total payments (44,695), and neuroradiologists receiving significantly higher median payments than any other subspecialty ($80 vs $32 for all radiologists; p < 0.01). Medtronic Neurovascular was the single largest payer to all radiologists combined.
Conclusion
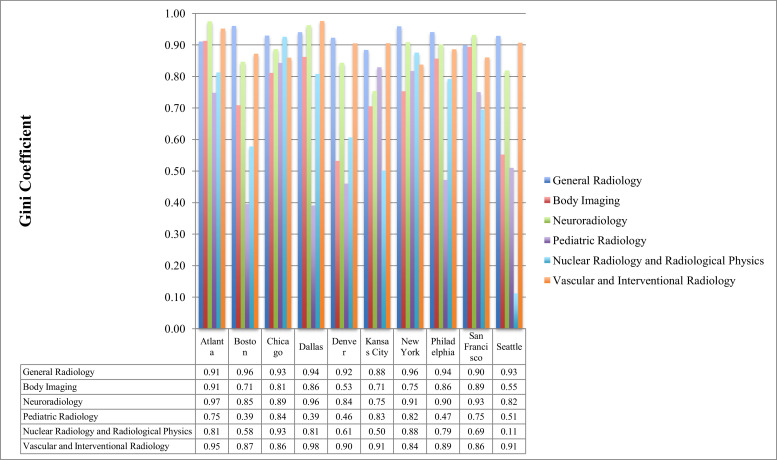
Commercial entities make substantial payments to radiologists, with a significant variation in payments made to the different radiology subspecialties. While the largest number of total payments was made to GGR, the highest median payments were made to neuroradiologists, and significant dispersion in these payments was seen across different geographic regions. The impact of these payments on practice patterns remains to be elucidated.
INTRODUCTION
The 2010 Affordable Care Act included a list of provisions designed to improve transparency of relationships between physicians and industry, namely the Physicians Payment Sunshine Act ( ). This Act mandates that all payments and offerings made by industry to physicians (save for certain exclusions such as sample medications), be reported to the Centers for Medicare and Medicaid Services (CMS), which serves as the central database for the Act ( ). Specifically, manufacturers and medical suppliers must submit all payments >$10 made to physicians to the CMS, at which point physicians have 45 days to submit a dispute ( ). Such payments are tracked by unique provider ID and may include research funding, gifts, consultant fees, or funds allocated for medical education, among others ( ). According to prior reports, as many as 94% of US physicians currently maintain some form of financial relationship with commercial entities ( ).
Driven by public interest for transparency within the healthcare industry, the Sunshine Act helps to identify existing relationships between physicians and industry, and also sheds light on potential conflicts of interest that may exist and what influence, if any, such relationships may have on medical practice patterns ( ). The CMS database is updated yearly and results are made available online, providing public access to any payments made by pharmaceutical companies, device manufacturers, and group purchasing organizations toward physicians and other healthcare providers such as dentists, chiropractors, and podiatrists.
Get Radiology Tree app to read full this article<
Get Radiology Tree app to read full this article<
MATERIALS AND METHODS
Get Radiology Tree app to read full this article<
Get Radiology Tree app to read full this article<
Get Radiology Tree app to read full this article<
Get Radiology Tree app to read full this article<
Get Radiology Tree app to read full this article<
Get Radiology Tree app to read full this article<
Get Radiology Tree app to read full this article<
Table 1
All Payments Made to Individual Physicians within Radiology Subspecialties
Statistics General Radiology (n = 9826) Body Imaging (n = 362) Neuroradiology (n = 479) Pediatric Radiology (n = 127) Nuclear Radiology and Radiological Physics (n = 159) Vascular and Interventional Radiology (n = 1584) All Radiology (n = 12,537) Mean, $ (SD) 525.90 (7261.36) 417.93 (2212.36) 2,397.86 (54,138.31) 306.96 (1,221.78) 338.40 (3,129.62) 681.05 (12,922.15) 666.88 (15,872.81)Median, $29.4623.4780.2945.9827.693531.85 Minimum, $ 0.07 0.36 0.20 1.50 2.60 0.07 0.07 Maximum, $ 640,037.40 31,880 2,934,724 13,600 63,795.30 1,120,699 2,934,724Total, $ (%)24,939,068 (57.1)461,390.11 (1.1)9,788,080.79 (22.4)114,188.04 (0.3)147,205.56 (0.3)8,234,584.13 (18.8)43,685,052.23 (100) IQ1 14.99 14.16 21 16.91 15.48 15.15 15.15 IQ3 110.13 94.72 246.18 114.37 104.83 123.23 117.51 IQR 95.14 80.55 225.18 97.46 89.35 108.08 102.36
Percentage values reflect ratio of payments within a subspecialty to total payments to all radiologists.
Table 2
Single Payments by Dollar Amount within Each Radiology Subspecialty
Dollar Range General Radiology (n = 47,422) Body Imaging (n = 1104) Neuroradiology (n = 4082) Pediatric Radiology (n = 372) Nuclear Radiology and Radiological Physics (n = 435) Vascular and Interventional Radiology (n = 12,091) All Radiology (n = 65,507) <$1000 (%) 44,695 (94.2) 1032 (93.5) 3586 (87.8) 351 (94.4) 416 (95.6) 11,263 (93.2) 61,344 (93.6) $1000–9999 (%) 2392 (5) 60 (5.4) 465 (11.4) 20 (5.4) 18 (4.1) 766 (6.3) 3721 (5.7) $10,000–24,999 (%) 252 (0.5) 9 (0.8) 17 (0.4) 1 (0.3) 0 (0) 38 (0.3) 317 (0.5) >$25,000 (%) 83 (0.2) 3 (0.3) 14 (0.3) 0 (0) 1 (0.2) 24 (0.2) 125 (0.2)
Percentage values reflect ratio of number of payments within a dollar range to total number of payments within each subspecialty.
Table 3
Distribution of Payments by Type within Each Radiology Subspecialty
Category General Radiology Body Imaging Neuroradiology Pediatric Radiology Nuclear Radiology and Radiological Physics Vascular and Interventional Radiology All Radiology Total, $ (%) Maximum, $ Total, $ (%) Maximum, $ Total, $ (%) Maximum, $ Total, $ (%) Maximum, $ Total, $ (%) Maximum, $ Total, $ (%) Maximum, $ Total, $ (%) Maximum, $ Charitable contribution 0 (0) 0 0 (0) 0 0 (0) 0 0 (0) 0 0 (0) 0 2000 (0.02) 2000 2000 (0.02) 2000 Compensation 1 1,755,857 (7) 50,000 38,108 (8.3) 6560 804,653 (8.2) 22,400 5900 (5.2) 4400 18,581 (12.6) 4080 551,648 (6.7) 12,482 3,174,747 (7.3) 50,000 Compensation 2 61,335 (0.2) 14,775 14,700 (3.2) 9500 1551 (0.02) 1551 1500 (1.3) 1500 4110 (2.8) 2610 18,668 (0.2) 4500 101,864 (0.2) 14,775 Compensation 3 116,544 (0.5) 12,000 0 (0) 0 0 (0) 0 0 (0) 0 0 (0) 0 10,800 (0.1) 4000 127,344 (0.3) 12,000 Consulting fee 7,431,480 (29.8) 236,000 293,659 (63.6) 31,880 792,073 (8.1) 18,000 30,633 (26.8) 9900 18,336 (12.5) 6120 1,943,477 (23.6) 36,400 10,509,659 (24.1) 236,000 Current or prospective ownership or investment interest 17,004 (0.1) 10,004 0 (0) 0 0 (0) 0 0 (0) 0 0 (0) 0 3825 (0.05) 3825 20,829 (0.05) 10,004 Education 138,067 (0.6) 6000 3954 (0.9) 1,350.00 8792 (0.1) 6120 13,907 (12.2) 13,600 2052 (1.4) 870 49,659 (0.6) 12,000 216,431 (0.5) 13,600 Entertainment 19,812 (0.1) 719 434 (0.1) 149 2499 (0.03) 259 224 (0.2) 195 98 (0.1) 63 4079 (0.1) 479 27,146 (0.1) 719 Food and beverage 1,873,418 (7.5) 11,693 37,548 (8.1) 1114 115,752 (1.2) 2500 14,453 (12.7) 242 21,333 (14.5) 7327 476,459 (5.8) 11,500 2,538,963 (5.8) 11,693 Gift 13,823 (0.1) 4000 62 (0.01) 62 18 (0.0002) 18 0 (0) 0 0 (0) 0 10.56 (1E−06) 10.56 13,913 (0.03) 4,000 Grant 1,310,449 (5.3) 70,000 23,061 (5) 10,920 149,951 (1.5) 70,000 0 (0) 0 0 (0) 0 686 (0.01) 374 1,484,147 (3.4) 70,000 Honoraria 528,350 (2.1) 39,561 5060 (1.1) 2310 18,079 (0.2) 3250 1000 (0.9) 1000 0 (0) 0 164,588 (2) 24,539 717,077 (1.6) 39,561 Royalty or license 8,780,918 (35.2) 640,037 13,730 (3) 13,730 7,411,483 (75.7) 2,934,724 0 (0) 0 63,795 (43.3) 63,795 4,257,341 (51.7) 1,120,699 20,527,267 (47) 2,934,724 Space or rental fee 0 (0) 0 0 (0) 0 0 (0) 0 0 (0) 0 0 (0) 0 0 (0) 0 0 (0) 0 Travel and lodging 2,892,011 (11.6) 16,810 31,076 2864 483,231 12,248 46,572 (40.8) 8753 18,899 (12.8) 6290 751,344 (9.1) 16,896 4,223,667 (9.7) 16,896
Percentage values reflect the ratio of payments within each type of payment to total number of payments within each subspecialty.
Compensation 1 = for services other than consulting, including serving as faculty or as a speaker at a venue other than a continuing education program.
Compensation 2 = for serving as faculty or as a speaker for a nonaccredited and noncertified continuing education program.
Compensation 3 = for serving as faculty or as a speaker for an accredited or certified continuing education program.
Table 4
Top Three Companies that Paid Compensation to Each Radiology Subspecialty
Subspecialty Top Three Companies Total Amount Paid ($) General radiology Medtronic Neurovascular 2,643,204.23 Medtronic Vascular, Inc. 2,357,063.33 Siemens Medical Solutions USA, Inc. 1,705,662.65 Body imaging Merck Sharp & Dohme Corporation 257,089.98 Siemens Medical Solutions USA, Inc. 32,235.30 Hologic, Inc. 25,739.77 Neuroradiology Medtronic Neurovascular 6,755,853.88 Medtronic Vascular, Inc. 1,273,445.00 Benvenue Medical, Inc 384,162.41 Pediatric radiology Philips Electronics North America Corporation 50,176.25 Cook Incorporated 25,731.62 Siemens Medical Solutions USA, Inc. 16,258.63 Nuclear radiology and radiological physics AngioDynamics, Inc. 63,795.30 Bayer HealthCare Pharmaceuticals Inc. 22,129.74 GE Healthcare 14,225.38 Vascular and interventional radiology Medtronic Neurovascular 2,380,320.98 Medtronic Vascular, Inc. 1,499,558.50 Sirtex Medical Inc. 753,380.86 All radiology Medtronic Neurovascular 11,779,770.42 Medtronic Vascular, Inc. 5,130,465.52 Cook Incorporated 1,984,896.59
Get Radiology Tree app to read full this article<
RESULTS
Get Radiology Tree app to read full this article<
Get Radiology Tree app to read full this article<
Get Radiology Tree app to read full this article<
Get Radiology Tree app to read full this article<
Get Radiology Tree app to read full this article<
DISCUSSION
Get Radiology Tree app to read full this article<
Get Radiology Tree app to read full this article<
Get Radiology Tree app to read full this article<
Get Radiology Tree app to read full this article<
Get Radiology Tree app to read full this article<
Get Radiology Tree app to read full this article<
Get Radiology Tree app to read full this article<
Get Radiology Tree app to read full this article<
Get Radiology Tree app to read full this article<
CONCLUSION
Get Radiology Tree app to read full this article<
Get Radiology Tree app to read full this article<
References
1. Agrawal S., Brennan N., Budetti P.: The Sunshine Act—effects on physicians. N Engl J Med 2013; 368: pp. 2054-2057.
2. Physician financial transparency reports (Sunshine Act). Available at: https://www.ama-assn.org/practice-management/physician-financial-transparency-reports-sunshine-act Accessed March 15, 2018
3. General payment data—detailed dataset 2015 reporting year. Available at: https://openpaymentsdata.cms.gov/browse Accessed October 24, 2017
4. Licurse A., Barber E., Joffe S., et. al.: The impact of disclosing financial ties in research and clinical care: a systematic review. Arch Intern Med 2010; 170: pp. 675-682.
5. Toroser D., Pepitone K.: Two years into the Sunshine Act: synopsis of opportunities, challenges, learnings, and potential implications. Curr Med Res Opin 2016; 32: pp. 1899-1902.
6. Harvey H.B., Alkasab T.K., Pandharipande P.V., et. al.: Non-research-related physician-industry relationships of radiologists in the United States. J Am Coll Radiol 2015; 12: pp. 1142-1150.
7. Kokabi N., Junn J.C., Xing M., et. al.: Nonresearch industry payments to radiologists: characteristics and associations with regional medical imaging utilization. J Am Coll Radiol 2017; 14: pp. 418-425. e2
8. Baadh A.S., Baadh P.K., Islam S., et. al.: IR and the Sunshine Act: two-year analysis of the open payments database and comparison with related specialties. J Vasc Interv Radiol 2017; 28: pp. 200-205.
9. Sudarsky D., Charania J., Inman A., et. al.: The impact of industry representative’s visits on utilization of coronary stents. Am Heart J 2013; 166: pp. 258-265.
10. Duszak R.: The ordering physician rules!. J Am Coll Radiol 2006; 3: pp. 369-371.
11. Bellù L.G., Liberati P.: Policy impacts on inequality: welfare based measures of inequality—the Atkinson index.2006.Food and Agriculture Organization of the United Nationspp. 1.
12. As full disclosure nears, doctors’ pay for drug talks plummets. Available at: https://www.propublica.org/article/as-full-disclosure-nears-doctors-pay-for-drug-talks-plummets Accessed February 11, 2018
13. Rosenkrantz A.B., Hughes D.R., Duszak R.: The U.S. Radiologist Workforce: an analysis of temporal and geographic variation by using large national datasets. Radiology 2016; 279: pp. 175-184.
14. DeJong C., Aguilar T., Tseng C.W., et. al.: Pharmaceutical industry-sponsored meals and physician prescribing patterns for medicare beneficiaries. JAMA Intern Med 2016; 176: pp. 1114-1122.
15. Chimonas S., Brennan T.A., Rothman D.J.: Physicians and drug representatives: exploring the dynamics of the relationship. J Gen Intern Med 2007; 22: pp. 184-190.
16. Hoh B.L., Chi Y.Y., Dermott M.A., et. al.: The effect of coiling versus clipping of ruptured and unruptured cerebral aneurysms on length of stay, hospital cost, hospital reimbursement, and surgeon reimbursement at the University of Florida. Neurosurgery 2009; 64: pp. 614-619. Discussion 619-21
17. Wang C., Ching E.C., Hui F.K.: Aneurysm coil embolization: cost per volumetric filling analysis and strategy for cost reduction. J Neurointerv Surg 2016; 8: pp. 541-543.
18. Chatterji A.K., Fabrizio K.R., Mitchell W., et. al.: Physician-industry cooperation in the medical device industry. Health Aff (Millwood) 2008; 27: pp. 1532-1543.
19. Day A.L., Siddiqui A.H., Meyers P.M., et. al.: Training standards in neuroendovascular surgery: program accreditation and practitioner certification. Stroke 2017; 48: pp. 2318-2325.
20. Kao A.C., Zaslavsky A.M., Green D.C., et. al.: Physician incentives and disclosure of payment methods to patients. J Gen Intern Med 2001; 16: pp. 181-188.
21. Grady C., Horstmann E., Sussman J.S., et. al.: The limits of disclosure: what research subjects want to know about investigator financial interests. J Law Med Ethics 2006; 34: pp. 592-599. 481
22. Tattersall M.H., Dimoska A., Gan K.: Patients expect transparency in doctors’ relationships with the pharmaceutical industry. Med J Aust 2009; 190: pp. 65-68.
23. Santhakumar S., Adashi E.Y.: The Physician Payment Sunshine Act: testing the value of transparency. JAMA 2015; 313: pp. 23-24.