
Rationale and Objectives
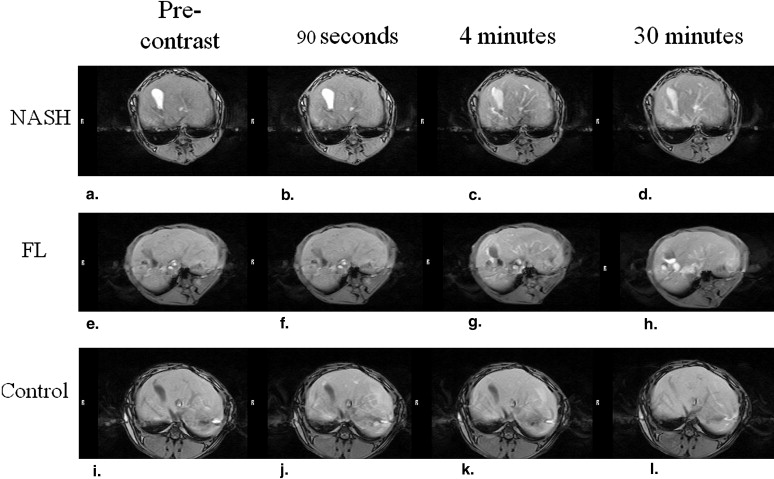
We used rabbits to investigate the possibility of differentiating between nonalcoholic steatohepatitis (NASH) and fatty liver (FL) on scans acquired by open-type‒ and gadolinium-ethoxybenzyl-diethylenetriamine pentaacetic acid (Gd-EOB-DTPA)‒enhanced magnetic resonance imaging (MRI).
Materials and Methods
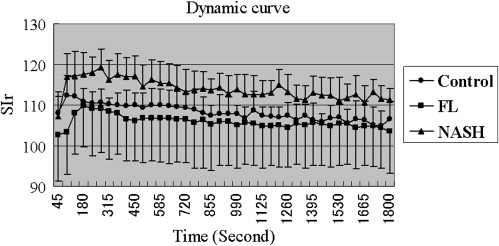
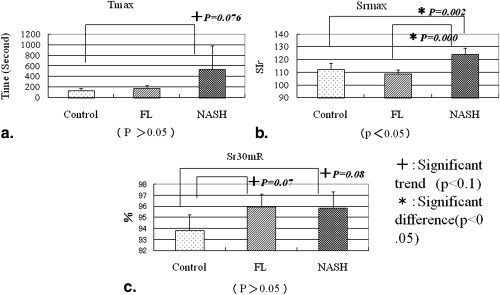
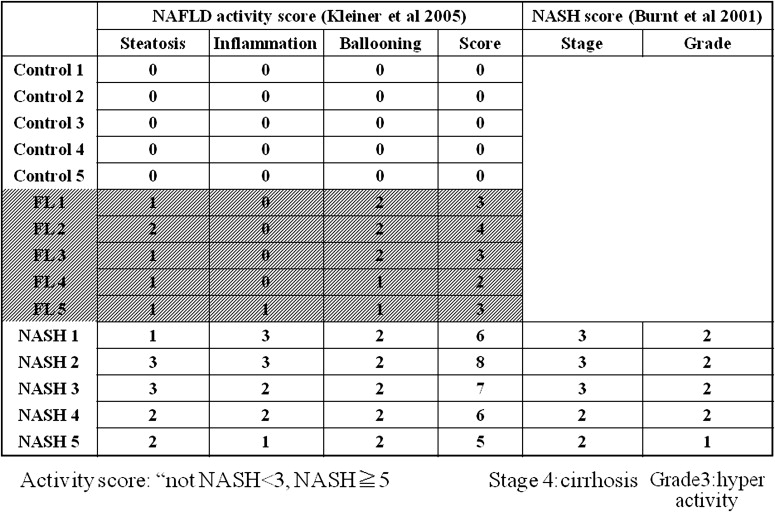
We divided 15 adult rabbits into three equal groups; they received standard (control group), high-fat (FL) content (FL group), or choline-deficient chow (NASH group). With the animals under general anesthesia we acquired scans on an open 0.3-Tesla MRI system. Signal intensity (SI) was measured before and after contrast administration and defined as SI-pre and SI-post, respectively. Relative SI enhancement (Sr) was calculated using the equation: Sr = (average of three SI-post- minus average of three SI values in no-signal fields)/(average of three SI-pre- minus average of three SI values in no-signal fields) × 100. Maximum Sr (Srmax), the time (in seconds) required to reach Srmax (Tmax), and the difference between Srmax and Sr at 30 minutes (Sr 30m R) were analyzed.
Results
Srmax was significantly higher in the NASH rabbits than the other two groups ( P < .05).
Conclusions
In rabbits, the Srmax value made it possible to differentiate NASH from normal and fatty liver.
Nonalcoholic steatohepatitis (NASH) was first named by Ludwig et al to describe biopsy findings in patients with no history of significant alcohol consumption . In autopsy studies performed in the United States, approximately 20% of liver specimens revealed hepatic steatosis and about 3% manifested NASH. NASH has also been reported in children . Approximately 1% of hepatic steatosis advances to NASH and 40% of NASH is considered fibrotic; 3%–10% of cases advance to liver cirrhosis . Therefore, early detection and treatment are important . At present, there are no biochemical diagnostic tests for NASH and biochemical studies may return normal results even in patients with serious liver disease. An unequivocal clinical diagnosis requires liver biopsy .
Criteria for the evaluation of hepatic magnetic resonance imaging (MRI) scans have not been established . In their rat experiments, Tsuda et al used a 1.5 Tesla MRI scanner and gadolinium-ethoxybenzyl-diethylenetriamine pentaacetic acid (Gd-EOB-DTPA), a hepatobiliary contrast agent in rats, to differentiate between NASH and fatty liver (FL). Because different species and MRI scans acquired at different field strengths may affect the results, we subjected rabbits with NASH induced by a choline-deficient diet, rabbits with FL induced by a high-fat diet, and rabbits fed a standard diet to open-type MRI scanning.
Material and methods
Get Radiology Tree app to read full this article<
Rabbit NASH Model
Get Radiology Tree app to read full this article<
MRI
Get Radiology Tree app to read full this article<
Data Analysis
Get Radiology Tree app to read full this article<
Statistical Analysis
Get Radiology Tree app to read full this article<
Histological Analysis
Get Radiology Tree app to read full this article<
Results
MRI
Get Radiology Tree app to read full this article<
Get Radiology Tree app to read full this article<
Sr of the Liver Parenchyma
Get Radiology Tree app to read full this article<
Get Radiology Tree app to read full this article<
Histological Analysis
Get Radiology Tree app to read full this article<
Get Radiology Tree app to read full this article<
Discussion
Get Radiology Tree app to read full this article<
Get Radiology Tree app to read full this article<
Get Radiology Tree app to read full this article<
Get Radiology Tree app to read full this article<
Get Radiology Tree app to read full this article<
Get Radiology Tree app to read full this article<
References
1. Ludwig J., Viggiano T.R., McGill D.B., et. al.: Nonalcoholic steatohepatitis: Mayo Clinic experiences with a hitherto unnamed disease. Mayo Clin Proc 1980; 55: pp. 434-438.
2. Portincasa P., Grattagliano I., Palmieri V.O., et. al.: The emerging problem of nonalcoholic steatohepatitis (NASH). Rom J Gastroenterol 2005; 14: pp. 43-51.
3. Wanless I.R., Lentz J.S.: Fatty liver hepatitis (steatohepatitis) and obesity: an autopsy study with analysis of risk factors. Hepatology 1990; 12: pp. 1106-1110.
4. Lall C.G., Aisen A.M., Bansal N., et. al.: Nonalcoholic fatty liver disease. AJR Am J Roentgenol 2008; 190: pp. 993-1002.
5. Powell E.E., Cooksley W.G., Hanson R., et. al.: The natural history of nonalcoholic steatohepatitis: a follow-up study of forty-two patients for up to 21 years. Hepatology 1990; 11: pp. 74-80.
6. Evans C.D., Oien K.A., MacSween R.N., et. al.: Non-alcoholic steatohepatitis: a common cause of progressive chronic liver injury?. J Clin Pathol 2002; 55: pp. 689-692.
7. Reid A.E.: Nonalcoholic steatohepatitis. Gastroenterology 2001; 121: pp. 710-723.
8. Tsuda N., Okada M., Murakami T.: Potential of gadolinium-ethoxybenzyl-diethylenetriamine pentaacetic acid (Gd-EOB-DTPA) for differential diagnosis of nonalcoholic steatohepatitis and fatty liver in rats using magnetic resonance imaging. Invest Radiol 2007; 42: pp. 242-247.
9. Kleiner D.E., Brunt E.M., Van Natta M., et. al.: Design and validation of a histological scoring system for nonalcoholic fatty liver disease. Hepatology 2005; 41: pp. 1313-1321.
10. Brunt E.M.: Nonalcoholic steatohepatitis. Semin Liver Dis 2004; 24: pp. 3-20.
11. Schwenzer N.F., Springer F., Schraml C., et. al.: Non-invasive assessment and quantification of liver steatosis by ultrasound, computed tomography and magnetic resonance. J Hepatol 2009; 51: pp. 433-445.
12. d’Assignies G., Ruel M., Khiat A., et. al.: Noninvasive quantitation of human liver steatosis using magnetic resonance and bioassay methods. Eur Radiol 2009; 19: pp. 2033-2040.
13. DeLeo M.J., Gounis M.J., Hong B., et. al.: Carotid artery brain aneurysm model: in vivo molecular enzyme-specific MR imaging of active inflammation in a pilot study. Radiology 2009; 252: pp. 696-703.
14. Keilholz S.D., Bozlar U., Fujiwara N., et. al.: MR diagnosis of a pulmonary embolism: comparison of P792 and Gd-DOTA for first-pass perfusion MRI and contrast-enhanced 3D MRA in a rabbit model. Korean J Radiol 2009; 10: pp. 447-454.