
Rationale and Objectives
We sought to assess whether or not prevalence levels affected the confidence ratings of readers during the interpretation of cases in a laboratory receiver operating characteristic−type observer performance study.
Materials and Methods
We reanalyzed a previously conducted observer performance study that included 14 readers and 5 different levels of prevalence. The previous study yielded the observation that in the laboratory we could not detect a “prevalence effect” in terms of differences in areas under the receiver operating characteristic curves. The detection ratings (for presence or absence) of lung nodules, interstitial disease, and pneumothorax for the five prevalence levels were compared, and a test for trend in averaged ratings as a function of abnormality prevalence was performed within a mixed-model setting that accounts for different sources of variability and correlations induced by the study design.
Results
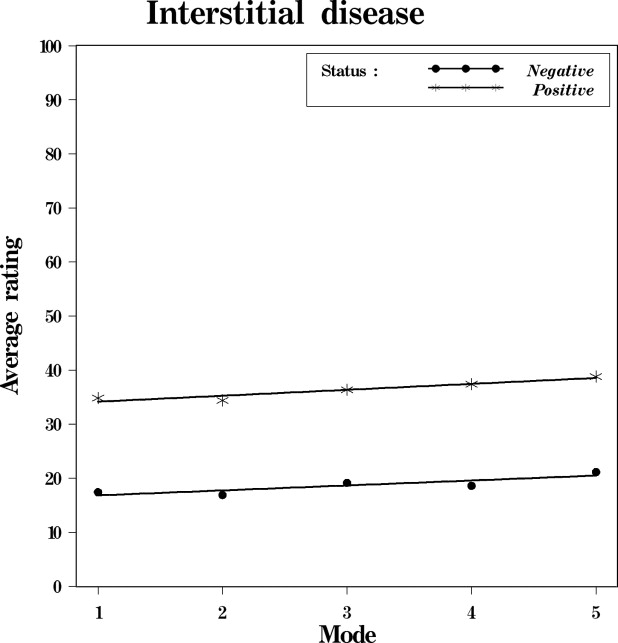
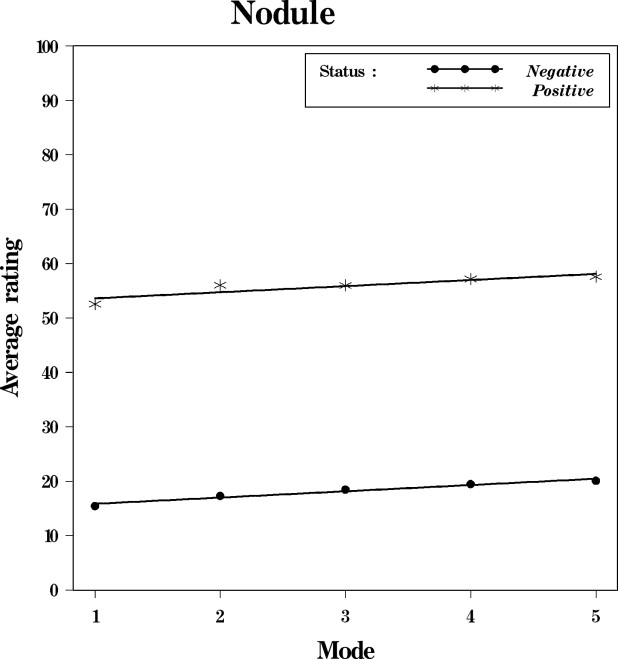
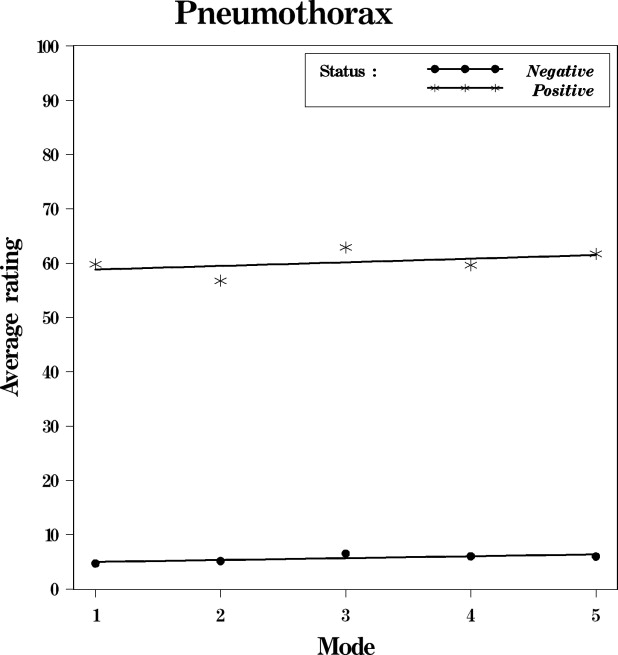
The ratings of the cases in terms of confidence that the specific abnormality in question is present tend, on average, to be larger when actual disease prevalence is lower. The rate of the increase of the average confidence ratings with the decreasing prevalence of a specific abnormality is very similar for actually positive and actually negative cases for every considered abnormality. The observed trend in the changes of the average confidence ratings as a function of prevalence levels was statistically significant (p < 0.01).
Conclusion
Expectations of disease prevalence in the case mix during a laboratory observer performance study may systematically affect the behavior of observers in terms of their actual confidence ratings.
Receiver operating characteristic (ROC)-type studies continue to be the preferred method of assessing performance when the observer is considered an integral part of the diagnostic imaging system. Although ROC methodology has been refined extensively over the years, the issue of the generalizability of study results to the clinical practice remains ( ). One potential bias that we evaluated previously is the possible effect of abnormality prevalence in the study population on observer performance in the laboratory environment. Frequently, laboratory studies include a significantly larger fraction of positive, as well as difficult (subtle), cases than would be observed in a typical clinical practice. To investigate this issue, we had performed a large multiobserver, multiabnormality ROC study to assess if observers’ diagnostic performance was affected at different levels of prevalence ( ). The results of our own study suggested that despite the substantial changes in prevalence levels in the different reading modes, observers’ performance as measured by the area under the ROC curve (AUC) was not significantly affected. Namely, experimentally we did not measure a “prevalence effect.” There is little additional work that has been published on the “prevalence effect” in other fields ( ). Clearly, appropriate changes in confidence ratings are expected when the measured performance level changes as well ( ). However, there are no published observations regarding shifts in confidence ratings during changes in prevalence levels that result in comparable performance. Since our original study used AUC as the primary index (measure) of performance and we assessed AUC as a function of prevalence levels, we did not analyze at the time whether or not observers changed their actual rating patterns in terms of their recorded confidence ratings and, if they did, whether or not the ratings changed in a systematic manner.
Intuitively, one might expect that for higher prevalence levels observers would rate all cases as “more” positive for a variety of reasons and one could simulate how an ideal observer would be expected to behave under this scenario. In this study, we analyzed a series of datasets from our own “prevalence effect” study to search for consistent patterns in observers’ ratings, if any.
Materials and methods
Original Study
Get Radiology Tree app to read full this article<
Get Radiology Tree app to read full this article<
Analyses
Get Radiology Tree app to read full this article<
Get Radiology Tree app to read full this article<
Get Radiology Tree app to read full this article<
Results
Get Radiology Tree app to read full this article<
Table 1
Average Confidence Ratings Over All Readers for the Highest and the Lowest Prevalence Modes for the Three Abnormalities of Interest
Abnormality Mode Prevalence Level Actually Negative Cases Actually Positive Cases Interstitial disease 1 28% 17.41 34.83 Nodule 1 21% 15.42 52.57 Pneumothorax 1 21% 4.69 59.81 Interstitial disease 5 3% 21.14 38.83 Nodule 5 2% 20.07 57.60 Pneumothorax 5 2% 6.00 61.74
Get Radiology Tree app to read full this article<
Get Radiology Tree app to read full this article<
Get Radiology Tree app to read full this article<
Get Radiology Tree app to read full this article<
Table 2
Number of Readers With Increasing Trends in Confidence Ratings With Decreasing Prevalence Levels
Abnormality Actually Negative Cases (%) ⁎ Actually Positive Cases (%) ⁎ Interstitial 12 (86) 10 (71) Nodule 13 (93) 9 (64) Pneumothorax 8 (57) 10 (71)
Get Radiology Tree app to read full this article<
Get Radiology Tree app to read full this article<
Discussion
Get Radiology Tree app to read full this article<
Get Radiology Tree app to read full this article<
Get Radiology Tree app to read full this article<
Get Radiology Tree app to read full this article<
Acknowledgment
Get Radiology Tree app to read full this article<
Get Radiology Tree app to read full this article<
References
1. Dorfman D.D., Berbaum K.S., Metz C.E.: Receiver operating characteristic rating analysis: Generalization to the population of readers and patients with the jackknife method. Invest Radiol 1992; 27: pp. 723-731.
2. Roe C.A., Metz C.E.: Variance-component modeling in the analysis of receiver operating characteristic index estimates. Acad Radiol 1997; 4: pp. 587-600.
3. Beiden S.V., Wagner R.F., Campbell G.: Components-of-variance models and multiple-bootstrap experiments: An alternative method for random-effects, receiver operating characteristic analysis. Acad Radiol 2000; 7: pp. 341-349.
4. Beiden S.V., Wagner R.F., Campbell G., Metz C.E., Jiang Y.: Components-of-variance models for random-effects ROC analysis: The case of unequal variance structures across modalities. Acad Radiol 2001; 8: pp. 605-615.
5. Beiden S.V., Wagner R.F., Campbell G., Chan H.P.: Analysis of uncertainties in estimates of components of variance in multivariate ROC analysis. Acad Radiol 2001; 8: pp. 616-622.
6. Gur D., Rockette H.E., Armfield D.R., et. al.: Prevalence effect in a laboratory environment. Radiology 2003; 228: pp. 10-14.
7. Wolfe J.M., Horowitz T.S., Kenner N.M.: Cognitive psychology: Rare items often missed in visual searches. Nature 2005; 435: pp. 439-440.
8. Egglin T.K., Feinstein A.R.: Context bias. JAMA 1996; 276: pp. 1752-1755.
9. Gur D., Rockette H.E., Warfel T., Lacomis J.M., Fuhrman C.R.: From the laboratory to the clinic: The “prevalence effect.”. Acad Radiol 2003; 10: pp. 1324-1326.