
Rationale and Objectives
In this paper we examine which comparisons of reading performance between diagnostic imaging systems made in controlled retrospective laboratory studies may be representative of what we observe in later clinical studies. The change in a meaningful diagnostic figure of merit between two diagnostic modalities should be qualitatively or quantitatively comparable across all kinds of studies.
Materials and Methods
In this meta-study we examine the reproducibility of relative measures of sensitivity, false positive fraction (FPF), area under the receiver operating characteristic (ROC) curve, and expected utility across laboratory and observational clinical studies for several different breast imaging modalities, including screen film mammography, digital mammography, breast tomosynthesis, and ultrasound.
Results
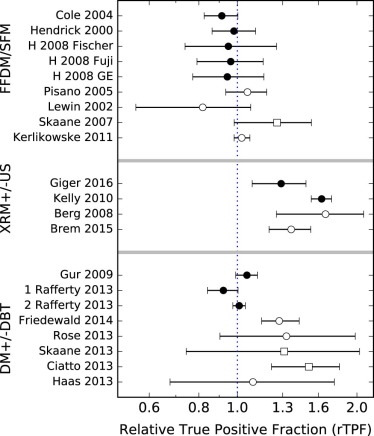
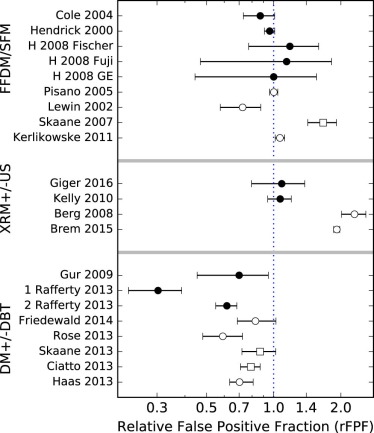
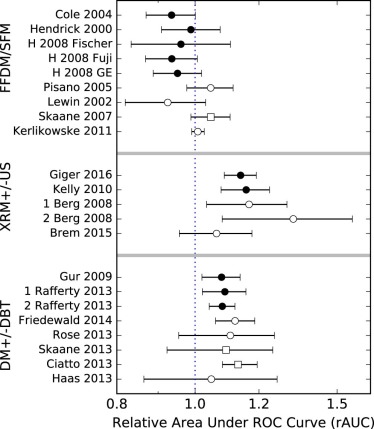
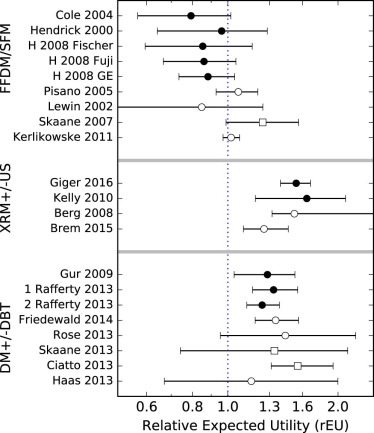
Across studies of all types, the changes in the FPFs yielded very small probabilities of having a common mean value. The probabilities of relative sensitivity being the same across ultrasound and tomosynthesis studies were low. No evidence was found for different mean values of relative area under the ROC curve or relative expected utility within any of the study sets.
Conclusion
The comparison demonstrates that the ratios of areas under the ROC curve and expected utilities are reproducible across laboratory and clinical studies, whereas sensitivity and FPF are not.
Introduction
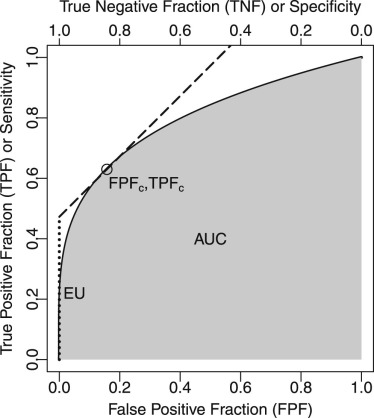
Studies of reader performance play an important role in evaluations of the effectiveness of new diagnostic imaging devices and methodologies . These studies are particularly common in applications where a diagnostic task can be simplified to a binary choice, as in breast cancer screening where the goal is to identify abnormalities for subsequent analysis. From this perspective, the screening examination sorts the cases into “negative” and “positive” categories. Binary tasks are commonly characterized by a receiver operating characteristic (ROC) curve, which plots true positive fraction (TPF; the fraction of disease cases correctly labeled positive) as a function of the false positive fraction (FPF; the fraction of nondisease cases incorrectly labeled as positive). The ROC curve serves as the underlying framework from which various figures of merit (FOMs) of imaging performance can be defined.
Before using a new diagnostic imaging modality in clinical practice, a laboratory reader study of the modality may be performed to determine its diagnostic effectiveness for regulatory purposes or to demonstrate its capabilities for the medical community. Often this study will compare the performance of the new modality in one study arm to the standard of care in a control arm . These preclinical reader studies differ from clinical trials in a number of ways that make the studies far less time-consuming and costly. They generally require a much smaller sample of patient examinations, which limits the potential for side effects of imaging, including exposure to ionizing radiation or intravenous contrast agents. In imaging tasks that have low disease prevalence, for example, asymptomatic breast-cancer screening, the patient sample is usually enriched with cases of disease through various possible sampling strategies . Other differences may include limited access to additional clinical data (prior examinations, patient symptoms, or history), a different reporting format that may include nonstandard measures such as a probability of malignancy rating, and use of retrospective data that results in a lack of direct consequences for patient management.
Get Radiology Tree app to read full this article<
Get Radiology Tree app to read full this article<
Get Radiology Tree app to read full this article<
Get Radiology Tree app to read full this article<
Get Radiology Tree app to read full this article<
Get Radiology Tree app to read full this article<
Materials and Methods
Get Radiology Tree app to read full this article<
Get Radiology Tree app to read full this article<
Get Radiology Tree app to read full this article<
Get Radiology Tree app to read full this article<
Get Radiology Tree app to read full this article<
EU=TPFc−β×FPFc EU
=
TPF
c
−
β
×
FPF
c
where TPF c and FPF c are the TPF and FPF on a reader’s ROC curve where the slope of the curve is β . Based on the clinical practice of mammography, Abbey et al. determined that the average value of β is approximately 1.03 for breast cancer screening in the United States. Figure 1 shows EU graphically as an intercept of a line with slope β that is tangent to the diagnostic test’s ROC curve at the optimal or clinical TPF, FPF operating point.
Get Radiology Tree app to read full this article<
Relative Statistics
Get Radiology Tree app to read full this article<
Get Radiology Tree app to read full this article<
Get Radiology Tree app to read full this article<
Get Radiology Tree app to read full this article<
Get Radiology Tree app to read full this article<
Get Radiology Tree app to read full this article<
Get Radiology Tree app to read full this article<
Get Radiology Tree app to read full this article<
Get Radiology Tree app to read full this article<
Get Radiology Tree app to read full this article<
Relative Statistics in Studies with Partial Disease Confirmation
Get Radiology Tree app to read full this article<
Get Radiology Tree app to read full this article<
rTPF=TPFATPFB=TPA/MTPB/M=TPATPB. rTPF
=
TPF
A
TPF
B
=
TP
A
/
M
TP
B
/
M
=
TP
A
TP
B
.
Get Radiology Tree app to read full this article<
Get Radiology Tree app to read full this article<
Get Radiology Tree app to read full this article<
Get Radiology Tree app to read full this article<
Estimating Variability in Imaging Studies
Get Radiology Tree app to read full this article<
Get Radiology Tree app to read full this article<
Get Radiology Tree app to read full this article<
Get Radiology Tree app to read full this article<
Get Radiology Tree app to read full this article<
Imaging Studies
Get Radiology Tree app to read full this article<
Get Radiology Tree app to read full this article<
Table 1
Studies That Compared Full-field Digital Mammography (FFDM) Against Screen Film Mammography (SFM)
Study References Notes Type of Study Number of Patients Prevalence Number of Readers Notes on Analyses Cole et al. Fischer FDA app. Lab 247 0.45 8 BCD Hendrick et al. GE FDA app. Lab 625 0.07 5 CD Hendrick et al. Fischer FFDM Lab 115 0.37 6 CD Hendrick et al. Fuji FFDM Lab 98 0.28 12 CD Hendrick et al. GE FFDM Lab 120 0.40 12 CD Pisano et al. DMIST Clinic 42,760 0.006 160 ACD Lewin et al. Clinic 6736 0.006 ACD Skaane et al. Oslo II, Euro Clinic 23,929 0.005 8 AC Kerlikowske et al. BCSC Clinic 329,261 0.005 ~800 C
A, studies that did not include sites or readers as random effects; AUC, area under the receiver operating characteristic curve; B, studies that did not include sites or readers as random effects, but where we recalculated the errors; BCSC, Breast Cancer Surveillance Consortium; C, studies that followed patients or used retrospective case selection, so disease prevalence was known; Clinic, prospective clinical study; D, studies that reported AUC values; DMIST, Digital Mammographic Imaging Screening Trial; Euro, European studies; FDA, Food and Drug Administration; FDA app., data from the study were part of an FDA Device Approval Application; FFDM, full-field digital mammography; Lab, retrospective laboratory reader study.
Get Radiology Tree app to read full this article<
Get Radiology Tree app to read full this article<
Table 2
Studies That Compared X-ray Mammography with Breast Ultrasound (XRM+US) Against X-ray Mammography Alone (XRM) on Women with Dense Breasts
Study References Notes Type of Study Number of Patients Prevalence Number of Readers Notes on Analyses Giger et al. ABUS FDA app. Lab 185 0.28 17 CD Kelly et al. AWBU Lab 102 0.50 12 CD Berg et al. ACRIN 6666 Clinic 2637 0.015 >21 CD Brem et al. SomoInsight Clinic 15,318 (0.01) 39 A
A, studies that did not include sites or readers as random effects; ABUS, automated breast ultrasound system; ACRIN, American College of Radiology Imaging Network; AUC, area under the receiver operating characteristic curve; AWBU, automated whole-breast ultrasound; C, studies that followed patients or used retrospective case selection, so disease prevalence was known; Clinic, prospective clinical study; D, studies that reported AUC values; FDA app., data from the study were part of an FDA Device Approval Application; Lab, retrospective laboratory reader study.
Prevalence values in parentheses were assumed values.
Get Radiology Tree app to read full this article<
Get Radiology Tree app to read full this article<
Table 3
Studies That Compared Digital Mammography and Hologic Breast Tomosynthesis (DM+DBT) Against Digital Mammography Alone (DM)
Study References Notes Type of Study Number of Patients Prevalence Number of Readers Notes on Analyses Gur et al. FDA app. Lab 125 0.28 8 CD Rafferty et al. FDA app. Lab 312 0.15 12 CD Rafferty et al. FDA app. Lab 312 0.16 15 CD Rose et al . Clinic 23,355 (0.0064) 6 B Friedewald et al. Clinic 454,850 (0.0064) 139 B Skaane et al. OTST, Euro Clinic 12,621 0.0096 8 BC Ciatto et al. STORM, Euro Clinic 7292 (0.0095) 8 A Haas et al. Clinic 13,158 (0.0095) 8 A
A, studies that did not include sites or readers as random effects; AUC, area under the receiver operating characteristic curve; B, studies that did not include sites or readers as random effects, but where we recalculated the errors; C, studies that followed patients or used retrospective case selection, so disease prevalence was known; Clinic, prospective clinical study; D, studies that reported AUC values; Euro, European studies; FDA app., data from the study were part of an FDA Device Approval Application; Lab, retrospective laboratory reader study; OTST, Oslo Tomosynthesis Screening Trial; STORM, Screening with Tomosynthesis OR standard Mammography.
Prevalence values in parentheses were assumed values.
Get Radiology Tree app to read full this article<
Get Radiology Tree app to read full this article<
Results
Get Radiology Tree app to read full this article<
Get Radiology Tree app to read full this article<
Get Radiology Tree app to read full this article<
Get Radiology Tree app to read full this article<
Get Radiology Tree app to read full this article<
Table 4
Probabilities That the Mean Measured Relative Statistic From All Studies of a Modality Are Consistent with a Common Mean Value Based on an Approximate χ 2 Test
rTPF rFPF rAUC rEU FFDM/SFM studies 0.17 <10 −4 \* 0.04 0.09 US/XRM studies 0.003 <10 −4 0.39 0.09 DBT/DM studies <10 −4 <10 −4 0.87 0.77
DBT, digital breast tomosynthesis; DM, digital mammography; FFDM, full-field digital mammography; rAUC, relative area under the receiver operating characteristic curve; rEU, relative expected utility; rFPF, relative false positive fraction; rTPF, relative true positive fraction; SFM, screen film mammography; US, ultrasound; XRM, X-ray mammography.
These probabilities were calculated for each figure of merit and modality, and no corrections for multiple comparisons were performed. Value with may be underestimated.
Get Radiology Tree app to read full this article<
Get Radiology Tree app to read full this article<
Get Radiology Tree app to read full this article<
Get Radiology Tree app to read full this article<
Get Radiology Tree app to read full this article<
Get Radiology Tree app to read full this article<
Get Radiology Tree app to read full this article<
Get Radiology Tree app to read full this article<
Get Radiology Tree app to read full this article<
Discussion
Get Radiology Tree app to read full this article<
Get Radiology Tree app to read full this article<
If primary studies provide only sufficient information to estimate sensitivity and specificity, the mean sensitivity and the mean specificity can be estimated, possibly weighted in some way for the sample size of each study. However, this technique is inappropriate because it is likely that different studies use different explicit or implicit thresholds, so that a primary study with a high sensitivity may have a low specificity and vice versa.
Get Radiology Tree app to read full this article<
Get Radiology Tree app to read full this article<
Get Radiology Tree app to read full this article<
Get Radiology Tree app to read full this article<
Get Radiology Tree app to read full this article<
Get Radiology Tree app to read full this article<
Get Radiology Tree app to read full this article<
Conclusions
Get Radiology Tree app to read full this article<
Get Radiology Tree app to read full this article<
Acknowledgments
Get Radiology Tree app to read full this article<
Get Radiology Tree app to read full this article<
References
1. Swets J.A., Pickett R.M.: Evaluation of diagnostic systems: methods from signal detection theory.1982.Academic PressNew York
2. Metz C.E., Wagner R.F., Doi K., et. al.: Toward consensus on quantitative assessment of medical imaging systems. Med Phys 1995; 22: pp. 1057-1061.
3. Gur D., Rockette H.E., Warfel T., et. al.: From the laboratory to the clinic: the prevalence effect. Acad Radiol 2003; 10: pp. 1324-1326.
4. Metz C.E.: ROC analysis in medical imaging: a tutorial review of the literature. Radiol Phys Technol 2008; 1: pp. 2-12.
5. Gallas B.D., Chan H.-P., DOrsi C.J., et. al.: Evaluating imaging and computer-aided detection and diagnosis devices at the FDA. Acad Radiol 2012; 19: pp. 463-477.
6. Obuchowski N.A.: Receiver operating characteristic curves and their use in radiology. Radiology 2003; 229: pp. 3-8.
7. Greiner M., Pfeiffer D., Smith R.D.: Principles and practical application of the receiver-operating characteristic analysis for diagnostic tests. Prev Vet Med 2000; 45: pp. 23-41.
8. Begg C.B.: Experimental design of medical imaging trials. Issues and options. Invest Radiol 1989; 24: pp. 934-936.
9. Pinsky P.F., Gallas B.: Enriched designs for assessing discriminatory performance—analysis of bias and variance. Stat Med 2012; 31: pp. 501-515.
10. Hilden J.: The area under the ROC curve and its competitors. Med Decis Making 1991; 11: pp. 95-101.
11. Moons K.G., Stijnen T., Michel B.C., et. al.: Application of treatment thresholds to diagnostic-test evaluation: an alternative to the comparison of areas under receiver operating characteristic curves. Med Decis Making 1997; 17: pp. 447-454.
12. Hilden J.: Evaluation of diagnostic tests—the schism. Soc Med Decis Making Newslett 2004; 4: pp. 5-6.
13. Gur D., Bandos A.I., Rockette H.E., et. al.: Is an ROC-type response truly always better than a binary response in observer performance studies?. Acad Radiol 2010; 17: pp. 639-645.
14. Hand D.J., Anagnostopoulos C.: When is the area under the receiver operating characteristic curve an appropriate measure of classifier performance?. Pattern Recognit Lett 2013; 34: pp. 492-495.
15. Halligan S., Altman D.G., Mallett S.: Disadvantages of using the area under the receiver operating characteristic curve to assess imaging tests: a discussion and proposal for an alternative approach. Eur Radiol 2015; 25: pp. 932-939.
16. Skaane P., Niklason L.: Receiver operating characteristic analysis: a proper measurement for performance in breast cancer screening?. AJR Am J Roentgenol 2006; 354: pp. 579-580.
17. Pepe M.S.: The statistical evaluation of medical tests for classification and prediction.2003.Oxford University PressOxford
18. Zhou X., McClish D., Obuchowski N.: Statistical methods in diagnostic medicine.Wiley Series in Probability and Statistics2009.Wiley
19. Begg C.B.: Biases in the assessment of diagnostic tests. Stat Med 1987; 6: pp. 411-423.
20. Metz C.E.: Basic principles of ROC analysis. Semin Nucl Med 1978; 7: pp. 283-298.
21. Hanley J.A., McNeil B.J.: The meaning and use of the area under the receiver operating characteristic (ROC) curve. Radiology 1982; 143: pp. 29-36.
22. Metz C.E.: ROC methodology in radiologic imaging. Invest Radiol 1986; 21: pp. 720-733.
23. Patton D.D., Woolfenden J.M.: A utility-based model for comparing the cost-effectiveness of diagnostic studies. Invest Radiol 1989; 24: pp. 263-271.
24. Schisterman E.F., Perkins N.J., Liu A., et. al.: Optimal cut-point and its corresponding Youden Index to discriminate individuals using pooled blood samples. Epidemiology 2005; 16: pp. 73-81.
25. Halpern E.J., Albert M., Krieger A.M., et. al.: Comparison of receiver operating characteristic curves on the basis of optimal operating points. Acad Radiol 1996; 3: pp. 245-253.
26. Abbey C.K., Eckstein M.P., Boone J.M.: Estimating the relative utility of screening mammography. Med Decis Making 2013; 33: pp. 510-520.
27. Abbey C.K., Gallas B.D., Boone J., et. al.: Comparative statistical properties of expected utility and area under the ROC curve for laboratory studies of observer performance. Acad Radiol 2014; 21: pp. 481-490.
28. Jiang Y., Metz C.E., Nishikawa R.M.: A receiver operating characteristic partial area index for highly sensitive diagnostic tests. Radiology 1996; 201: pp. 745-750.
29. Yankaskas B.C., Cleveland R.J., Schell M.J., et. al.: Association of recall rates with sensitivity and positive predictive values of screening mammography. AJR Am J Roentgenol 2001; 177: pp. 543-549.
30. Ma H., Bandos A.I., Rockette H.E., et. al.: On use of partial area under the ROC curve for evaluation of diagnostic performance. Stat Med 2013; 32: pp. 3449-3458.
31. Keilwagen J., Grosse I., Grau J.: Area under precision-recall curves for weighted and unweighted data. PLoS ONE 2014; 9: e92209
32. Bunch P.C., Hamilton J.F., Sanderson G.K., et. al.: A free-response approach to the measurement and characterization of radiographic observer performance. J Appl Photogr Eng 1978; 3: pp. 166-171.
33. Chakraborty D.P.: Maximum likelihood analysis of free-response receiver operating characteristic (FROC) data. Med Phys 1989; 16: pp. 561-568.
34. Swensson R.G.: Unified measurement of observer performance in detecting and localizing target objects on images. Med Phys 1996; 23: pp. 1709-1725.
35. Zheng B., Chakraborty D.P., Rockette H.E., et. al.: A comparison of two data analyses from two observer performance studies using Jackknife ROC and JAFROC. Med Phys 2005; 32: pp. 1031-1034.
36. Chakraborty D.P.: Validation and statistical power comparison of methods for analyzing free-response observer performance studies. Acad Radiol 2008; 15: pp. 1554-1566.
37. Popescu L.M.: Nonparametric signal detectability evaluation using an exponential transformation of the FROC curve. Med Phys 2011; 38: pp. 5690-5702.
38. National Academies of Sciences, Committee on Applied and Theoretical Statistics. : Statistical challenges in assessing and fostering the reproducibility of scientific results: summary of a workshop.2016.National Academies Press
39. Schatzkin A., Connor R.J., Taylor P.R., et. al.: Comparing new and old screening tests when a confirmatory procedure cannot be performed on all screens. Am J Epidemiol 1987; 125: pp. 672-678.
40. Samuelson F.W., Abbey C.K.: Using relative statistics and approximate disease prevalence to compare screening tests. Int J Biostat 2016; 12: pii: /j/ijb.2016.12.issue-2/ijb-2016-0017/ijb-2016-0017.xml
41. Abbey C.K., Eckstein M.P., Boone J.M.: An equivalent relative utility metric for evaluating screening mammography. Med Decis Making 2010; 30: pp. 113-122.
42. Tanner W.P., Swets J.A.: A decision-making theory of visual detection. Psychol Rev 1954; 61: pp. 401-409.
43. Gur D., Bandos A.I., Fuhrman C.R., et. al.: The prevalence effect in a laboratory environment: changing the confidence ratings. Acad Radiol 2007; 14: pp. 49-53.
44. Samuelson F.W.: Inference based on diagnostic measures from studies of new imaging devices. Acad Radiol 2013; 20: pp. 816-824.
45. Rafferty E.A., Park J.M., Philpotts L.E., et. al.: Assessing radiologist performance using combined digital mammography and breast tomosynthesis compared with digital mammography alone: results of a multicenter, multireader trial. Radiology 2013; 266: pp. 104-113.
46. Dorfman D.D., Alf E.: Maximum likelihood estimation of parameters of signal detection theory and determination of confidence intervals–rating method data. J Math Psychol 1969; 6: pp. 487.
47. Metz C.E.: Statistical analysis of ROC data in evaluating diagnostic performance.Herbert D.Myers R.Multiple regression analysis: applications in the health sciences.1986.American Institute of PhysicsNew York:pp. 365.
48. Egan J.P.: Signal detection theory and ROC analysis.1975.Academic PressNew York
49. Samuelson F.W., He X.: A comparison of semi-parametric ROC models on observer data. SPIE J Med Imag 2014; 1: pp. 031004.
50. Pisano E.D., Gatsonis C., Hendrick E., et. al.: Diagnostic performance of digital versus film mammography for breast-cancer screening. N Engl J Med 2005; 353: pp. 1773-1783.
51. Rosenberg R.D., Yankaskas B.C., Abraham L.A., et. al.: Performance benchmarks for screening mammography. Radiology 2006; 241: pp. 55-66.
52. Dorfman R.: A note on the δ-method for finding variance formulae. Biom Bull 1938; 1: pp. 129-137.
53. Cràmer H.: Mathematical methods of statistics.1946.Princeton University PressPrinceton, NJ
54. Kerlikowske K., Hubbard R.A., Miglioretti D.L., et. al.: Comparative effectiveness of digital versus film-screen mammography in community practice in the United States: a cohort study. Ann Intern Med 2011; 155: pp. 493-502.
55. Cole E., Pisano E.D., Brown M., et. al.: Diagnostic accuracy of Fischer Senoscan Digital Mammography versus screen-film mammography in a diagnostic mammography population. Acad Radiol 2004; 11: pp. 879-886.
56. Fischer Imaging Corporation : Summary of safety and effectiveness data, P010017. Tech. rep., Fischer Imaging Corporation; Available at: http://www.accessdata.fda.gov/cdrh_docs/pdf/P010017b.pdf Accessed June 21, 2017
57. Hendrick R.E., Lewin J.M., Orsi C.J.D., et. al.: Non-inferiority study of FFDM in an enriched diagnostic cohort: comparison with screen-film mammography in 625 women.Yaffe M.J.5th International Workshop on Digital Mammography.2000.pp. 475-481.
58. GE Medical Systems : Summary of safety and effectiveness data, P990066. Tech. rep., GE Medical Systems; Available at: http://www.accessdata.fda.gov/cdrh_docs/pdf/P990066B.pdf Accessed June 21, 2017
59. Hendrick R.E., Cole E.B., Pisano E.D., et. al.: Accuracy of soft-copy digital mammography versus that of screen-film mammography according to digital manufacturer: ACRIN DMIST retrospective multireader study. Radiology 2008; 247: pp. 38-48.
60. Lewin J.M., Orsi C.J.D., Hendrick R.E., et. al.: Clinical comparison of full-field digital mammography and screen-film mammography for detection of breast cancer. AJR Am J Roentgenol 2002; 179: pp. 671-677.
61. Skaane P., Hofvind S., Skjennald A.: Randomized trial of screen-film versus full-field digital mammography with soft-copy reading in population-based screening program: follow-up and final results of Oslo II study. Radiology 2007; 244: pp. 708-717.
62. Giger M.L., Inciardi M.F., Edwards A., et. al.: Automated breast ultrasound in breast cancer screening of women with dense breasts: reader study of mammography-negative and mammography-positive cancers. AJR Am J Roentgenol 2016; 206: pp. 1341-1350.
63. U-Systems Inc. : Summary of safety and effectiveness data, P110006. Tech. rep., U-Systems Inc.; Available at: http://www.accessdata.fda.gov/cdrh_docs/pdf11/P110006b.pdf Accessed June 21, 2017
64. Kelly K.M., Dean J., Lee S.J., et. al.: Breast cancer detection: radiologists’ performance using mammography with and without automated whole-breast ultrasound. Eur Radiol 2010; 20: pp. 2557-2564.
65. Berg W.A., Blume J.D., Cormack J.B., et. al.: Combined screening with ultrasound and mammography vs mammography alone in women at elevated risk of breast cancer. J Am Med Assoc 2008; 299: pp. 2151-2163.
66. Brem R.F., Tabár L., Duffy S.W., et. al.: Assessing improvement in detection of breast cancer with three-dimensional automated breast ultrasound in women with dense breast tissue: the SomoInsight study. Radiology 2015; 274: pp. 663-673.
67. Gur D., Abrams G.S., Chough D.M., et. al.: Digital breast tomosynthesis: observer performance study. AJR Am J Roentgenol 2009; 193: pp. 586-591.
68. Hologic Inc. : Summary of safety and effectiveness data, P080003. Tech. rep., Hologic Inc.; Available at: http://www.accessdata.fda.gov/cdrh_docs/pdf8/P080003B.pdf Accessed June 21, 2017
69. Rose S.L., Tidwell A.L., Bujnoch L.J., et. al.: Implementation of breast tomosynthesis in a routine screening practice: an observational study. AJR Am J Roentgenol 2013; 200: pp. 1401-1408.
70. Friedewald S.M., Rafferty E.A., Rose S.L., et. al.: Breast cancer screening using tomosynthesis in combination with digital mammography. J Am Med Assoc 2014; 311: pp. 2499-2507.
71. Skaane P., Bandos A.I., Gullien R., et. al.: Comparison of digital mammography alone and digital mammography plus tomosynthesis in a population-based screening program. Radiology 2013; 267: pp. 47-56.
72. Ciatto S., Houssami N., Bernardi D., et. al.: Integration of 3D digital mammography with tomosynthesis for population breast-cancer screening (STORM): a prospective comparison study. Lancet Oncol 2013; 14: pp. 583-589.
73. Haas B.M., Kalra V., Geisel J., et. al.: Comparison of tomosynthesis plus digital mammography and digital mammography alone for breast cancer screening. Radiology 2013; 269: pp. 694-700.
74. Irwig L., Tosteson A.N., Gatsonis C., et. al.: Guidelines for meta-analyses evaluating diagnostic tests. Ann Intern Med 1994; 120: pp. 667-676.
75. Dunn O.J.: Multiple comparisons among means. J Am Stat Assoc 1961; 56: pp. 52-74.
76. Gur D.: Imaging technology and practice assessment studies: importance of the baseline or reference performance level. Radiology 2008; 247: pp. 8-11.
77. Shen F., Clarkson E.: Using Fisher information to approximate ideal observer performance on detection tasks for lumpy-background images. J Opt Soc Am A Opt Image Sci Vis 2006; 23: pp. 2406-2414.