
Rationale and Objectives
We sought to derive normative reference values for the thoracic great vessels using multidetector computed tomography (MDCT) in a healthy normotensive non-obese population free of cardiovascular disease.
Materials and Methods
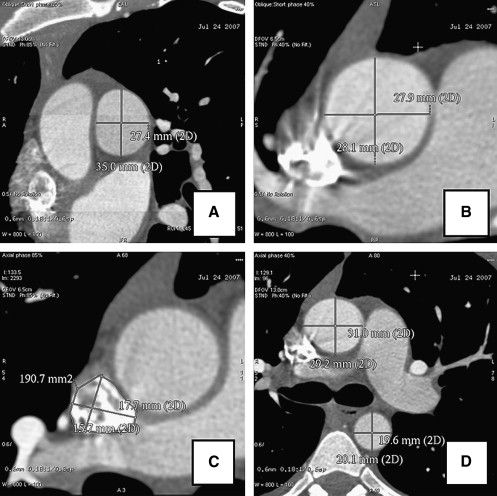
Non-gated axial computed tomography (CT) of the chest has traditionally been used to evaluate normal great vessel anatomy for prognosis and management. However, non-gated axial chest CT cannot account for the obliquity, systolic expansion, and non-axial motion of the great vessels during the cardiac cycle and may misclassify patients as normal or abnormal for prognostic and management purposes. To date, normative reference values for double-oblique, short-axis great vessel diameters have not been established using current generation electrocardiogram (ECG)-gated 64-detector row MDCT. A total of 103 (43% women, age 51 ± 14 years) consecutive normotensive, non-obese adults free of cardiopulmonary or great vessel structural disease, arrhythmias, or significant coronary artery disease were studied by MDCT. Individuals underwent examination for determination of end-diastolic (ED) pulmonary artery (PA) and superior vena cava (SVC) dimensions in double-oblique short axes for comparison with the ascending aorta and the right-sided cardiac chambers.
Results
For right sided great vessels, the 5th to 95th interval was 1.89–3.03 cm for ED PA diameter and 1.08–4.42 cm 2 for SVC cross-sectional area. The pulmonary artery to ascending aortic (PA-to-Ao) ratio was 0.66–1.13. In multivariate analysis, the PA was significantly associated with weight, whereas the PA-to-Ao ratio was inversely associated with age. Axial PA measurements were significantly higher and PA-to-Ao measurements significantly lower than corresponding short axis measurements ( P = .04 and P < .001, respectively).
Conclusions
This study establishes ECG-gated MDCT reference values for right-sided great vessel dimensions derived from a healthy population of individuals free of cardiovascular disease, hypertension, and obesity. The traditional axial PA-to-Ao discriminant value of 1 for pulmonary hypertension is a poor diagnostic tool because it encompasses normal patients and is negatively affected by age. Thoracic great vessels should be measured by CT in ECG-gated double-oblique short-axis for accurate quantitation. These data may serve as a reference to identify right-sided great vessel pathology in individuals being referred for ECG-gated MDCT imaging.
The normal right-sided cardiac chambers and great vessels form a thin-walled, compliant, and low-pressure system highly subject to cardiac and respiratory variations in pressure gradients. Historically, the right-sided great vessels have been evaluated by non-gated axial chest computed tomography (CT) and compared to other local landmarks such as the ascending aorta . However the obliquity, systolic expansion, and non-axial motion of the great vessels during the cardiac cycle distort non-gated axial CT measurements. Electrocardiogram (ECG)-gated multidetector CT (MDCT) provides potential advantages for evaluation of the great vessels with true three-dimensional imaging and reformation of vascular structures in true double-oblique short axis—rather than axial—views at specific points during the cardiac cycle.
To date, normative reference values for ECG-gated true double-oblique short-axis measures of thoracic great vessel anatomy have not been established for MDCT. MDCT normal values cannot be derived from reference values for echocardiography or cardiac magnetic resonance imaging because of intrinsic differences in image acquisition, temporal and spatial resolution, and signal-to-noise levels. Use of axial CT standards not based on a vessel’s true short axis or use of extrapolated standards from cardiac magnetic resonance imaging or echocardiography in MDCT may misclassify patients as normal versus abnormal for prognostic and management purposes.
Get Radiology Tree app to read full this article<
Materials and methods
Population
Get Radiology Tree app to read full this article<
Get Radiology Tree app to read full this article<
Cardiac MDCT Angiography
Get Radiology Tree app to read full this article<
Get Radiology Tree app to read full this article<
Great Vessel Measurements
Get Radiology Tree app to read full this article<
Get Radiology Tree app to read full this article<
Get Radiology Tree app to read full this article<
Get Radiology Tree app to read full this article<
Get Radiology Tree app to read full this article<
Right Ventricular and Atrial Measurements
Get Radiology Tree app to read full this article<
Statistics
Get Radiology Tree app to read full this article<
Results
Baseline Characteristics
Get Radiology Tree app to read full this article<
Table 1
Baseline Characteristics
n = 103 Mean SD Age 51.1 13.6 Female (%) 42.7 Weight (kg) 74.8 13.5 Height (cm) 172.5 10.2 Body mass index (kg/m 2 ) 25.0 2.9 Body surface area (m 2 ) 1.89 0.22 Diabetes (%) 1.9% Dyslipidemia (%) 36.9% Current smoker (%) 8.8% Coronary artery calcium score (Agatston method) 32.3 71.9
Get Radiology Tree app to read full this article<
Pulmonary Artery
Get Radiology Tree app to read full this article<
Table 2
Normal Ranges of Right-sided Great Vessel Measurements
Mean (SD) Short-axis pulmonary artery (PA) diameter, averaged (cm) 2.5 (1.9–3) PA averaged, indexed to body surface area (BSA) (cm/m 2 ) 1.32 (0.94–1.70) PA diameter, anteroposterior (cm) 2.6 (2–3.2) PA diameter, lateral (cm) 2.4 (1.7–3) Superior vena cava (SVC), minor axis (cm) 1.7 (1–2.4) SVC, major axis (cm) 2.1 (1.5–2.8) SVC area, planimetry (cm 2 ) 2.74 (1.08–4.41) SVC area, indexed to BSA (cm/m 2 ) 1.46 (0.63–2.29) Short axis PA-to-aorta ratio 0.89 (0.66–1.13)
Table 3
Association of Pulmonary Artery (PA), Ascending Aorta (Ascending Ao), and Relative Ratio (PA-to-Ao Ratio) with Right Ventricular and Anthropometric Variables
PA (cm) Ascending Ao (cm) PA to Ao Ratio Univariate_P_ Multivariate_P_ Univariate_P_ Multivariate Univariate_P_ Multivariate_P_ Per decade 0.01 (−0.03–0.06) NS 0.13 (0.08–0.18) .001 0.16 (0.12–0.21) 0.001 −0.04 (−0.06– −0.03) .001 −.04 (−0.06– −0.03) .001 Male sex −0.003 (−0.12–0.12) NS 0.01 (−0.008–0.18) NS −0.03 (−0.15–0.08) NS Per 10 cm height 0.06 (0–0.11) .06 0.005 (−0.02–0.12) NS −0.02 (−0.07–0.03) NS Per 10 kg weight 0.06 (0.001–0.01) .01 0.06 (0.001, 0.01) .012 0.07 (0.02–0.12) .01 0 (−0.03–0.03) NS BSA (per m 2 ) 0.33 (0.07–0.60) .01 0.40 (0.08–0.73) .01 0.72(0.44–0.99) 0.001 −0.006 (−0.02–0.01) NS RVEDV (per mL) 0.001 (0–0.002) NS N/A N/A 0 (−0.001–0.001) NS RVESV (per mL) 0.002 (0–0.004) NS N/A N/A 0 (−0.001–0) NS RVSV (per mL) 0.002 (0–0.004) .09 N/A N/A 0 (−0.001–0.001) NS
BSA, body surface area; RVEDV, right ventricular end-diastolic volume; RVESV, right ventricular end systolic volume; RVSV, right ventricular stroke volume.
Get Radiology Tree app to read full this article<
Pulmonary Artery-to-Aorta Ratio
Get Radiology Tree app to read full this article<
Get Radiology Tree app to read full this article<
SVC
Get Radiology Tree app to read full this article<
Table 4
Association of Superior Vena Caval (SVC) Area with Right-sided Chambers and Anthropometric Variables
SVC Cross-sectional Area (cm 2 ) Univariate_P_ Multivariate_P_ Per decade 0.08 (−0.04–0.21) NS Male sex 0.18 (−0.16–0.52) NS Per 10 cm height 0.18 (0.02–0.27) .06 Per 10 kg weight 0.14 (0.02–0.27) .01 0.06 (0.001–0.01) .012 BSA (per m 2 ) 0.92 (0.16–1.67) .01 RVEDV (per mL) 0.005 (0.001–0.008) NS RVESV (per ml) 0.006 (0–0.012) NS RVSV (per ml) 0.008 (0.001–0.014) .09 RAESV (per ml) 0.011 (0.005–0.016) .001 0.011 (0.005–0.016) .001
BSA, body surface area; RVEDV, right ventricular end diastolic volume; RVESV, right ventricular end systolic volume; RVSV, right ventricular stroke volume; RAESV, right atrial end-systolic volume; NS, not significant.
Get Radiology Tree app to read full this article<
Discussion
Get Radiology Tree app to read full this article<
PA Size and PA-to-Ao Ratio
Get Radiology Tree app to read full this article<
Get Radiology Tree app to read full this article<
SVC
Get Radiology Tree app to read full this article<
Clinical Implications
Get Radiology Tree app to read full this article<
Get Radiology Tree app to read full this article<
Considerations for Use of MDCT for Right-sided Great Vessels
Get Radiology Tree app to read full this article<
Get Radiology Tree app to read full this article<
Get Radiology Tree app to read full this article<
Get Radiology Tree app to read full this article<
Limitations
Get Radiology Tree app to read full this article<
Get Radiology Tree app to read full this article<
Summary
Get Radiology Tree app to read full this article<
References
1. Edwards PD., Bull RK., Coulden R.: CT measurement of main pulmonary artery diameter. Br J Radiol 1998; 71: pp. 1018-1020.
2. Ng C.S., Wells A.U., Padley S.P.: A CT sign of chronic pulmonary arterial hypertension: the ratio of main pulmonary artery to aortic diameter. J Thorac Imaging 1999; 14: pp. 270-278.
3. Min J.K., Shaw L.J., Devereux R.B., et. al.: Prognostic value of multidetector coronary CT angiography for prediction of all-cause mortality. J Am Coll Card 2007; 50: pp. 1161-1170.
4. Lin F.Y., Devereux R.B., Roman M.J., et. al.: Cardiac chamber volumes, function and mass by 64-detector row computed tomography: age- and gender-specific values among healthy adults free of hypertension and obesity. J Am Coll Cardiol Img 2008; 1: pp. 782-786.
5. Mclelland R.L., Chung H., Detrano R., et. al.: Distribution of coronary artery calcium by race, gender, and age: results from the Multi-Ethnic Study of Atherosclerosis (MESA). Circulation 2006; 16: pp. 2341-2349.
6. Cheong B., Flamm S.D.: Use of electrocardiographic gating in computed tomography angiography of the ascending thoracic aorta. J Am Coll Cardiol 2007; 49: pp. 1751.
7. Haimovici J.B., Trotman-Dickenson B., Halpern E.F., et. al.: Relationship between pulmonary artery diameter at computed tomography and pulmonary artery pressures at right-sided heart catheterization. Acad Radiol 1997; 4: pp. 327-334.
8. Raptopoulos V.: Computer tomography of the superior vena cava. Crit Rev Diagn Imaging 1986; 25: pp. 373-429.
9. Nguyen E.T., Silva C.I., Seely J.M., et. al.: Pulmonary artery aneurysms and pseudoaneurysms in adults: findings at CT and radiography. Am J Roentgenol 2007; 188: pp. W126-W134.
10. Castañer E., Gallardo X., Rimola J., et. al.: Congenital and acquired pulmonary artery anomalies in the adult: radiologic overview. Radiographics 2006; 26: pp. 349-371.
11. Wilson L.D., Detterbeck F.C., Yahalom J.: Clinical practice. Superior vena cava syndrome with malignant causes. N Engl J Med 2007; 356: pp. 1862-1869.
12. Tzifa A., Marshall A.C., McElhinney D.B., et. al.: Endovascular treatment for superior vena cava occlusion or obstruction in a pediatric and young adult population: a 22-year experience. J Am Coll Cardiol 2007; 49: pp. 1003-1009.
13. Quanadli S.D., El Hajjam El., Mesurolle B., et. al.: Motion artifacts of the aorta simulating aortic dissection on spiral CT. J Comput Assist Tomogr 1999; 23: pp. 1-6.
14. Duvernoy O., Coulden R., Ytterberg C.: Aortic motion: a potential pitfall in CT imaging of dissection in the ascending aorta. J Comput Assist Tomogr 1995; 19: pp. 569-572.
15. Ko S.F., Hsieh M.J., Chen M.C., et. al.: Effects of heart rate on motion artifacts of the aorta on non-ECG-assisted 0.5-sec thoracic MDCT. AJR Am J Roentgenol 2005; 184: pp. 1225-1230.
16. Tamborini G., Galli C.A., Maltagliati A., et. al.: Comparison of feasibility and accuracy of transthoracic echocardiography versus computed tomography in patients with known ascending aortic aneurysm. Am J Cardiol 2006; 98: pp. 966-969.
17. Dinsmore R.E., Liberthson R.R., Wismer G.L., et. al.: Magnetic resonance imaging of thoracic aortic aneurysms: comparison with other imaging methods. AJR Am J Roentgenol 1986; 146: pp. 309-314.
18. Jaffer F.A., O’Donnell C.J., Larson M.G., et. al.: Age and sex distribution of subclinical aortic atherosclerosis: a magnetic resonance imaging examination of the Framingham Heart Study. Arterioscler Thromb Vasc Biol 2002; 22: pp. 849-854.
19. Li A.E., Kamel I., Rando F., et. al.: Using MRI to assess aortic wall thickness in the multiethnic study of atherosclerosis: distribution by race, sex, and age. AJR Am J Roentgenol 2004; 182: pp. 593-597.
20. Devereux R.B., Lutas E.M., Casale P.N., et. al.: Standardization of M-mode echocardiographic left ventricular anatomic measurements. J Am Coll Cardiol 1984; 4: pp. 1222-1230.