
Rationale and Objectives
Ultrasonography (US) is becoming popular for the assessment of adiposity, but no one has studied this tool in the light of its potential limitations. Our purpose was to investigate the impact of technical conditions on the evaluation of abdominal fat by US.
Materials and Methods
Forty-five healthy males and 45 healthy females were consecutively enrolled in the study, randomly assigned to three groups equally distributed by sex, and examined accordingly to three technical points: fasting state (before and after meal [A]), breathing (expiration and inspiration [B]), and US equipment from different generations: 2003 and 1998 (C). Two blinded radiologists performed US in the these opposite conditions, acquiring five parameters representative of subcutaneous and visceral adiposity in two times. Student’s t -test and Lin’s correlation coefficient were used for statistical analysis to assess differences in the measures as well as in inter- and intra-observer agreements.
Results
The maximum and the only statistically significant changes were observed for intra-abdominal fat thickness regarding fasting state and breathing (Δ% = 24.1 ± 21.3 and Δ% = 9.2 ± 20.4, respectively; P < .0001). Reproducibility and repeatability, especially for visceral fat, were proved more stable in the following conditions: fasting state, expiration, and newer machine (2003).
Conclusion
This article provides essential information and “range of confidence” for variations that can be expected from using different conditions in the measurement of abdominal adiposity by US to be carefully addressed as well as considered by US users and by researchers involving this technique in the field of body composition.
Adipose tissue is one of the most enigmatic components of the body. Evaluation and quantification of adipose tissue are fundamental in the field of body composition as well as body composition is crucial for understanding human and animal metabolism and its alterations .
Imaging has been essential in bringing body composition analysis to a clinical ground. In clinical practice, one of the most used techniques to assess the organ-tissue level of body composition is ultrasonography (US). This technique has demonstrated satisfying results in terms of accuracy and reproducibility .
Get Radiology Tree app to read full this article<
Get Radiology Tree app to read full this article<
Table 1
Methods and Technical Issues of the Principal Articles Measuring Visceral Fat Thickness with US Between 2001 and 2011
Author Publication Fasting Condition Breath Condition Anatomical Landmarks of Visceral Fat US Equipment Emmons RR, Ultrasound Med Biol (2011) Not declared Upon exhalation From the linea alba to the anterior aorta GE Logiq Book XP (GE Healthcare, Buckinghamshire, UK) Oh J, Ultrasound Med Biol (2011) After fasting at least for 4 hours Immediately After expiration From the anterior wall of the aorta to the internal face of the rectus abdominis muscle Prosound a10 (Aloka, Tokyo, Japan) De Lucia Rolfe E, Obesity (2010) Refrain from eating 10 hours before At the end of a quiet expiration From the peritoneal boundary to the corpus of the lumbar vertebra Logic Book XP ultrasound (GE Healthcare, Bedford, UK) Gradmark AM, Br J Nutr (2010) Fasting state Hold breath during mid-inspiration From the inside of the bowel wall to the spine Acuson Sequoia, (Siemens, Mountain Woods, California) Bartha JL, Obesity (2007) Fasting state Immediately at the end of expiration From the anterior wall of the aorta to the internal layer of the rectoabdominal muscle Esaote Technos MPX (Esaote S.p.A., Genova, Italy) Koda M, Abdom Imaging (2007) Fasting overnight Not declared From the internal face of the rectus abdominis muscle (linea alba) to the anterior wall of the vertebra at the level of the umbilicus Aloka SSD-2000 (Aloka, Tokyo, Japan) Guldiken S, Int J Clin Pract (2006) Not declared Breath-hold From the internal face of the abdominal muscle to the anterior wall of the aorta Sonoline Elegra, (Siemens Medical Solutions, Inc., Issaquah, Washington) Kim SK, Am J Clin Nutr (2004) Not declared Immediately after respiration From the anterior wall of the aorta to the internal face of the rectoabdominal muscle SA 9900 (Medison, Seoul, Korea) Ribeiro-Filho FF, Obes Res (2003) Fasting state Not declared From the internal face of rectoabdominal muscle to the anterior wall of the aorta Not declared Leite CC, Metabolism (2002) Not declared Not declared From the internal face of the abdominal muscles to the posterior wall of the aorta Toshiba Sonolayer
SSA-250 A (Otawara Shi, Tochigiken, Japan) Stolk RP, Int J Obes Relat Metab Disord (2001) Not declared At the end of a quiet expiration From the posterior edge of the abdominal muscles to the lumbar spine or psoas muscles ATL HDI 3000 system (Bothell, Washington) Sabir N, Eur J Ultrasound (2001) Not declared Breath-hold From the internal face of the abdominal muscle to the anterior wall of the aorta. GE logiq 200
Get Radiology Tree app to read full this article<
Get Radiology Tree app to read full this article<
Materials and methods
Study Design and Population
Get Radiology Tree app to read full this article<
Get Radiology Tree app to read full this article<
Get Radiology Tree app to read full this article<
Get Radiology Tree app to read full this article<
Ultrasound Methods
Get Radiology Tree app to read full this article<
Get Radiology Tree app to read full this article<
Get Radiology Tree app to read full this article<
Get Radiology Tree app to read full this article<
Get Radiology Tree app to read full this article<
Statistical Analysis
Get Radiology Tree app to read full this article<
Get Radiology Tree app to read full this article<
Get Radiology Tree app to read full this article<
Results
Descriptive Statistics
Get Radiology Tree app to read full this article<
Table 2
Ultrasound Values, Delta (Δ), and Delta Percentage (Δ%) in Group A (Abdominal Distension), Group B (Respiration), and Group C (Equipment)
Abdominal Distension Respiration Equipment Pre-m (mm)
Mean ± SD
min/max Post-m (mm)
Mean ± SD
min/max Δ (mm)
Mean ± SD
min/max Δ% (%)
Mean ± SD
min/max Exp (mm)
Mean ± SD
min/max Insp (mm)
Mean ± SD
min/max Δ (mm)
Mean ± SD
min/max Δ% (%)
Mean ± SD
min/max E 1 (mm)
Mean ± SD
min/max E 2 (mm)
Mean ± SD
min/max Δ (mm)
Mean ± SD
min/max Δ% (%)
Mean ± SD
min/max MinSFT 7.6 ± 3.4 7.6 ± 2.9 0.0 ± 1.8 1.0 ± 22.8 5.7 ± 2.7 5.8 ± 2.4 0.1 ± 1.1 0.6 ± 20.2 8.6 ± 3.0 8.4 ± 2.8 −0.1 ± 0.9 −3.6 ± 11.4 3.7/14.6 3.0/14.7 −3.7/7.7 −54.4/53.4 5.8/12.6 2.7/10.3 −3.2/3.0 −34.0/42.2 3.1/15.9 3.4/15.2 −2.2/2.0 −30.5/13.4 MaxPFT 14.3 ± 4.2 15.0 ± 4.9 0.8 ± 1.7 4.8 ± 12.5 13.9 ± 3.7 13.6 ± 3.9 −0.3 ± 2.2 −4.2 ± 15.2 14.5 ± 5.2 13.5 ± 5.1 −1.0 ± 2.4 −10.2 ± 20.4 5.3/22.4 5.5/21.9 −3.2/6.2 −20.3/40.2 7.9/21.8 7.9/21.2 −3.9/5.9 −40.3/27.8 5.3/22.4 5.0/21.3 −10.5/1.1 −68.2/5.6 MaxSFT upper 18.8 ± 7.2 18.8 ± 7.1 0.0 ± 2.1 0.4 ± 11.5 16.7 ± 6.0 16.2 ± 6.2 −0.5 ± 1.8 −4.1 ± 11.4 19.5 ± 7.9 19.2 ± 8.0 −0.2 ± 2.5 −2.2 ± 16.5 6.9/31.4 6.5/29.0 −6.0/5.8 −32.3/31.5 7.0/27.1 6.2/26.8 −3.2/3.8 −27.4/16.3 7.9/31.5 6.9/29.5 −8.7/3.5 −65.9/16.6 MaxSFT lower 19.7 ± 9.1 20.1 ± 9.0 0.4 ± 2.2 4.0 ± 13.9 18.1 ± 7.3 17.6 ± 7.6 −0.5 ± 1.9 −4.6 ± 11.8 21.1 ± 8.9 21.9 ± 9.8 0.8 ± 2.9 6.0 ± 15.6 5.6/40.8 6.9/39.0 −4.2/7.3 −18.8/42.6 8.7/34.3 6.5/33.1 −5.4/3.4 −10.6/26.3 5.7/40.8 7.6/41.8 −7.7/7.3 −37.0/34.1 IFT 47.4 ∗ ± 17.3 56.9 ∗ ± 15.2 9.5 ± 8.1 24.1 ± 21.3 38.0 ∗ ± 9.9 43.6 ∗ ± 12.8 5.6 ± 8.2 9.2 ± 20.4 50.9 ± 14.1 51.3 ± 16.0 0.4 ± 4.1 0.1 ± 10.2 27.3/92.4 35.9/95.6 −14.2/25.6 −15.3/73.7 21.9/59.1 20.3/75.1 −11.2/15.2 −31.4/42.6 31.4/82.1 27.3/88.4 −8.6/9.6 −27.3/26.0
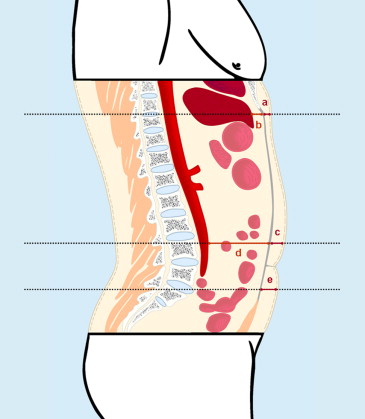
E 1, equipment 1; E 2, equipment 2; exp, expiration; IFT, intra-abdominal fat thickness; insp, inspiration; max, maximum; MaxPFT, maximum preperitoneal fat thickness; MaxSFT lower , maximum subcutaneous fat thickness 2 cm underneath the umbilicus; MaxSFT upper , maximum subcutaneous fat thickness 2 cm above the umbilicus; min, minimum; MinSFT, minimum subcutaneous fat thickness; pre-m, premeal; post-m, postmeal.
Get Radiology Tree app to read full this article<
Get Radiology Tree app to read full this article<
Group A
Get Radiology Tree app to read full this article<
Get Radiology Tree app to read full this article<
Group B
Get Radiology Tree app to read full this article<
Group C
Get Radiology Tree app to read full this article<
Analysis of Reliability
Get Radiology Tree app to read full this article<
Table 3
Reproducibility of Sonographic Measurements in Group A (Abdominal Distension), Group B (Respiration), and Group C (Equipment)
Abdominal Distension Respiration Equipment Premeal Postmeal Expiration Inspiration Equipment 1 Equipment 2 MinSFT 0.86 0.83 0.92 ∗ 0.86 ∗ 0.87 0.81 MaxPFT 0.82 0.85 0.83 ∗ 0.78 ∗ 0.84 0.81 MaxSFT upper 0.90 0.94 0.95 0.95 0.94 0.93 MaxSFT lower 0.91 0.93 0.94 0.91 0.92 0.94 IFT 0.92 ∗ 0.85 ∗ 0.91 ∗ 0.86 ∗ 0.95 † 0.87 †
IFT, intra-abdominal fat thickness; MaxPFT, maximum preperitoneal fat thickness; MaxSFT upper , maximum subcutaneous fat thickness 2 cm above the umbilicus; MaxSFT lower , maximum subcutaneous fat thickness 2 cm underneath the umbilicus; MinSFT, minimum subcutaneous fat thickness.
Get Radiology Tree app to read full this article<
Get Radiology Tree app to read full this article<
Table 4
Repeatability of Sonographic Measurements in Group A (Abdominal Distension), Group B (Respiration), and Group C (Equipment)
Abdominal Distension Respiration Equipment Operator 1 Operator 2 Operator 1 Operator 2 Operator 1 Operator 2 Premeal Postmeal Premeal Postmeal Expiration Inspiration Expiration Inspiration Equipment 1 Equipment 2 Equipment 1 Equipment 2 MinSFT 0.91 ∗ 0.84 ∗ 0.91 ∗ 0.97 ∗ 0.95 † 0.89 † 0.95 0.97 0.91 ∗ 0.86 ∗ 0.92 ∗ 0.87 ∗ MaxPFT 0.92 † 0.79 † 0.93 ∗ 0.98 ∗ 0.87 0.86 0.95 0.96 0.92 † 0.77 † 0.93 0.94 MaxSFT upper 0.87 ∗ 0.93 ∗ 0.97 0.96 0.94 0.91 0.96 0.96 0.97 0.96 0.95 0.96 MaxSFT lower 0.95 0.97 0.98 0.96 0.94 0.94 0.99 0.97 0.95 0.98 0.96 0.95 IFT 0.90 0.90 0.98 ∗ 0.94 ∗ 0.96 † 0.87 † 0.96 0.95 0.95 † 0.86 † 0.98 ∗ 0.94 ∗
IFT, intra-abdominal fat thickness; MaxPFT, maximum preperitoneal fat thickness; MaxSFT upper , maximum subcutaneous fat thickness 2 cm above the umbilicus; MaxSFT lower , maximum subcutaneous fat thickness 2 cm underneath the umbilicus; MinSFT, minimum subcutaneous fat thickness.
Get Radiology Tree app to read full this article<
Get Radiology Tree app to read full this article<
Get Radiology Tree app to read full this article<
Reproducibility
Get Radiology Tree app to read full this article<
Repeatability
Get Radiology Tree app to read full this article<
Get Radiology Tree app to read full this article<
Discussion
Get Radiology Tree app to read full this article<
Get Radiology Tree app to read full this article<
Get Radiology Tree app to read full this article<
Get Radiology Tree app to read full this article<
Get Radiology Tree app to read full this article<
Get Radiology Tree app to read full this article<
Get Radiology Tree app to read full this article<
Get Radiology Tree app to read full this article<
Get Radiology Tree app to read full this article<
Get Radiology Tree app to read full this article<
Get Radiology Tree app to read full this article<
Get Radiology Tree app to read full this article<
Get Radiology Tree app to read full this article<
Get Radiology Tree app to read full this article<
Get Radiology Tree app to read full this article<
Get Radiology Tree app to read full this article<
Get Radiology Tree app to read full this article<
Get Radiology Tree app to read full this article<
Acknowledgment
Get Radiology Tree app to read full this article<
References
1. Heymsfield S.B., Baumgartner R.M., Allison D.B., et. al.: Evaluation of total and regional adiposity.Bray G.A.Bouchard C.Handbook of obesity: clinical applications.2005.Marcel DekkerNew York:pp. 33-79.
2. Vlachos I.S., Hatziioannou A., Perelas A., et. al.: Sonographic assessment of regional adiposity. AJR Am J Roentgenol 2007; 189: pp. 1545-1553.
3. Armellini F., Zamboni M., Rigo L., et. al.: The contribution of sonography to the measurement of intra-abdominal fat. J Clin Ultrasound 1990; 18: pp. 563-567.
4. Armellini F., Zamboni M., Robbi R., et. al.: Total and intra-abdominal fat measurements by ultrasound and computerized tomography. Int J Obes Relat Metab Disord 1993; 17: pp. 209-214.
5. Tornaghi G., Raiteri R., Pozzato C., et. al.: Anthropometric or ultrasonic measurements in assessment of visceral fat? A comparative study. Int J Obes Relat Metab Disord 1994; 18: pp. 771-775.
6. Stolk R.P., Wink O., Zelissen P.M., et. al.: Validity and reproducibility of ultrasonography for the measurement of intra-abdominal adipose tissue. Int J Obes Relat Metab Disord 2001; 25: pp. 1346-1351.
7. Hirooka M., Kumagi T., Kurose K., et. al.: A technique for the measurement of visceral fat by ultrasonography: comparison of measurements by ultrasonography and computed tomography. Intern Med 2005; 44: pp. 794-799.
8. Gradmark A.M., Rydh A., Renstrom F., et. al.: Computed tomography-based validation of abdominal adiposity measurements from ultrasonography, dual-energy x-ray absorptiometry and anthropometry. Br J Nutr 2010; 104: pp. 582-588.
9. Bazzocchi A., Filonzi G., Ponti F., et. al.: Accuracy, reproducibility and repeatability of ultrasonography in the assessment of abdominal adiposity. Acad Radiol 2011; 18: pp. 1133-1143.
10. Abe T., Kawakami Y., Sugita M., et. al.: Use of B-mode ultrasound for visceral fat mass evaluation: comparisons with magnetic resonance imaging. Appl Human Sci 1995; 14: pp. 133-139.
11. Emmons R.R., Garber C.E., Cirnigliaro C.M., et. al.: Assessment of measures for abdominal adiposity in persons with spinal cord injury. Ultrasound Med Biol 2011; 37: pp. 734-741.
12. Despres J.P., Lemieux S., Lamarche B., et. al.: The insulin resistance dyslipidemic syndrome: contribution of visceral obesity and therapeutic implications. Int J Obes Relat Metab Disord 1995; 19: pp. S76-S86.
13. Wajchenberg B.L.: Subcutaneous and visceral adipose tissue: their relation to the metabolic syndrome. Endocr Rev 2000; 21: pp. 697-738.
14. Fox C.S., Massaro J.M., Hoffmann U., et. al.: Abdominal visceral and subcutaneous adipose tissue compartments: association with metabolic risk factors in the Framingham Heart Study. Circulation 2007; 116: pp. 39-48.
15. Bazzocchi A., Diano D., Battista G.: How fat is fat?. Lancet 2012; 380: pp. e1.
16. Item F., Konrad D.: Visceral fat and metabolic inflammation: the portal theory revisited. Obes Rev 2012; 13: pp. S30-S39.
17. Lazar M.A.: How obesity causes diabetes: not a tall tale. Science 2005; 307: pp. 373-375.
18. Suzuki R., Watanabe S., Hirai Y., et. al.: Abdominal wall fat index, estimated by ultrasonography, for assessment of the ratio of visceral fat to subcutaneous fat in the abdomen. Am J Med 1993; 95: pp. 309-314.
19. Soyama A., Nishikawa T., Ishizuka T., et. al.: Clinical usefulness of the thickness of preperitoneal and subcutaneous fat layer in the abdomen estimated by ultrasonography for diagnosing abdominal obesity in each type of impaired glucose tolerance in man. Endocr J 2005; 52: pp. 229-236.
20. Taksali S.E., Caprio S., Dziura J., et. al.: High visceral and low abdominal subcutaneous fat stores in the obese adolescent: a determinant of an adverse metabolic phenotype. Diabetes 2008; 57: pp. 367-371.
21. Lin L.I.: A concordance correlation coefficient to evaluate reproducibility. Biometrics 1989; 45: pp. 255-268.
22. Liu K.H., Chan Y.L., Chan W.B., et. al.: Sonographic measurement of mesenteric fat thickness is a good correlate with cardiovascular risk factors: comparison with subcutaneous and preperitoneal fat thickness, magnetic resonance imaging and anthropometric indexes. Int J Obes Relat Metab Disord 2003; 27: pp. 1267-1273.
23. Liu K.H., Chan Y.L., Chan J.C., et. al.: Association of carotid intima-media thickness with mesenteric, preperitoneal and subcutaneous fat thickness. Atherosclerosis 2005; 179: pp. 299-304.
24. Kim S.K., Kim H.J., Hur K.Y., et. al.: Visceral fat thickness measured by ultrasonography can estimate not only visceral obesity but also risks of cardiovascular and metabolic diseases. Am J Clin Nutr 2004; 79: pp. 593-599.
25. Ribeiro-Filho F.F., Faria A.N., Azjen S., et. al.: Methods of estimation of visceral fat: advantages of ultrasonography. Obes Res 2003; 11: pp. 1488-1494.
26. Ribeiro-Filho F.F., Faria A.N., Kohlmann O., et. al.: Ultrasonography for the evaluation of visceral fat and cardiovascular risk. Hypertension 2001; 38: pp. 713-717.
27. Leite C.C., Wajchenberg B.L., Radominski R., et. al.: Intra-abdominal thickness by ultrasonography to predict risk factors for cardiovascular disease and its correlation with anthropometric measurements. Metabolism 2002; 51: pp. 1034-1040.
28. De Lucia Rolfe E., Sleigh A., Finucane F.M., et. al.: Ultrasound measurements of visceral and subcutaneous abdominal thickness to predict abdominal adiposity among older men and women. Obesity (Silver Spring) 2010; 18: pp. 625-631.
29. Merino-Ibarra E., Artieda M., Cenarro A., et. al.: Ultrasonography for the evaluation of visceral fat and the metabolic syndrome. Metabolism 2005; 54: pp. 1230-1235.
30. Stolk R.P., Meijer R., Mali W.P., et. al.: Secondary Manifestations of Arterial Disease Study Group. Ultrasound measurements of intra-abdominal fat estimate the metabolic syndrome better than do measurements of waist circumference. Am J Clin Nutr 2003; 77: pp. 857-860.
31. Bartha J.L., Marín-Segura P., González-González N.L., et. al.: Ultrasound evaluation of visceral fat and metabolic risk factors during early pregnancy. Obesity (Silver Spring) 2007; 15: pp. 2233-2239.
32. Oh J., Kim S.K., Shin D.K., et. al.: A simple ultrasound correlate of visceral fat. Ultrasound Med Biol 2011; 37: pp. 1444-1451.
33. Stevens-Simon C., Thureen P., Stamm E., et. al.: A comparison of four techniques for measuring central adiposity in postpartum adolescents. J Matern Fetal Med 2001; 10: pp. 209-213.
34. Koda M., Senda M., Kamba M., et. al.: Sonographic subcutaneous and visceral fat indices represent the distribution of body fat volume. Abdom Imaging 2007; 32: pp. 387-392.
35. Guldiken S., Tuncbilek N., Okten O.O., et. al.: Visceral fat thickness determined using ultrasonography is associated with anthropometric and clinical parameters of metabolic syndrome. Int J Clin Pract 2006; 60: pp. 1576-1581.
36. Sabir N., Sermez Y., Kazil S., et. al.: Correlation of abdominal fat accumulation and liver steatosis: importance of ultrasonographic and anthropometric measurements. Eur J Ultrasound 2001; 14: pp. 121-128.