
Rationale and Objectives
Hyperthyroidism leads to an enhanced demand for glucose. The hypothesis of the study is that 2-[fluorine-18]fluoro-2-deoxy- d -glucose (FDG) positron emission tomography (PET) can demonstrate the alteration of systemic glucose metabolism in hyperthyroidism patients by measuring the FDG standard uptake value (SUV) in liver and skeletal muscle.
Materials and Methods
Forty-eight active hyperthyroidism patients and 30 control participants were recruited for the study. The intensity of FDG uptake in the liver and thigh muscles was graded subjectively, comprising three groups: group I, higher FDG uptake in the liver; group II, equal FDG uptake in the liver and muscles; and group III, higher FDG uptake in the muscles. Ten subjects with FDG PET scans at hyperthyroid and euthyroid status were analyzed. Serum levels of thyroxine (T 4 ) and triiodothyronine (T 3 ) correlated to the SUVs of the liver and muscles.
Results
Forty-one patients (41/48, 85.4%) showed symmetrically increased FDG uptake in the muscles (22 in group I, 9 in group II, and 17 in group III). Group I patients were significantly older than group II ( P = .02) and group III ( P = .001) patients. The correlation coefficient between the serum T 3 , T 4 , and SUV levels in the muscles was significant ( r = 0.47–0.77, P < .01), particularly in liver and muscle FDG uptake between hyperthyroid and euthyroid states. In the 30 control subjects, there was normal physiological FDG uptake in the liver and muscles.
Conclusion
In PET scans showing a pattern of decreased liver and increased skeletal muscle FDG uptake in hyperthyroidism patients, this change of FDG distribution is correspondence to the severity of hyperthyroidism status.
The thyroid hormone plays a critical role in temperature homeostasis, thereby influencing the rate of metabolism and energy expenditure . The enhancement of the metabolic rate in target tissues is accompanied by an increase in whole-body glucose utilization . During thyrotoxicosis, skeletal muscles increase glucose utilization in response to an increase in oxidative and nonoxidative metabolic pathways in humans . The liver plays a dominant role in the preservation of glucose homeostasis. Compared with euthyroid subjects, patients with hyperthyroidism have a 90% increase in fasting hepatic glucose production .
2-deoxy-2-[F-18]fluoro- d -glucose (FDG) is a glucose analog that is taken up by cell membrane glucose transport and then phosphorylated by hexokinase in the cytoplasm. Positron emission tomography (PET) with FDG is a whole-body imaging technique that exploits the increased glycolysis in tissue cells to detect disease. In an FDG PET cancer screening program resulting from body weight loss, it has been reported that incidental findings of symmetrically increased skeletal muscle and thymus FDG uptake is a clue for the diagnosis of hyperthyroidism .
Get Radiology Tree app to read full this article<
Materials and methods
Get Radiology Tree app to read full this article<
Get Radiology Tree app to read full this article<
Get Radiology Tree app to read full this article<
Get Radiology Tree app to read full this article<
Get Radiology Tree app to read full this article<
Get Radiology Tree app to read full this article<
Get Radiology Tree app to read full this article<
Results
Get Radiology Tree app to read full this article<
Table 1
Patient Characteristics, Thyroid Function, and FDG Uptake in Muscles and Liver
Groups Number of Patients Male/Female Age ∗ (y) Thyroid Function Test FDG Uptake Muscle Liver/Muscle Ratio TSH T 3 T 4 Diffuse SM Psoas Muscle Group I L > M Group II L = M Group III L < M Control 30 8/22 46.8 ± 7.5 Normal Normal Normal 0 0 30/30 0 0 Hyperthyroidism Patients 48 13/35 40.0 ± 14.4 <0.05 ↑ ↑ 41 41 22 (45.8%) 9 (18.8%) 17 (35.4%)
↑, increase; diffuse SM, diffuse skeletal muscle; FDG, 2-[fluorine-18]fluoro-2-deoxy- d -glucose; L, liver; M, muscle; T 3 , triiodothyronine; T 4 , thyroxine; TSH, thyrotropin.
Get Radiology Tree app to read full this article<
Get Radiology Tree app to read full this article<
Get Radiology Tree app to read full this article<
![Figure 1, The 2-[fluorine-18]fluoro-2-deoxy- d -glucose (FDG) positron emission tomography (PET) imaging (a,b) maximum intensity projection images and (a′,b′) coronal views of a 48-year-old female showed FDG uptake contrast changed between (a) the hyperthyroid and (b) euthyroid states. The FDG PET scan at the hyperthyroid state revealed increased FDG uptake in the thyroid, the thymus, and the skeletal muscles, especially the psoas muscle (a′) . The FDG activity intensity of the skeletal muscles was higher than that of the liver, representing a group III image. At hyperthyroidism status, the thyroid function test showed serum thyrotropin level <0.1 miU/mL (normal 0.4–5.0 miU/mL); T 3 , 264.6 ng/dL (normal 80–180 ng/dL); and T 4 , 15.3 μg/dL (normal 4.5–12 μg/dL). The FDG PET imaging at the euthyroid state (b) showed mild FDG uptake in the bilateral thyroid glands.](https://storage.googleapis.com/dl.dentistrykey.com/clinical/TheSignificanceofAlteration2fluorine18fluoro2deoxydglucoseUptakeintheLiverandSkeletalMusclesofPatientswithHyperthyroidism/0_1s20S1076633213003061.jpg)
Get Radiology Tree app to read full this article<
Get Radiology Tree app to read full this article<
![Figure 2, The 2-[fluorine-18]fluoro-2-deoxy- d -glucose (FDG) uptake in (a) the thigh muscle and (b) the liver in patients with hyperthyroidism altered significantly between the hyperthyroid state and the euthyroid state in 10 patients. The muscle FDG uptake decreased from 1.21 ± 0.27 at the hyperthyroid state to 0.77 ± 0.23 at the euthyroid state ( P < .001); the liver FDG uptake increased from 1.5 ± 0.23 at the hyperthyroid state to 1.87 ± 0.23 at the euthyroid state ( P < .005). Closed circles represent individual cases; open circles represent mean values in the hyperthyroid and euthyroid states. Error bars indicate standard deviation.](https://storage.googleapis.com/dl.dentistrykey.com/clinical/TheSignificanceofAlteration2fluorine18fluoro2deoxydglucoseUptakeintheLiverandSkeletalMusclesofPatientswithHyperthyroidism/1_1s20S1076633213003061.jpg)
Get Radiology Tree app to read full this article<
Get Radiology Tree app to read full this article<
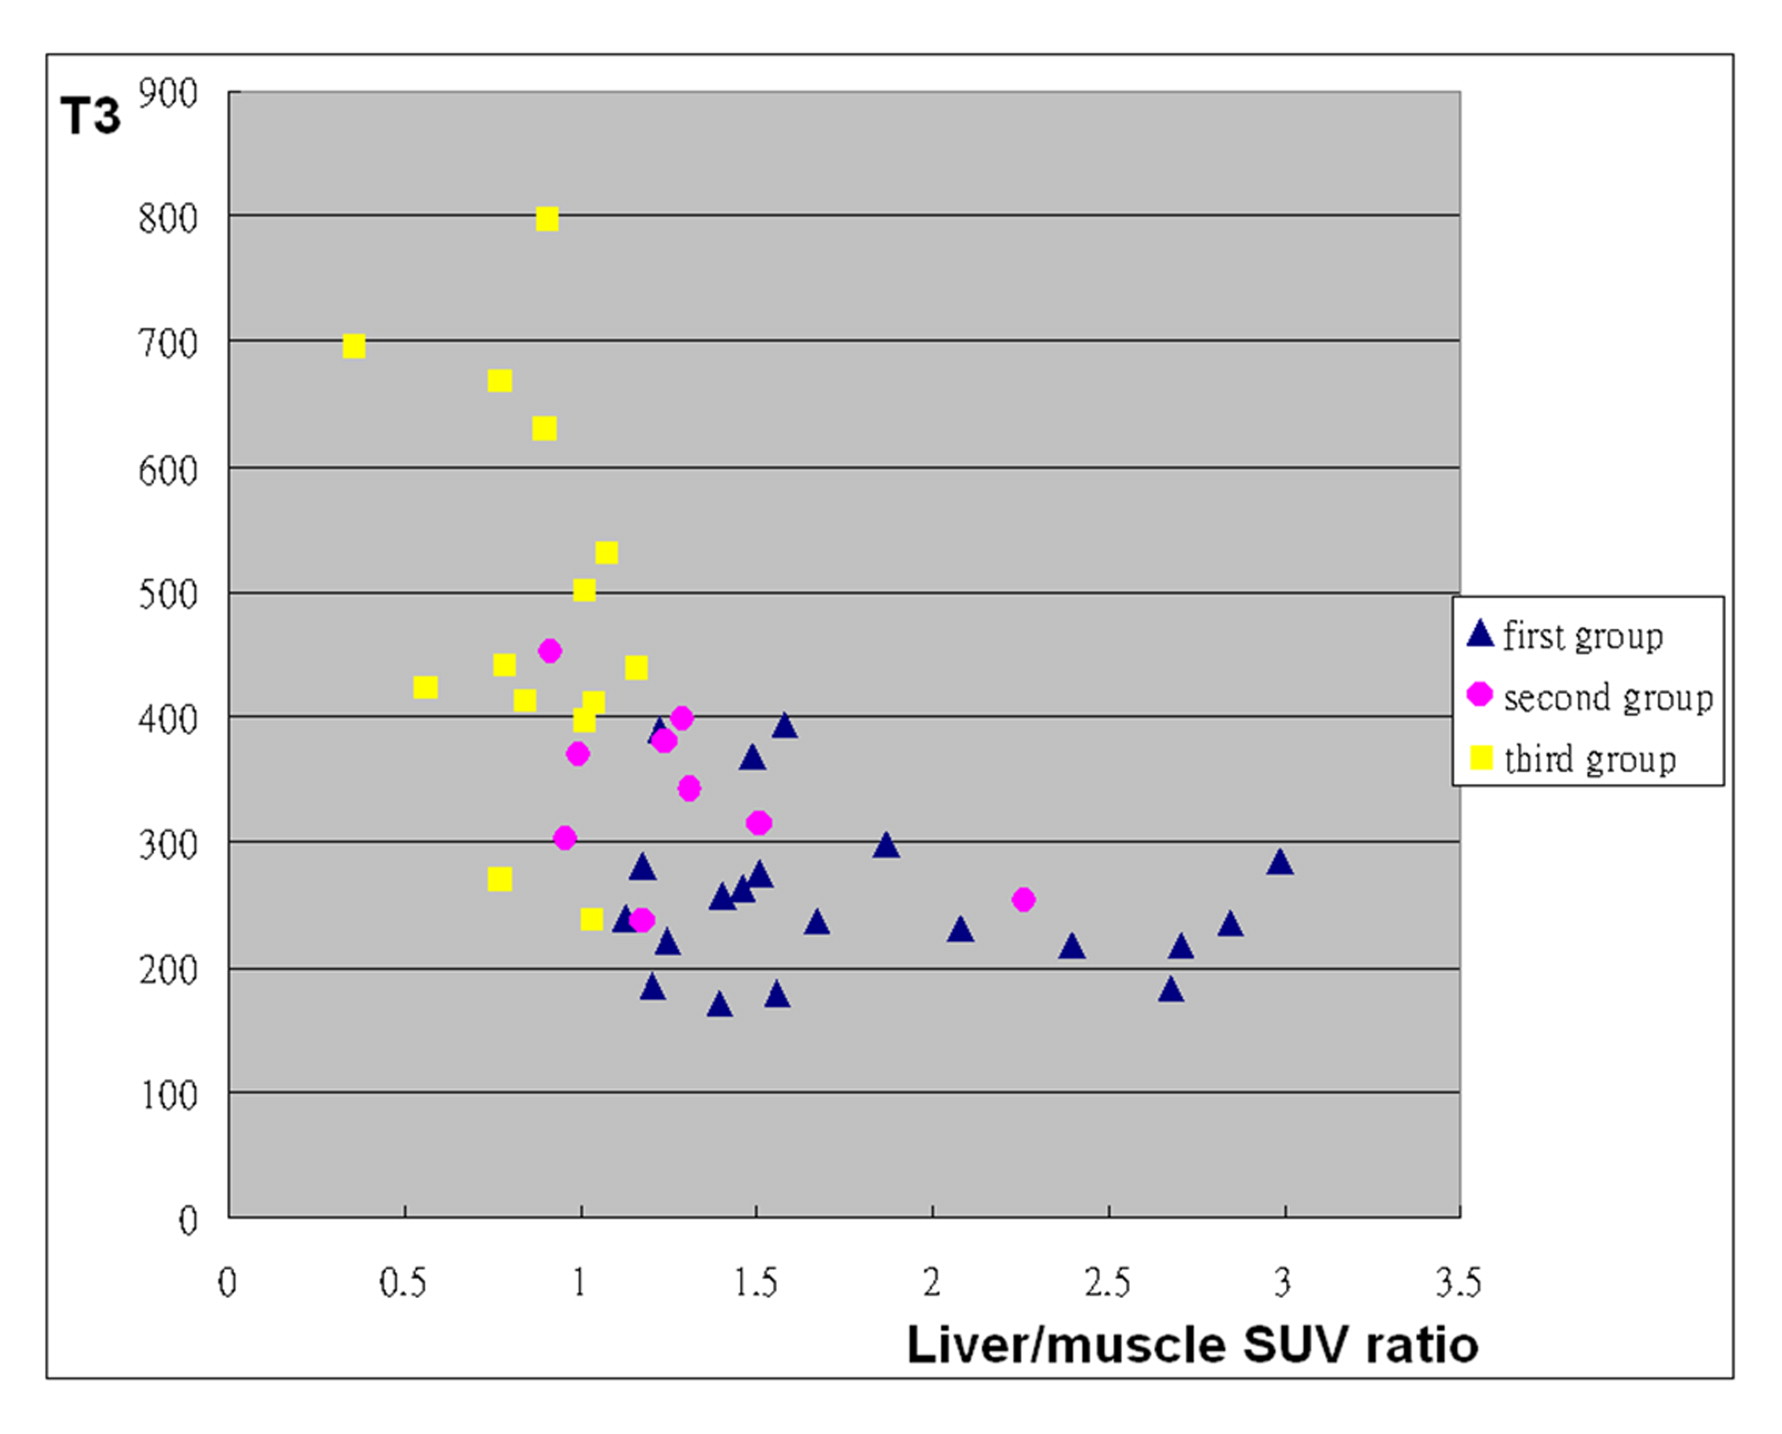
![Figure 3, The relationship between serum T 3 and the three groups of the liver to thigh muscle 2-[fluorine-18]fluoro-2-deoxy- d -glucose (FDG) uptake ratios from 48 hyperthyroidism patients. Each point gives the results for one patient. L, liver uptake of FDG; M, muscle uptake of FDG. *Significant difference ( P < .001; one-way analysis of variance/ t -test) compared with liver FDG uptake higher than the muscle group. #Significant difference ( P = .014; one-way analysis of variance/ t -test) compared with liver equal to the muscle FDG uptake group.](https://storage.googleapis.com/dl.dentistrykey.com/clinical/TheSignificanceofAlteration2fluorine18fluoro2deoxydglucoseUptakeintheLiverandSkeletalMusclesofPatientswithHyperthyroidism/2_1s20S1076633213003061.jpg)
Get Radiology Tree app to read full this article<
Get Radiology Tree app to read full this article<
Get Radiology Tree app to read full this article<
Get Radiology Tree app to read full this article<
Table 2
Correlations between SUVs of FDG Uptake in Different Skeletal Muscles and Serum Levels of T 3 , T 4 , TPO Ab, and TR Ab of 26 Active Hyperthyroidism Patients
Muscles T 3 T 4 TPO Ab TR Ab r_P_ Value r_P_ Value r_P_ Value r_P_ Value Arm 0.59 <.001 0.70 <.001 0.53 .001 0.25 .075 Psoas 0.47 .009 0.62 <.001 0.09 .64 0.03 .46 Thigh 0.66 <.001 0.77 <.001 0.33 .052 0.36 .032
FDG, 2-[fluorine-18]fluoro-2-deoxy- d -glucose; SUV, standard uptake value; T 3 , triiodothyronine; T 4 , thyroxine; TPO, thyroid peroxidase antibodies; TR Ab, thyrotropin receptor autoantibody.
Get Radiology Tree app to read full this article<
Discussion
Get Radiology Tree app to read full this article<
Get Radiology Tree app to read full this article<
Get Radiology Tree app to read full this article<
Get Radiology Tree app to read full this article<
Get Radiology Tree app to read full this article<
Get Radiology Tree app to read full this article<
Get Radiology Tree app to read full this article<
Acknowledgment
Get Radiology Tree app to read full this article<
Appendix
Supplementary material
Get Radiology Tree app to read full this article<
Get Radiology Tree app to read full this article<
References
1. Silva J.E.: The thermogenic effect of thyroid hormone and its clinical implications. Ann Intern Med 2003; 139: pp. 205-213.
2. Dimitriadis G., Parry-Billings M., Bevan S., et. al.: The effects of insulin on transport and metabolism of glucose in skeletal muscle from hyperthyroid and hypothyroid rats. Eur J Clin Invest 1997; 27: pp. 475-483.
3. Muller M.J., Acheson K.J., Jequier E., et. al.: Effect of thyroid hormones on oxidative and nonoxidative glucose metabolism in humans. Am J Physiol 1988; 255: pp. E146-E152.
4. Cavallo-Perin P., Bruno A., Boine L., et. al.: Insulin resistance in Graves’ disease: a quantitative in-vivo evaluation. Eur J Clin Invest 1988; 18: pp. 607-613.
5. Chen Y.K., Chen Y.L., Liao A.C., et. al.: Elevated 18 F-FDG uptake in skeletal muscles and thymus: a clue for the diagnosis of Graves’ disease. Nucl Med Commun 2004; 25: pp. 115-121.
6. Chen Y.K., Wang Y.F., Chiu J.S.: Diagnostic trinity: Graves’ disease on F-18 FDG PET. Clin Nucl Med 2007; 32: pp. 816-817.
7. Mitrou P., Raptis S.A., Dimitriadis G.: Insulin action in hyperthyroidism: a focus on muscle and adipose tissue. Endocr Rev 2010; 31: pp. 663-679.
8. Mokuno T., Uchimura K., Hayashi R., et. al.: Glucose transporter 2 concentrations in hyper- and hypothyroid rat livers. J Endocrinol 1999; 160: pp. 285-289.
9. Weinstein S.P., O’Boyle E., Fisher M., et. al.: Regulation of GLUT2 glucose transporter expression in liver by thyroid hormone: evidence for hormonal regulation of the hepatic glucose transport system. Endocrinology 1994; 135: pp. 649-654.
10. Leijendekker W.J., van Hardeveld C., Elzinga G.: Heat production during contraction in skeletal muscle of hypothyroid mice. Am J Physiol 1987; 253: pp. E214-E220.
11. Silva J.E.: The multiple contributions of thyroid hormone to heat production. J Clin Invest 2001; 108: pp. 35-37.
12. Potenza M., Via M.A., Yanagisawa R.T.: Excess thyroid hormone and carbohydrate metabolism. Endocr Pract 2009; 15: pp. 254-262.
13. Weinstein S.P., Watts J., Haber R.S.: Thyroid hormone increases muscle/fat glucose transporter gene expression in rat skeletal muscle. Endocrinology 1991; 129: pp. 455-464.
14. Casla A., Rovira A., Wells J.A., et. al.: Increased glucose transporter (GLUT4) protein expression in hyperthyroidism. Biochem Biophys Res Comm 1990; 171: pp. 182-188.
15. Kobayashi M., Kaida H., Kawahara A., et. al.: The relationship between GLUT-1 and vascular endothelial growth factor expression and 18 F-FDG uptake in esophageal squamous cell cancer patients. Clin Nucl Med 2012; 37: pp. 447-452.
16. Van den Abbeele A.D., Gatsonis C., de Vries D.J., et. al.: ACRIN 6665/RTOG 0132 phase II trial of neoadjuvant imatinib mesylate for operable malignant gastrointestinal stromal tumor: monitoring with 18 F-FDG PET and correlation with genotype and GLUT4 expression. J Nucl Med 2012; 53: pp. 567-574.
17. Trivalle C., Doucet J., Chassagne P., et. al.: Differences in the signs and symptoms of hyperthyroidism in older and younger patients. J Am Geriatr Soc 1996; 44: pp. 50-53.
18. Boelaert K., Torlinska B., Holder R.L., et. al.: Older subjects with hyperthyroidism present with a paucity of symptoms and signs: a large cross-sectional study. J Clin Endocrinol Metab 2010; 95: pp. 2715-2726.
19. Huitink J.M., Visser F.C., van Leeuwen G.R., et. al.: Influence of high and low plasma insulin levels on the uptake of fluorine-18 fluorodeoxyglucose in myocardium and femoral muscle, assessed by planar imaging. Eur J Nucl Med 1995; 22: pp. 1141-1148.