
Rationale and Objectives
This phantom study aimed to evaluate low-dose (LD) chest computed tomography (CT) protocols using model-based iterative reconstruction (MBIR) for diagnosing lung metastases in patients with sarcoma.
Materials and Methods
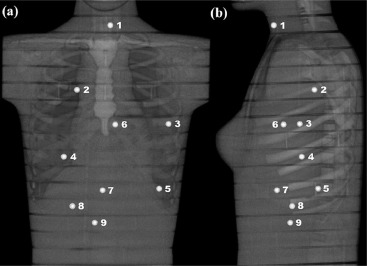
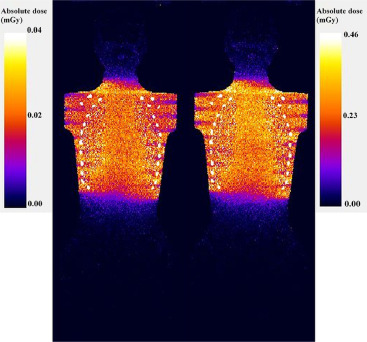
An adult female anthropomorphic phantom was scanned with a 64-slice CT using four LD protocols and a standard-dose protocol. Absorbed organ doses were measured with 10 metal-oxide-semiconductor field-effect transistor dosimeters. Furthermore, Monte Carlo simulations were performed to estimate organ and effective doses. Image quality in terms of image noise, contrast, and resolution was measured from the CT images reconstructed with conventional filtered back projection, adaptive statistical iterative reconstruction, and MBIR algorithms. All the results were compared to the performance of the standard-dose protocol.
Results
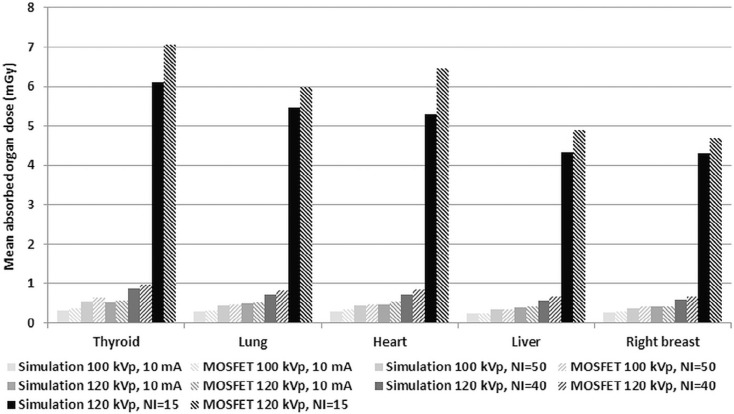
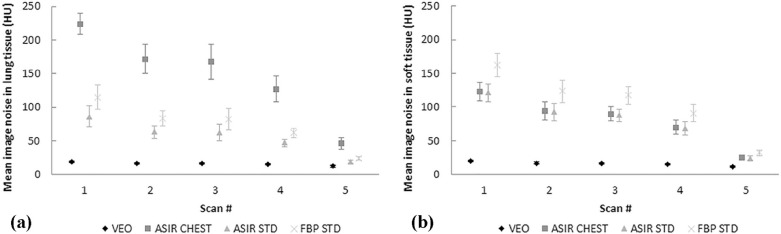
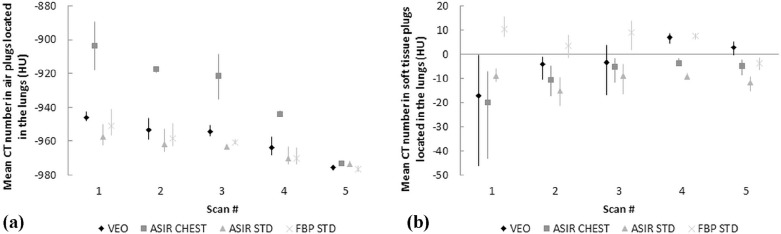
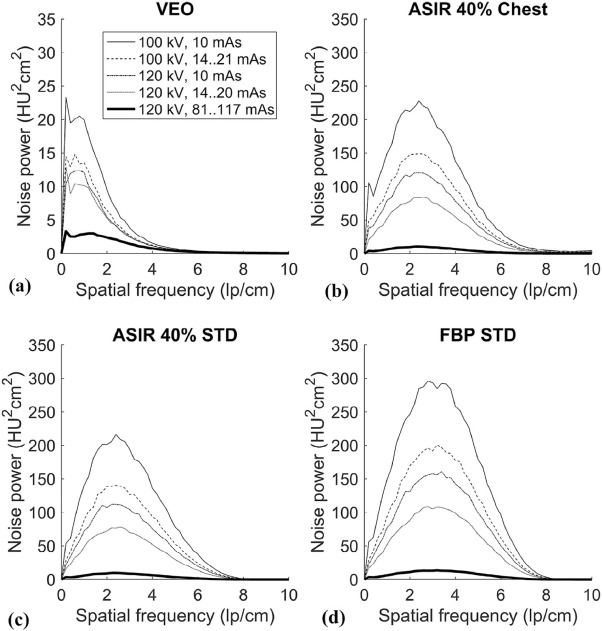
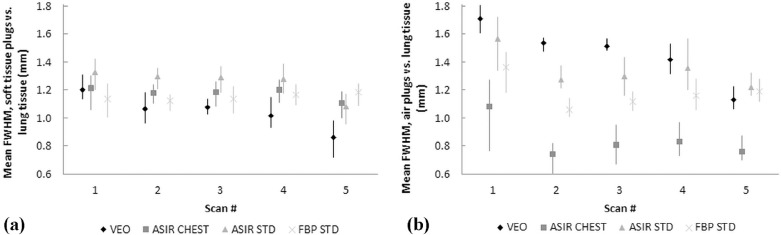
Mean absorbed organ and effective doses were reduced by approximately 95% with the LD protocol (100-kVp tube voltage and a fixed 10-mA tube current) compared to the standard-dose protocol (120-kVp tube voltage and tube current modulation) while yielding an acceptable image quality for diagnosing round-shaped lung metastases. The effective doses ranged from 0.16 to 2.83 mSv in the studied protocols. The image noise, contrast, and resolution were maintained or improved when comparing the image quality of LD protocols using MBIR to the performance of the standard-dose chest CT protocol using filtered back projection. The small round-shaped lung metastases were delineated at levels comparable to the used protocols.
Conclusions
Radiation exposure in patients can be reduced significantly by using LD chest CT protocols and MBIR algorithm while maintaining image quality for detecting round-shaped lung metastases.
Introduction
Soft tissue sarcoma is a cancer that originates in the soft tissues of the body, such as muscles, tendons, ligaments, cartilage, fat tissue, lymph and blood vessels, or nerves. Tumors are often located in the limbs, head and neck, chest, or abdomen; the lungs are the most common site of metastatic disease in soft tissue sarcoma . Therefore, patients at high risk of metastases are usually evaluated with chest computed tomography (CT) scans that can typically show round-shaped sarcoma metastases. Dose reduction in CT has become a major objective in optimizing radiological examinations. This finding is due to increased CT use in diagnosing diseases in the chest and other body areas and CT’s significant role in the accumulated radiation dose of the population. In accordance with current knowledge, the likelihood of presenting with stochastic adverse effects (eg, cancer) is assumed to increase linearly with radiation dose .
According to the commonly accepted ALARA (as low as reasonably achievable) principle, examinations using ionizing radiation should be performed with a radiation dose that is as low as reasonably achievable while maintaining sufficient image quality for diagnosis. Optimization strategies for chest CT include the use of automatic tube current modulation (TCM), lowered tube voltage, adaptive beam collimation in helical scans, and partial scanning (organ dose modulation); these strategies have all been used to reduce radiation exposure to tissues and to optimize image quality . One of the most promising CT optimization techniques is the continuously developing iterative reconstruction algorithms that aim to overcome the limitations of the traditional reconstruction method of filtered back projection (FBP) for image quality and diagnostic dose efficiency. The iterative reconstruction algorithms include statistical (hybrid) and model-based iterative reconstruction (MBIR) techniques. The former only models the noise statistics, whereas the latter uses a more complex system of prediction models, including modeling of optical factors, such as x-ray tube and detector responses, in addition to voxel projections, x-ray beam spectra, and noise statistics . Several studies have reported significant dose reduction capabilities of iterative reconstruction methods (especially with MBIR) in the chest and other body areas while maintaining or improving diagnostic image quality . However, some researchers have warned about the possibilities of missing clinically significant lesions with low-dose (LD) abdominal and chest CT protocols using iterative reconstruction techniques . The image noise magnitude and texture of the iteratively reconstructed images depend on the scanned tissue, and noise magnitude may behave differently at tissue boundaries compared to uniform regions .
Get Radiology Tree app to read full this article<
Materials and Methods
Dose Measurements and Simulations
Get Radiology Tree app to read full this article<
TABLE 1
Scanning Parameters and Dose Indices (CTDI vol and DLP) of the Used Low-dose and Standard-dose Protocols
Protocol Tube Voltage (kVp) Tube Current/GE NI Rotation Time (s) CTDI vol (mGy) DLP (mGy⋅cm) Low dose 1 100 Fixed 10 mA 0.4 0.20 6.33 Low dose 2 100 NI = 50 0.4 0.31 9.91 Low dose 3 120 Fixed 10 mA 0.4 0.31 10.05 Low dose 4 120 NI = 40 0.4 0.49 15.70 Standard dose 120 NI = 15 0.5 3.58 115.08
CTDI vol , volume computed tomography dose index, DLP, dose-length product; NI, noise index.
Get Radiology Tree app to read full this article<
Get Radiology Tree app to read full this article<
Get Radiology Tree app to read full this article<
Get Radiology Tree app to read full this article<
Get Radiology Tree app to read full this article<
Get Radiology Tree app to read full this article<
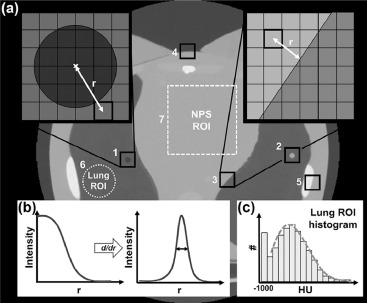
Image Quality Measurements and Analysis
Get Radiology Tree app to read full this article<
Get Radiology Tree app to read full this article<
Get Radiology Tree app to read full this article<
Get Radiology Tree app to read full this article<
Get Radiology Tree app to read full this article<
Get Radiology Tree app to read full this article<
Results
Organ Doses and Effective Doses
Get Radiology Tree app to read full this article<
Get Radiology Tree app to read full this article<
Get Radiology Tree app to read full this article<
TABLE 2
Organ Doses and Effective Doses Determined From the Monte Carlo Simulations for Different LD and Standard-dose Protocols
ICRP 103 Tissue Weighting Factor LD 1 (100 kVp, 10 mA) LD 2 (100 kVp), NI = 50 LD 3 (120 kVp, 10 mA) LD 4 (120 kVp), NI = 40 Standard Dose (120 kVp), NI = 15 Organ/Tissue_W T_ Equivalent Dose (mSv) Active bone marrow 0.12 0.0566 0.0882 0.0896 0.1395 1.0249 Colon 0.12 0.0073 0.0105 0.0130 0.0188 0.1444 Lung 0.12 0.2778 0.4270 0.4585 0.7057 5.1819 Stomach 0.12 0.2632 0.3737 0.4357 0.6190 4.7250 Breast 0.12 0.2683 0.3741 0.4316 0.6015 4.4266 Gonads 0.08 0.0006 0.0009 0.0012 0.0016 0.0127 Bladder 0.04 0.0012 0.0018 0.0023 0.0034 0.0259 Esophagus 0.04 0.2572 0.4046 0.4330 0.6824 4.9770 Liver 0.04 0.2654 0.3752 0.4379 0.6191 4.7167 Thyroid 0.04 0.2592 0.4382 0.4146 0.7032 4.9756 Bone surface 0.01 0.1134 0.1799 0.1799 0.2852 2.0858 Brain 0.01 0.0038 0.0065 0.0069 0.0118 0.0838 Salivary glands 0.01 0.0245 0.0418 0.0409 0.0698 0.5017 Skin 0.01 0.0930 0.1470 0.1496 0.2361 1.7316 Adrenals 0.0092 0.2245 0.3233 0.3822 0.5482 4.2295 Extrathoracic region 0.0092 0.0208 0.0351 0.0351 0.0598 0.4231 Gallbladder 0.0092 0.2525 0.3625 0.4218 0.6057 4.6587 Heart 0.0092 0.2944 0.4521 0.4911 0.7542 5.5098 Kidneys 0.0092 0.1206 0.1742 0.2044 0.2950 2.2723 Lymphatic nodes 0.0092 0.1238 0.1987 0.2068 0.3313 2.4233 Muscle 0.0092 0.0917 0.1457 0.1509 0.2396 1.7566 Oral mucosa 0.0092 0.0165 0.0282 0.0288 0.0485 0.3476 Pancreas 0.0092 0.1801 0.2594 0.3027 0.4365 3.3613 Small intestine 0.0092 0.0223 0.0322 0.0380 0.0550 0.4236 Spleen 0.0092 0.2408 0.3470 0.4020 0.5808 4.4665 Thymus 0.0092 0.3119 0.5305 0.5138 0.8726 6.2617 Uterus 0.0092 0.0007 0.0010 0.0013 0.0020 0.0149 Effective dose, E (mSv) ∑ W T = 1 0.16 0.23 0.26 0.38 2.83
ICRP, International Commission on Radiological Protection; LD, low dose; NI, noise index.
Get Radiology Tree app to read full this article<
Get Radiology Tree app to read full this article<
Get Radiology Tree app to read full this article<
Image Quality Measurements and Analysis
Get Radiology Tree app to read full this article<
Get Radiology Tree app to read full this article<
Get Radiology Tree app to read full this article<
Get Radiology Tree app to read full this article<
Get Radiology Tree app to read full this article<
Get Radiology Tree app to read full this article<
Get Radiology Tree app to read full this article<
Get Radiology Tree app to read full this article<
Get Radiology Tree app to read full this article<
Get Radiology Tree app to read full this article<
Discussion
Get Radiology Tree app to read full this article<
Get Radiology Tree app to read full this article<
Get Radiology Tree app to read full this article<
Get Radiology Tree app to read full this article<
Get Radiology Tree app to read full this article<
Get Radiology Tree app to read full this article<
Get Radiology Tree app to read full this article<
Get Radiology Tree app to read full this article<
Get Radiology Tree app to read full this article<
Conclusions
Get Radiology Tree app to read full this article<
Acknowledgments
Get Radiology Tree app to read full this article<
Supplementary Data
Get Radiology Tree app to read full this article<
Figure S1
Get Radiology Tree app to read full this article<
Get Radiology Tree app to read full this article<
Get Radiology Tree app to read full this article<
Figure S2
Get Radiology Tree app to read full this article<
Get Radiology Tree app to read full this article<
Get Radiology Tree app to read full this article<
Figure S3
Get Radiology Tree app to read full this article<
Get Radiology Tree app to read full this article<
Get Radiology Tree app to read full this article<
Figure S4
Get Radiology Tree app to read full this article<
Get Radiology Tree app to read full this article<
Get Radiology Tree app to read full this article<
References
1. Billingsley K.G., Burt M.E., Jara E., et. al.: Pulmonary metastases from soft tissue sarcoma: analysis of patterns of diseases and postmetastasis survival. Ann Surg 1999; 229: pp. 602-610.
2. Cormier J.N., Pollock R.E.: Soft tissue sarcomas. CA Cancer J Clin 2004; 54: pp. 94-109.
3. BEIR (Committee on the Biological Effects of Ionizing Radiations) : Health risks from exposure to low levels of ionizing radiation: BEIR VII—phase 2.2006.The National Academies PressWashington, DC National Research Council of the National Academies
4. Brenner D.J., Hall E.J.: Computed tomography—an increasing source of radiation exposure. N Engl J Med 2007; 357: pp. 2277-2284.
5. Pearce M.S., Salotti J.A., Little M.P., et. al.: Radiation exposure from CT scans in childhood and subsequent risk of leukaemia and brain tumours: a retrospective cohort study. Lancet 2012; 380: pp. 499-505.
6. Kalra M.K., Maher M.M., Toth T.L., et. al.: Techniques and applications of automatic tube current modulation for CT. Radiology 2004; 233: pp. 649-657.
7. Schueller-Weidekamm C., Schaefer-Prokop C.M., Weber M., et. al.: CT angiography of pulmonary arteries to detect pulmonary embolism: improvement of vascular enhancement with low kilovoltage settings. Radiology 2006; 241: pp. 899-907.
8. Kalender W.A., Buchenau S., Deak P., et. al.: Technical approaches to the optimisation of CT. Phys Med 2008; 24: pp. 71-79.
9. Deak P.D., Langner O., Lell M., et. al.: Effects of adaptive section collimation on patient radiation dose in multisection spiral CT. Radiology 2009; 252: pp. 140-147.
10. Wang J., Duan X., Christner J.A., et. al.: Radiation dose reduction to the breast in thoracic CT: comparison of bismuth shielding, organ-based tube current modulation, and use of a globally decreased tube current. Med Phys 2011; 38: pp. 6084-6092.
11. Thibault J.B., Sauer K.D., Bouman C.A., et. al.: A three-dimensional statistical approach to improve image quality for multislice helical CT. Med Phys 2007; 34: pp. 4526-4544.
12. Katsura M., Matsuda I., Akahane M., et. al.: Model-based iterative reconstruction technique for radiation dose reduction in chest CT: comparison with the adaptive statistical iterative reconstruction technique. Eur Radiol 2012; 22: pp. 1613-1623.
13. Pickhardt P.J., Lubner M.G., Kim D.H., et. al.: Abdominal CT with model-based iterative reconstruction (MBIR): initial results of a prospective trial comparing ultralow-dose with standard-dose imaging. Am J Roentgenol 2012; 199: pp. 1266-1274.
14. Deák Z., Grimm J.M., Treitl M.: Filtered back projection, adaptive statistical iterative reconstruction, and a model-based iterative reconstruction in abdominal CT: an experimental clinical study. Radiology 2013; 266: pp. 197-206.
15. Katsura M., Matsuda I., Akahane M., et. al.: Model-based iterative reconstruction technique for ultralow-dose chest CT: comparison of pulmonary nodule detectability with the adaptive statistical iterative reconstruction technique. Invest Radiol 2013; 48: pp. 206-212.
16. Miéville F.A., Berteloot L., Grandjean A., et. al.: Model-based iterative reconstruction in pediatric chest CT: assessment of image quality in a prospective study of children with cystic fibrosis. Pediatr Radiol 2013; 43: pp. 558-567.
17. Neroladaki A., Botsikas D., Boudabbous S., et. al.: Computed tomography of the chest with model-based iterative reconstruction using a radiation exposure similar to chest X-ray examination: preliminary observations. Eur Radiol 2013; 23: pp. 360-366.
18. Xu Y., He W., Chen H., et. al.: Impact of the adaptive statistical iterative reconstruction technique on image quality in ultra-low-dose CT. Clin Radiol 2013; 68: pp. 902-908.
19. Gordic S., Morsbach F., Schmidt B., et. al.: Ultralow-dose chest computed tomography for pulmonary nodule detection. Invest Radiol 2014; 49: pp. 465-473.
20. Kim H., Park C.M., Song Y.S., et. al.: Influence of radiation dose and iterative reconstruction algorithms for measurement accuracy and reproducibility of pulmonary nodule volumetry: a phantom study. Eur J Radiol 2014; 83: pp. 848-857.
21. Kim H., Park C.M., Kim S.H., et. al.: Persistent pulmonary subsolid nodules: model-based iterative reconstruction for nodule classification and measurement variability on low-dose CT. Eur Radiol 2014; 24: pp. 2700-2708.
22. Sun J., Peng Y., Duan X., et. al.: Image quality in children with low-radiation chest CT using adaptive statistical iterative reconstruction and model-based iterative reconstruction. PLoS ONE 2014; 9: e96045
23. Willemink M.J., Takx R.A.P., de Jong P.A., et. al.: Computed tomography radiation dose reduction: effect of different iterative reconstruction algorithms on image quality. J Comput Assist Tomogr 2014; 38: pp. 815-823.
24. Hérin E., Gardavaud F., Chiaradia M., et. al.: Use of model-based iterative reconstruction (MBIR) in reduced-dose CT for routine follow-up of patients with malignant lymphoma: dose savings, image quality and phantom study. Eur Radiol 2015; 25: pp. 2362-2370.
25. Kaasalainen T., Palmu K., Lampinen A., et. al.: Limiting CT radiation dose in children with craniosynostosis: phantom study using model-based iterative reconstruction. Pediatr Radiol 2015; 45: pp. 1544-1553.
26. Rampinelli C., Origgi D., Vecchi V., et. al.: Ultra-low-dose CT with model-based iterative reconstruction (MBIR): detection of ground-glass nodules in an anthropomorphic phantom study. Radiol Med 2015; 120: pp. 611-617.
27. Yuki H., Oda S., Utsunomiya D., et. al.: Clinical impact of model-based type iterative reconstruction with fast reconstruction time on image quality of low-dose screening chest CT. Acta Radiol 2016; 57: pp. 295-302.
28. Wang R., Sui X., Schoep U.J., et. al.: Ultralow-radiation dose chest CT: accuracy for lung densitometry and emphysema detection. Am J Roentgenol 2015; 204: pp. 743-749.
29. Deák Z., Maertz F., Meurer F., et. al.: Submillisievert computed tomography of the chest using model-based iterative algorithm: optimization of tube voltage with regard to patient size. J Comput Assist Tomogr 2017; 41: pp. 254-262.
30. Huber A., Landau J., Ebner L., et. al.: Performance of ultralow-dose CT iterative reconstruction in lung cancer screening: limiting radiation dose exposure to the equivalent of conventional chest X-ray imaging. Eur Radiol 2016; 26: pp. 3643-3652.
31. Messerli M., Kluckert T., Knitel M., et. al.: Ultralow dose CT for pulmonary nodule detection with chest x-ray equivalent dose—a prospective intra-individual comparative study. Eur Radiol 2017; 27: pp. 3290-3299.
32. Padole A., Singh S., Ackman J.B., et. al.: Submillisievert chest CT with filtered back projection and iterative reconstruction techniques. Am J Roentgenol 2014; 203: pp. 772-781.
33. Padole A., Singh S., Lira D., et. al.: Assessment of filtered back projection, adaptive statistical, and model-based iterative reconstruction for reduced dose abdominal computed tomography. J Comput Assist Tomogr 2015; 39: pp. 462-467.
34. Solomon J., Samei E.: Quantum noise properties of CT images with anatomical textured backgrounds across reconstruction algorithms: FBP and SAFIRE. Med Phys 2014; 41: pp. 091908.
35. Poludniowski G., Landry G., DeBlois F., et. al.: SpekCalc: a program to calculate photon spectra from tungsten anode x-ray tubes. Phys Med Biol 2009; 54: pp. N433-N438.
36. Alikhani B., Büermann L.: Non-invasive experimental determination of a CT source model. Phys Med 2016; 32: pp. 59-66.
37. International Commission on Radiological Protection (ICRP) : Adult reference computational phantoms. ICRP Publication 110. Ann ICRP 2009; 39: pp. 1-164.
38. Lagarias J.C., Reeds J.A., Wright M.H., et. al.: Convergence properties of the Nelder-Mead simplex method in low dimensions. SIAM J Optim 1998; 9: pp. 112-147.
39. Kaasalainen T., Palmu K., Lampinen A., et. al.: Effect of vertical positioning on organ dose, image noise and contrast in pediatric chest CT—phantom study. Pediatr Radiol 2013; 43: pp. 673-684.
40. Baek J., Pelc N.J.: The noise power spectrum in CT with direct fan beam reconstruction. Med Phys 2010; 37: pp. 2074-2081.
41. Sanders J., Hurwitz L., Samei E.: Patient-specific quantification of image quality: an automated method for measuring spatial resolution in clinical CT images. Med Phys 2016; 43: pp. 5330.
42. Otsu N.: A threshold selection method from gray-level histograms. IEEE Trans Systems Man Cybern 1970; 9: pp. 62-66.
43. Suomalainen A., Kiljunen T., Käser Y., et. al.: Dosimetry and image quality of four dental cone beam computed tomography scanners compared with multislice computed tomography scanners. Dentomaxillofac Radiol 2009; 38: pp. 367-378.
44. Mettler F.A., Huda W., Yoshizumi T.T., et. al.: Effective doses in radiology and diagnostic nuclear medicine: a catalog. Radiology 2008; 248: pp. 254-263.
45. Zhang Y., Li X., Segars W.P., et. al.: Organ doses, effective doses, and risk indices in adult CT: comparison of four types of reference phantoms across different examination protocols. Med Phys 2012; 39: pp. 3404-3423.
46. Deak P., van Straten M., Shrimpton P.C., et. al.: Validation of a Monte Carlo tool for patient-specific dose simulations in multi-slice computed tomography. Eur Radiol 2008; 18: pp. 759-772.
47. Myronakis M., Perisinakis K., Tzedakis A., et. al.: Evaluation of a patient-specific Monte Carlo software for CT dosimetry. Radiat Prot Dosimetry 2009; 133: pp. 248-255.
48. Schmidt B., Saltybaeva N., Kolditz D., et. al.: Assessment of patient dose from CT localizer radiographs. Med Phys 2013; 40: pp. 084301.
49. Schmidt B., Hupfer M., Saltybaeva N., et. al.: Dose optimization for computed tomography localizer radiographs for low-dose lung computed tomography examinations. Invest Radiol 2017; 52: pp. 81-86.