
Rationale and Objectives
Liver is a common site for distal metastases in colon and rectal cancer. Numerous clinical studies have analyzed the relative merits of different imaging modalities for detection of liver metastases. Several exciting new therapies are being investigated in preclinical models. But, technical challenges in preclinical imaging make it difficult to translate conclusions from clinical studies to the preclinical environment. This study addresses the technical challenges of preclinical magnetic resonance imaging (MRI) and micro-computed tomography (CT) to enable comparison of state-of-the-art methods for following metastatic liver disease.
Materials and Methods
We optimized two promising preclinical protocols to enable a parallel longitudinal study tracking metastatic human colon carcinoma growth in a mouse model: T 2 -weighted MRI using two-shot PROPELLER (Periodically Rotated Overlapping ParallEL Lines with Enhanced Reconstruction) and contrast-enhanced micro-CT using a liposomal contrast agent. Both methods were tailored for high throughput with attention to animal support and anesthesia to limit biological stress.
Results and Conclusions
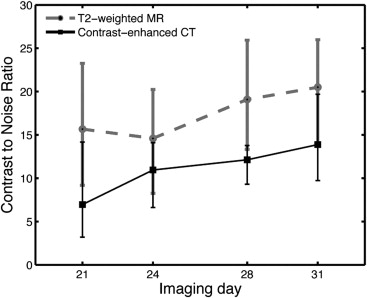
Each modality has its strengths. Micro-CT permitted more rapid acquisition (<10 minutes) with the highest spatial resolution (88-micron isotropic resolution). But detection of metastatic lesions requires the use of a blood pool contrast agent, which could introduce a confound in the evaluation of new therapies. MRI was slower (30 minutes) and had lower anisotropic spatial resolution. But MRI eliminates the need for a contrast agent and the contrast-to-noise between tumor and normal parenchyma was higher, making earlier detection of small lesions possible. Both methods supported a relatively high-throughput, longitudinal study of the development of metastatic lesions.
Colorectal cancer is the third most common type of cancer in humans . It commonly metastasizes to the liver, at which point morbidity and mortality drastically increase. In a third of the patients who die of colorectal cancer, metastatic disease is found only in the liver. Liver metastases are also seen in other cancers such as pancreas, stomach, breast, and lung, making the liver one of the most common sites of distal metastases, second only to lymph nodes. Early detection and effective treatment of liver metastases would greatly improve prognosis for many patients.
Preclinical orthotopic disease models, which closely mimic human tumor conditions, are a tremendous resource for measuring the efficacy of many potential treatments now under study. Preclinical imaging is rapidly becoming one of the most critical methods for evaluating response to these therapies. But, extension of clinical methods/conclusions to the preclinical environment is fraught with challenges. The mouse, at 25 g, is nearly 3000 times smaller than a human, so the spatial resolution in the preclinical system must be commensurately higher. Physiologic rates are also faster (heart rate is 10 times and respiration is 5 times faster), so the temporal resolution of the preclinical system must be correspondingly faster. Small animal imaging usually requires anesthesia, and respiratory motion is a major technical challenge, particularly for imaging abdominal organs. Although scan-synchronized respiration has become routine, it requires intubation, which induces stress in the animal and adds to the complexity of the study. The mouse is fragile. One must provide external thermal regulation and limit physical handling. Finally, for any protocol to be useful, it must be executed in a reasonable time. Thus the criteria we have set in designing this comparative preclinical protocol are: 1) stress on the animal must be minimized; 2) setup and execution must be accomplished in <30 minutes; 3) imaging must cover the entire liver; and 4) images must be of the highest quality possible.
This last criterion of image quality imposes a particularly vexing conundrum. What are the most appropriate preclinical modalities and how does one optimize them for our given task—noninvasive study of liver metastases? Preclinical studies of mouse models of liver cancer have used several imaging modalities: positron emission tomography (PET) , bioluminescence imaging , computed tomography (CT) , and magnetic resonance imaging (MRI) , albeit independently. PET provides excellent functional information regarding tumor metabolism. However, PET is costly, not widely available, and has resolution limits of >1 mm 3 imposed by the physics of positron decay. Although the spatial resolution limit is not a significant problem in the clinical domain, resolution at 1 mm or greater is particularly problematic in the mouse. Bioluminescence imaging, though highly sensitive, is also limited by spatial resolution as well as the need for mouse models that genetically express luciferase. CT is more readily available, provides high spatial resolution, and is also preferred for clinical liver imaging, which makes translational studies more appealing. MRI has the best soft-tissue contrast and has been used frequently with an extraordinary range of imaging sequences and contrast mechanisms. Thus, we chose to compare micro-CT and MRI microscopy.
Get Radiology Tree app to read full this article<
Get Radiology Tree app to read full this article<
Get Radiology Tree app to read full this article<
Materials and methods
Animal Model
Get Radiology Tree app to read full this article<
Get Radiology Tree app to read full this article<
Experimental Design
Get Radiology Tree app to read full this article<
Table 1
Experiment Timeline
Day of Study 0 9 10 13 14 16 17 20 21 23 24 27 28 30 31 Tumor inoculation
(number of mice) X
24 Computed tomography contrast injection
(number of mice) X
8 X
8 X
8 X
8 X
8 X
7 X
6 Computed tomography imaging
(number of mice) X
8 X
8 X
8 X
8 X
8 X
7 X
6 Magnetic resonance imaging
(number of mice) X
8 X
8 X
8 X
8 X
8 X
6 X
6 Histology
(number of mice) X
2 X
2 X
2
Get Radiology Tree app to read full this article<
Get Radiology Tree app to read full this article<
Get Radiology Tree app to read full this article<
Get Radiology Tree app to read full this article<
Get Radiology Tree app to read full this article<
MRI Protocol
Get Radiology Tree app to read full this article<
Get Radiology Tree app to read full this article<
CT Imaging Protocol
Get Radiology Tree app to read full this article<
Get Radiology Tree app to read full this article<
Image Analysis
Get Radiology Tree app to read full this article<
CNR=(|SIliver−SItumor|σnoise) C
N
R
=
(
|
S
I
l
i
v
e
r
−
S
I
t
u
m
o
r
|
σ
n
o
i
s
e
)
Get Radiology Tree app to read full this article<
Get Radiology Tree app to read full this article<
Conventional Histology
Get Radiology Tree app to read full this article<
Results
Get Radiology Tree app to read full this article<
Get Radiology Tree app to read full this article<
Get Radiology Tree app to read full this article<
Get Radiology Tree app to read full this article<
Get Radiology Tree app to read full this article<
Get Radiology Tree app to read full this article<
Get Radiology Tree app to read full this article<
Get Radiology Tree app to read full this article<
Get Radiology Tree app to read full this article<
Get Radiology Tree app to read full this article<
Get Radiology Tree app to read full this article<
Get Radiology Tree app to read full this article<
Get Radiology Tree app to read full this article<
Get Radiology Tree app to read full this article<
Get Radiology Tree app to read full this article<
Discussion
Get Radiology Tree app to read full this article<
Get Radiology Tree app to read full this article<
Get Radiology Tree app to read full this article<
Get Radiology Tree app to read full this article<
Get Radiology Tree app to read full this article<
Get Radiology Tree app to read full this article<
Get Radiology Tree app to read full this article<
Get Radiology Tree app to read full this article<
Acknowledgments
Get Radiology Tree app to read full this article<
References
1. Jemal A., Siegel R., Ward E., et. al.: Cancer statistics, 2009. CA Cancer J Clin 2009; 59: pp. 225-249.
2. Zhao S., Moore J.V., Waller M.L., et. al.: Positron emission tomography of murine liver metastases and the effects of treatment by combretastatin A-4. Eur J Nucl Med 1999; 26: pp. 231-238.
3. Inoue Y., Izawa K., Tojo A., et. al.: Monitoring of disease progression by bioluminescence imaging and magnetic resonance imaging in an animal model of hematologic malignancy. Exp Hematol 2007; 35: pp. 407-415.
4. Smakman N., Martens A., Kranenburg O., et. al.: Validation of bioluminescence imaging of colorectal liver metastases in the mouse. J Surg Res 2004; 122: pp. 225-230.
5. Martiniova L., Schimel D., Lai E.W., et. al.: In vivo micro-CT imaging of liver lesions in small animal models. Methods 2009; 50: pp. 20-25.
6. Baboi L., Pilleul F., Milot L., et. al.: Magnetic resonance imaging follow-up of liver growth of neuroendocrine tumors in an experimental mouse model. Magn Reson Imaging 2009; 28: pp. 264-272.
7. Cai S.R., Garbow J.R., Culverhouse R., et. al.: A mouse model for developing treatment for secondary liver tumors. Int J Oncol 2005; 27: pp. 113-120.
8. Kalber T.L., Waterton J.C., Griffiths J.R., et. al.: Longitudinal in vivo susceptibility contrast MRI measurements of LS174T colorectal liver metastasis in nude mice. J Magn Reson Imaging 2008; 28: pp. 1451-1458.
9. Badea C.T., Hedlund L.W., Johnson G.A.: Micro-CT with respiratory and cardiac gating. Med Phys 2004; 31: pp. 3324-3329.
10. Pandit P., Qi Y., Story J., et. al.: Multi-shot PROPELLER for high-field MRI. Magn Reson Med 2010; 64: pp. 47-53.
11. Pandit P., Qi Y., King K.F., et. al.: Reduction of artifacts in T2 -weighted PROPELLER in high-field preclinical imaging. Magn Reson Med 2011; 65: pp. 538-543.
12. Pipe J.G.: Motion correction with PROPELLER MRI: application to head motion and free-breathing cardiac imaging. Magn Reson Med 1999; 42: pp. 963-969.
13. Badea C., Fubara B., Hedlund L., et. al.: 4D micro-CT of the mouse heart. Mol Imaging 2005; 4: pp. 110-116.
14. Mukundan S., Ghaghada K.B., Badea C.T., et. al.: A liposomal nanoscale contrast agent for preclincal CT in mice. AJR Am J Roentgenol 2006; 186: pp. 300-307.
15. Hergan K., Doringer W., Langle M., et. al.: Effects of iodinated contrast agents in MR imaging. Eur J Radiol 1995; 21: pp. 11-17.
16. Howles G.P., Nouls J.C., Qi Y., et. al.: Rapid production of specialized animal handling devices using computer-aided design and solid freeform fabrication. J Magn Reson Imaging 2009; 30: pp. 466-471.
17. Lin M., Toncheva G., Nguyen G., et. al.: Application of MOSFET detectors in small animal digital subtraction angiography (DSA) dosimetry. Radiat Res 2008; 170: pp. 260-263.
18. Berns G.S., Howell S.M., Farley T.E.: The accuracy of signal intensity measurements in magnetic resonance imaging as evaluated with the knee. Mag Reson Imaging 1992; 10: pp. 573-578.
19. Ford N.L., Thornton M.M., Holdsworth D.W.: Fundamental image quality limits for microcomputed tomography in small animals. Med Phys 2003; 30: pp. 2869-2877.
20. Martiniova L., Kotys M.S., Thomasson D., et. al.: Noninvasive monitoring of a murine model of metastatic pheochromocytoma: a comparison of contrast-enhanced microCT and nonenhanced MRI. J Magn Reson Imaging 2009; 29: pp. 685-691.