
Rationale and Objectives
The aim of this study was to investigate the value of digital tomosynthesis in the diagnosis of suspected pulmonary lesions on chest radiography.
Materials and Methods
Two-hundred twenty-eight patients (133 men, 95 women; mean age, 70.8 ± 11.1 years) with suspected pulmonary lesions after initial analysis of chest radiography underwent digital tomosynthesis. Two independent readers (with 3 and 20 years of experience) prospectively analyzed the chest radiographic and digital tomosynthesis images on a picture archiving and communication system workstation and proposed a diagnostic confidence score for each lesion (1 or 2 = definitely or probably extrapulmonary lesion or pseudolesion, 3 = indeterminate, 4 or 5 = probably or definitely pulmonary lesion). Chest computed tomography was the reference standard examination.
Results
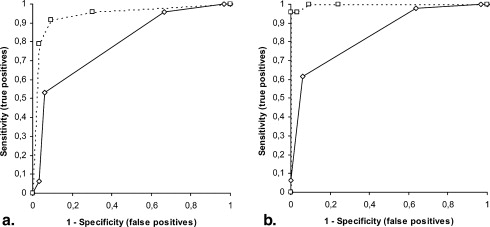
A total of 251 suspected pulmonary lesions were identified. In 71 patients, digital tomosynthesis and computed tomography did not confirm any lesion. In the remaining 157 patients, 180 lesions were identified, including 112 pulmonary and 68 extrapulmonary lesions. In 110 (reader 1) and 123 (reader 2) lesions, correct diagnoses were provided after analysis of the chest radiographs. All lesions were correctly classified after digital tomosynthesis except for 14 extrapulmonary lesions (both readers) that were misinterpreted as pulmonary and 10 (reader 1) and six (reader 2) pulmonary lesions that were misinterpreted as pleural. Digital radiography versus tomosynthesis differed in accuracy (reader 1, 43% vs 90%; reader 2, 49% vs 92%; P < .05) and confidence by area under the receiver-operating characteristic curve (reader 1, 0.788 vs 0.944; reader 2, 0.840 vs 0.997; P < .05).
Conclusions
Digital tomosynthesis improved diagnostic accuracy and confidence in the diagnosis of suspected pulmonary lesions on chest radiography.
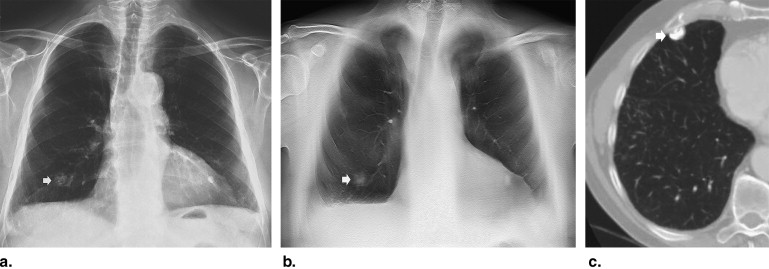
The detection and characterization of pulmonary lesions, particularly of pulmonary nodules, are challenging tasks in thoracic imaging because of their frequently small size and poor conspicuity within surrounding anatomic structures. Pulmonary lesions are often visible retrospectively when reviewing previous radiographic images of patients with known nodules , and computer-aided detection systems have been advocated to improve the diagnostic accuracy . Frequently, a radiologist reporting chest radiographic images identifies doubtful or equivocal findings that could be attributed both to pulmonary and extrapulmonary lesions or to pseudolesions due to different overlapping planes.
One successful method for improving the conspicuity of suspected pulmonary lesions is dual-energy radiography . Although this method reduces the visible distraction of overlying ribs, it is nonetheless limited in that it does not reduce the visual clutter from overlying soft tissues. Computed tomography (CT) is the gold standard for imaging pulmonary lesions, particularly pulmonary nodules , but it remains relatively expensive and delivers considerable radiation dose to patients. Therefore, most lung lesions are detected by conventional chest radiography, with CT being normally performed to verify or clarify the diagnosis. Frequently, CT is performed in patients without any pulmonary lesions or with pulmonary lesions that appear clearly benign after CT .
Get Radiology Tree app to read full this article<
Get Radiology Tree app to read full this article<
Methods and materials
Patients
Get Radiology Tree app to read full this article<
Get Radiology Tree app to read full this article<
Get Radiology Tree app to read full this article<
Chest Radiography
Get Radiology Tree app to read full this article<
Digital Chest Tomosynthesis
Get Radiology Tree app to read full this article<
Image Analysis
Get Radiology Tree app to read full this article<
Get Radiology Tree app to read full this article<
Get Radiology Tree app to read full this article<
CT
Get Radiology Tree app to read full this article<
Estimation of Effective Dose
Get Radiology Tree app to read full this article<
Get Radiology Tree app to read full this article<
Get Radiology Tree app to read full this article<
Statistical Analysis
Get Radiology Tree app to read full this article<
Get Radiology Tree app to read full this article<
Get Radiology Tree app to read full this article<
Results
Get Radiology Tree app to read full this article<
Table 1
Final Diagnoses
Diagnosis Number Mean Size (cm) § Dimension Range (cm) § Primary lung neoplasms ‡ 4 3.1 ± 0.9 2–4 Lung metastases † 13 2.1 ± 0.9 1–3 Parenchymal consolidations 80 2.5 ± 0.6 3–4 Pulmonary nodules 12 1.9 ± 0.8 0.5–1 Parenchymal scars 3 0.9 ± 0.7 0.5–1.3 Extrapulmonary lesions ∗ 68 0.9 ± 0.7 1–3 Pseudolesions 71 — — Total 251 2.3 ± 1.1 0.5–4
Chest computed tomography was the reference standard for the presence and correct location of each lesion.
Get Radiology Tree app to read full this article<
Get Radiology Tree app to read full this article<
Get Radiology Tree app to read full this article<
Get Radiology Tree app to read full this article<
Get Radiology Tree app to read full this article<
Get Radiology Tree app to read full this article<
Table 2
Results of Image Lesions
Variable Chest Radiography Tomosynthesis Reader 1 Sensitivity (%) 57 (64/112) 91 (102/112) Specificity (%) 33 (46/139) 90 (125/139) PPV (%) 40 (64/157) 87 (102/116) NPV (%) 49 (46/94) 92 (125/135) Accuracy (%) 43 (110/251) 90 (227/251) Diagnostic confidence (AUC) (95% CI) 0.788 (0.687–0.889) 0.944 (0.889–1) Reader 2 Sensitivity (%) 65 (73/112) 95 (106/112) Specificity (%) 36 (50/139) 90 (125/139) PPV (%) 45 (73/162) 88 (106/120) NPV (%) 56 (50/89) 95 (125/131) Accuracy (%) 49 (123/251) 92 (231/251) Diagnostic confidence (AUC) (95% CI) 0.840 (0.754–0.926) 0.997 (0.992–1)
AUC, area under the receiver-operating characteristic curve; CI, confidence interval; NPV, negative predictive value; PPV, positive predictive value.
Visual prospective analysis in the pulmonary lesion diagnosis, corresponding to the differentiation of parenchymal versus extraparenchymal lesions. All differences were statistically significant ( P < .05).
Get Radiology Tree app to read full this article<
Get Radiology Tree app to read full this article<
Get Radiology Tree app to read full this article<
Discussion
Get Radiology Tree app to read full this article<
Get Radiology Tree app to read full this article<
Get Radiology Tree app to read full this article<
Get Radiology Tree app to read full this article<
Get Radiology Tree app to read full this article<
Get Radiology Tree app to read full this article<
Get Radiology Tree app to read full this article<
Acknowledgments
Get Radiology Tree app to read full this article<
References
1. Wu N., Gamsu G., Czum J., et. al.: Detection of small pulmonary nodules using direct digital radiography and picture archiving and communication systems. J Thorac Imaging 2006; 21: pp. 27-31.
2. Bley T.A., Baumann T., Saueressig U., et. al.: Comparison of radiologist and CAD performance in the detection of CT-confirmed subtle pulmonary nodules on digital chest radiographs. Invest Radiol 2008; 43: pp. 343-348.
3. Rühl R., Wozniak M.M., Werk M., et. al.: CsI-detector-based dual-exposure dual energy in chest radiography for lung nodule detection: results of an international multicenter trial. Eur Radiol 2008; 18: pp. 1831-1839.
4. McAdams H.P., Samei E., Dobbins J., et. al.: Recent advances in chest radiography. Radiology 2006; 241: pp. 663-683.
5. Remy-Jardin M., Remy J., Giraud F., et. al.: Pulmonary nodules: detection with thick-section spiral CT versus conventional CT. Radiology 1993; 187: pp. 513-520.
6. Rubin G.D., Lyo J.K., Paik D.S., et. al.: Pulmonary nodules on multi-detector row CT scans: performance comparison of radiologists and computer-aided detection. Radiology 2005; 234: pp. 274-283.
7. Dobbins J.T., Godfrey D.J.: Digital x-ray tomosynthesis: current state of the art and clinical potential. Phys Med Biol 2003; 48: pp. R65-R106.
8. Dobbins J.T., McAdams H.P., Devon G., et. al.: Digital tomosynthesis of the chest. J Thorac Imaging 2008; 23: pp. 86-92.
9. Dobbins J.T., Mc Adams H.P., Song J.W., et. al.: Digital tomosynthesis of the chest for lung nodule detection: interim sensitivity results from an ongoing NIH-sponsored trial. Med Phys 2008; 35: pp. 2554-2557.
10. Vikgren J., Zachrisson S., Svalkvist A., et. al.: Comparison of chest tomosynthesis and chest radiography for detection of pulmonary nodules: human observer study of clinical cases. Radiology 2008; 249: pp. 1034-1041.
11. Hansell D.M., Bankier A., Mac Mahon H., et. al.: Fleischner Society: glossary of terms for thoracic imaging. Radiology 2008; 246: pp. 697-722.
12. Erasmus J.J., Connolly J.E., McAdams H.P., et. al.: Solitary pulmonary nodules. I. Morphologic evaluation for differentiation of benign and malignant lesions. Radiographics 2000; 20: pp. 43-58.
13. Gietema H.A., Wang Y., Xu D., et. al.: Pulmonary nodules detected at lung cancer screening: interobserver variability of semiautomated volume measurements. Radiology 2006; 241: pp. 251-257.
14. Servomaa A., Tapiovaara M.: Organ dose calculation in medical X ray examinations by the program PCXMC. Radiat Prot Dosimetry 1998; 80: pp. 213-219.
15. Cristy M., Eckerman K.R.: Specific absorbed fractions of energy at various ages from internal photon sources. I. Method. Publication No ORNL/TM-8381.1987.Oak Ridge National LaboratoryOak Ridge, TN
16. European guidelines on quality criteria for computed tomography. Report EUR 16262. Brussels, Belgium: European Commission, 1999. Available at: http://www.drs.dk/guidelines/ct/quality/mainindex.htm . Accessed January 30, 2010.
17. Campbell M.J., Machin D.: Medical statistics, a commonsense approach.1999.WileyChichester, United Kingdom
18. Beck J.R., Shultz E.K.: The use of relative operating characteristic (ROC) curves in test performance evaluation. Arch Pathol Lab Med 1986; 110: pp. 13-20.
19. Hanley J.A., McNeil B.J.: A method of comparing the areas under receiver operating characteristic curves derived from the same cases. Radiology 1983; 148: 839–443
20. Zhu X., Yu J., Huang Z.: Low-dose chest CT: optimizing radiation protection for patients. AJR Am J Roentgenol 2004; 183: pp. 809-816.
21. Gierada D.S., Pilgram T.K., Ford M., et. al.: Lung cancer: interobserver agreement on interpretation of pulmonary findings at low-dose CT screening. Radiology 2008; 246: pp. 265-272.
22. Li B., Avinash G.B.: Optimization of slice sensitivity profile for radiographic tomosynthesis. Med Phys 2007; 34: pp. 2907-2916.
23. Godfrey D.J., McAdams H.P., Dobbins J.T.: Optimization of the matrix inversion tomosynthesis (MITS) impulse response and modulation transfer function characteristics for chest imaging. Med Phys 2006; 33: pp. 655-667.
24. Revel M.P., Lefort C., Bissery A., et. al.: Pulmonary nodules: preliminary experience with three-dimensional evaluation. Radiology 2004; 231: pp. 459-466.
25. Kostis W.J., Yankelevitz D.F., Reeves A.P., et. al.: Small pulmonary nodules: reproducibility of three-dimensional volumetric measurement and estimation of time to follow-up CT. Radiology 2004; 231: pp. 446-452.