
Rationale and Objectives
To evaluate the ability of dynamic contrast-enhanced magnetic resonance imaging (MRI) to differentiate several tumor entities of the parotid gland in a prospective clinical trial.
Materials and Methods
A total of 112 patients with parotid tumors were examined with dynamic contrast-enhanced 1.5 T MRI. Precontrast axial T1-weighted imaging was used to select five slices for the dynamic study. Subsequently, a T1-weighted FLASH sequence was used for the dynamic contrast study (0.2 ml Gd/kg × body weight). Contrast agent application and the FLASH sequence were started simultaneously. Ten acquisitions of 10 seconds’ scan time each were performed (total acquisition time 1:40 minutes). Signal intensity versus time (SIvT) curves was obtained for all tumors. After correlation of the categorized SIvT curves, these were compared with histopathology. Finally, all MRIs together with the tumor specific SIvT curves were re-read and correlated with histopathologic diagnosis. All reading sessions were done by three experienced radiologists.
Results
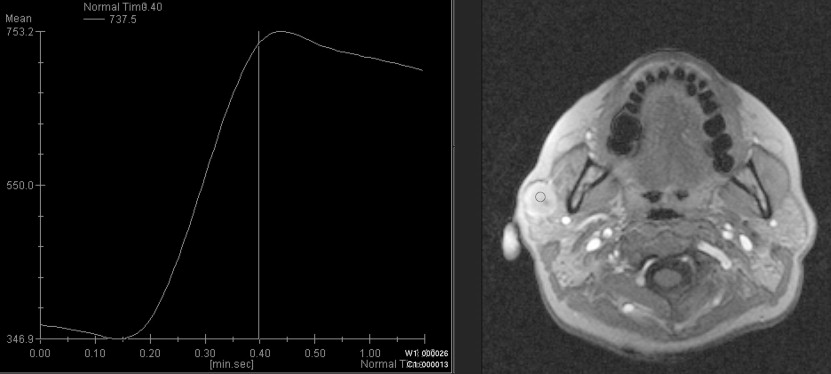
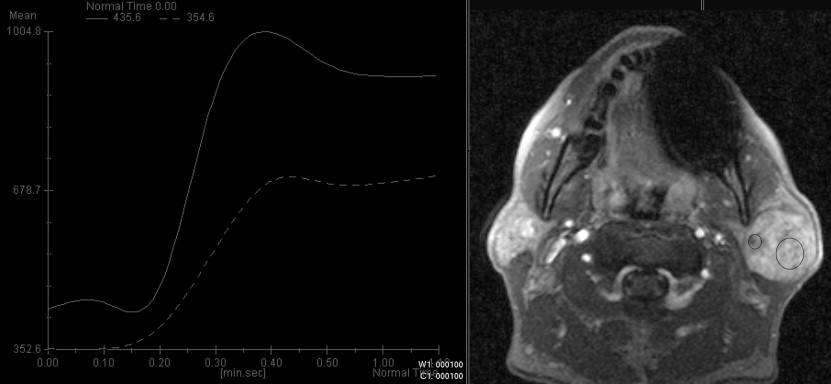
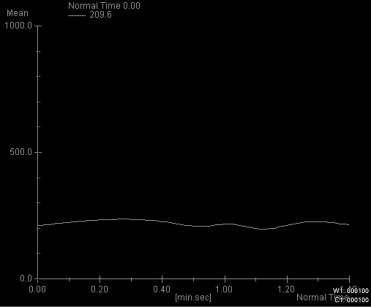
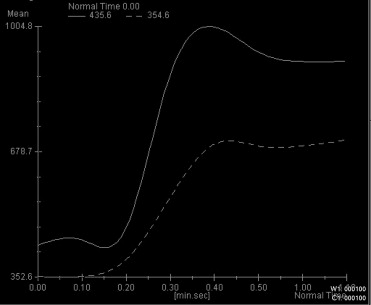
Four characteristic intensity-time curves were observed: pleomorphic adenoma showed a gradual increase in signal intensity, followed by a plateau phase on a low intensity level. Cysts showed a vacillating course at a low signal intensity level. Adenolymphomas as well as carcinomas showed a rapid increase in signal intensity followed by a plateau phase. Statistic significance was found for the time-to-peak values for adenolymphomas and pleomorphic adenomas and for the maximum peak signal intensity values for carcinomas. Together with other morphologic MRI criteria (contrast enhancement, border characteristics) and clinical features, a differentiation between adenolymphoma and carcinoma was possible.
Conclusions
With additional dynamic contrast-enhanced MRI, a more reliable differentiation between common parotid tumors is possible before surgery.
Salivary gland neoplasms account for about 0.5%–3% of all malignant tumors ( ), and most individuals suffer from some illness related to the salivary glands once in their lifetime—infectious as well as neoplastic or part of a systemic disease, acute or chronic ( ). Determining whether a parotid mass is benign or malignant is very important because it strongly influences therapy: if a tumor is benign, only partial or even extracapsular dissection might be indicated, whereas total or even radical parotidectomy including facial nerve resection is necessary whenever a malignant lesion is suspected.
The diagnostic strategy is a multimodal approach. The most inexpensive and well-established diagnostic tool after physical examination is ultrasound ( ). High sensitivities up to 100% are reported in literature for tumors arising in the superficial lobe of the parotid gland ( ). Ultrasound proved to be very suitable to differentiate between intra- versus extraglandular lesions. For tumors located in deeper parts of the gland, cross-sectional imaging such as computed tomography (CT) and magnetic resonance imaging (MRI) are necessary ( ). Since the 1980s, CT has become increasingly useful for demonstrating tumors of the salivary glands and their extent as well as differentiating tumors of the salivary glands from extrinsic lesions ( ). The limitations of CT, such as radiation and use of iodinated contrast agents with relatively high rate of side effects, encourage the use of MRI as the standard imaging modality for salivary gland tumors. The possibility of direct multiplanar imaging, excellent tissue contrast with better evaluation of the interfaces between muscle and tumor (which exhibit very similar density values in CT), and better differentiation of intrinsic versus extrinsic masses have made MRI the imaging modality of choice ( ). It has been shown that MRI studies are superior in detecting and determining the extent of disease in the setting of suspected salivary gland mass ( ). Most of these studies were done with 0.5 T magnets. The use of 1.5 T magnets improves image quality, because shorter acquisition times allow dynamic MRI studies that add precious information regarding tumor vascularization, perfusion, contrast uptake, and washout ( ). Yet it can be difficult to determine the tumor entity with conventional MRI studies.
Get Radiology Tree app to read full this article<
Get Radiology Tree app to read full this article<
Materials and methods
Get Radiology Tree app to read full this article<
Get Radiology Tree app to read full this article<
Get Radiology Tree app to read full this article<
Results
Get Radiology Tree app to read full this article<
Table 1
Tumor Entities and Distribution
Tumor Entity_n_ Proportion Pleomorphic adenoma 46 41.1% Adenolymphoma 24 21.4% Carcinoma 13 11.6% Lymph nodes 7 6.3% Oncocytoma 4 3.6% Hemangioma 3 2.7% Lymphangioma 3 2.7% Cysts 3 2.7% Sarcoidosis 2 1.8% Basal cell adenoma 2 1.8% Papillary cystadenoma 2 1.8% Angiomyoma 2 1.8% Scar tissue 1 0.9%
Get Radiology Tree app to read full this article<
Get Radiology Tree app to read full this article<
Get Radiology Tree app to read full this article<
Get Radiology Tree app to read full this article<
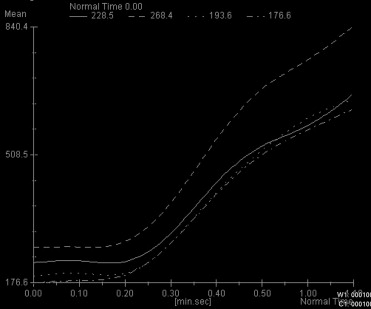
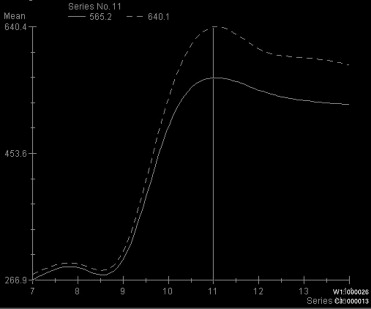
Table 2
Distribution of Time to Peak (TTP) Values Among Pleomorphic Adenomas
Variable Tumor_n_ Median Mean SD Min Q1 Q3 Max_P_ Value TTPs Others 58 49.00 80.59 57.05 18.00 41.00 110.00 335.00 Pleomorphic adenoma 43 110.00 99.93 30.00 43.00 100.00 110.00 205.00 .0011 TTPs Others 79 110.00 97.28 49.26 18.00 49.00 110.00 335.00 Adenolymphoma 22 47.00 58.45 28.75 32.00 41.00 67.00 151.00 <.001
Adenomas, adenolymphomas, and other entities and corresponding P values obtained from the Wilcoxon-Mann-Whitney U-test.
Table 3
Distribution of Peak Signal Intensities (SI) Values Among Pleomorphic Adenomas
Variable Tumor_n_ Median Mean SD Min Q1 Q3 Max_P_ Value Peak (SI) Others 57 480.00 511.42 241.25 84.20 342.20 692.40 1194.8 Pleomorphic adenomas 43 421.90 434.98 174.38 173.70 276.80 551.20 899.00 .1033 Peak (SI) Others 79 435.20 472.17 227.31 84.20 308.70 600.20 1194.8 Adeno-lymphoma 21 508.60 502.57 178.04 151.50 410.50 551.00 914.10 .3432
Adenomas, adenolymphomas, and other entities and corresponding P values obtained from the Wilcoxon-Mann-Whitney U-test.
Table 4
Optimal Cut Points from Receiver Operating Characteristic Analysis for Time to Peak (TTP)
Variable Cutpoint Sensitivity Specificity Youden TTPs for pleomorphic adenomas >50.00 0.884 0.517 0.401 TTPs for adenolymphoma <102.00 0.909 0.646 0.555
Table 5
Box Plots for Time to Peak Value of Pleomorphic Adenomas and Adenolymphomas

Get Radiology Tree app to read full this article<
Get Radiology Tree app to read full this article<
Get Radiology Tree app to read full this article<
Get Radiology Tree app to read full this article<
Get Radiology Tree app to read full this article<
Get Radiology Tree app to read full this article<
Table 6
\* P Value of the Wilcoxon-Mann-Whitney Test for Comparison with Malignant Tumors, Respectively
Variable Tumor_n_ Median Mean SD Min Q1 Q3 Max_P_ Value* Peak (signal intensity) All benign 88 446.00 453.86 205.50 84.20 304.35 557.60 1194.80 .0049 Adenolymphoma 21 508.60 502.57 178.04 151.50 410.50 551.00 914.10 .0724 Pleomorphic adenomas 43 421.90 434.98 174.38 173.70 276.80 551.20 899.00 .0033 Malignant 12 643.00 659.64 225.32 333.50 455.10 880.65 987.70 Time to peak (s) All benign 89 103.00 84.92 38.60 18.00 47.00 110.00 207.00 .4098 Adenolymphoma 22 47.00 58.45 28.75 32.00 41.00 67.00 151.00 .0833 Pleomorphic adenomas 43 110.00 99.93 30.00 43.00 100.00 110.00 205.00 .9654 Malignant 12 106.50 117.75 90.49 35.00 43.00 153.50 335.00
Table 7
Optimal Cut Points from the Receiver Operating Characteristic Analysis for Peak Signal Intensity of Malignant Tumors
Variable Cutpoint Sensitivity Specificity Youden Peak (signal intensity) 710.50 0.500 0.909 0.409
Table 8
Box Plots for Peak Signal Intensity Values of Malignant and Benign Tumors

Get Radiology Tree app to read full this article<
Get Radiology Tree app to read full this article<
Table 9
Classification of Benign/Malignant Tumors by Conventional Magnetic Resonance Imaging
Conventional Magnetic Resonance Imaging Diagnosis Histopathologic Finding_n_ Benign Malignant Benign 98 8 106 Malignant 1 5 6n 99 13 112
Get Radiology Tree app to read full this article<
Get Radiology Tree app to read full this article<
Table 10
Correct/False Classifications on Conventional Magnetic Resonance Imaging
Magnetic Resonance Imaging Diagnosis Histopathology Finding_n_ Adenolymphoma Pleomorphic Adenoma Others Adenolymphoma 6 3 6 15 Pleomorphic adenoma 13 41 16 70 Others 5 2 20 27n 24 46 42 112
Get Radiology Tree app to read full this article<
Get Radiology Tree app to read full this article<
Get Radiology Tree app to read full this article<
Discussion
Get Radiology Tree app to read full this article<
Get Radiology Tree app to read full this article<
Table 11
Tumor Signal Characteristics on T2-Weighted/T1-Weighted/T1-Weighted + GD Images
Tumor Entity T2-weighted T1-weighted T1-weighted + GD Adenolymphoma Low/intermediate Low/intermediate High Pleomorphic adenoma High Low Intermediate Carcinoma High Low High
Get Radiology Tree app to read full this article<
Get Radiology Tree app to read full this article<
Get Radiology Tree app to read full this article<
Get Radiology Tree app to read full this article<
Get Radiology Tree app to read full this article<
Get Radiology Tree app to read full this article<
Get Radiology Tree app to read full this article<
Get Radiology Tree app to read full this article<
Conclusion
Get Radiology Tree app to read full this article<
Get Radiology Tree app to read full this article<
Get Radiology Tree app to read full this article<
References
1. Yousem D.M., Kraut M.A., Chalian A.A.: Major salivary gland imaging. Radiology 2000; 216: pp. 19-29.
2. Donath K., Ussmuller J.: Aetiopathogenese und histopathologie der speicheldruesenerkrankungen. Laryngo-Rhino-Otol 2001; 80: pp. 1-25.
3. Greess H., Lell M., Römer W., et. al.: Indikation und aussagekraft von CT und MRT im Kopf-Hals-Bereich. HNO 2002; 50: pp. 611-625.
4. Licitra L., Grande C., Prott F.J., et. al.: Major and minor salivary gland tumors. Crit Rev Oncol Hematol 2003; 45: pp. 215-225.
5. Zenk J., Iro H.: Doppler-und farbkodierte duplexsonographie im Kopf-Hals-Bereich.Kopf-Hals-Sonographie.2000.Springer VerlagBerlin:pp. 75-96.
6. Gritzmann N., Rettenbacher T., Hollerweger A., et. al.: Sonography of the salivary glands. Eur Radiol 2003; 13: pp. 964-975.
7. Casselman J.W., Mancuso A.A.: Major salivary glands masses; comparison of MR imaging and CT. Radiology 1987; 165: pp. 183-189.
8. Mancuso A.A., Hanefee W.N.: Salivary glands.Computed tomography and magnetic resonance imaging of the head and neck.1985.Williams and WilkinsBaltimore:pp. 139-160.
9. Som P.M., Saunders D.E.: The salivary glands.Bergeron R.T.Osborn A.G.Som P.M.Head and neck imaging excluding the brain.1986.MosbySt Louis, Mo:pp. 186-234.
10. Lev M.H., Khanduja K., Morris P.P., et. al.: Parotid pleomorphic adenomas: delayed CT enhancement. AJNR Am J Neuroradiol 1998; 19: pp. 1935-1939.
11. Szolar D.H., Groell R., Braun H.: Ultrafast computed tomography and three-dimensional image processing of CT sialography in patients with parotid masses poorly defined by magnetic resonance imaging. Acta Otolaryngol (Stockh) 1996; 116: pp. 112-118.
12. Paris J., Facon F., Pascal T., et. al.: Preoperative diagnostic values of fine-needle cytology and MRI in parotid gland tumors. Eur Arch Otorhinolaryngol 2005; 262: pp. 27-31.
13. Yabuuchi H., Fukuya T., Tajima T., et. al.: Salivary gland tumors: diagnostic value of gadolinium-enhanced dynamic MR imaging with histopathologic correlation. Radiology 2003; 226: pp. 345-354.
14. Koyuncu M., Sesen T., Akan H., et. al.: Comparison of computed tomography and magnetic resonance imaging in the diagnosis of parotid tumors. Otolaryngol Head Neck 2003; 129: pp. 726-732.
15. Fischer T., Filimonow S., Petersein J., et. al.: Diagnosis of Heerfordt’s syndrome by state-of-the-art ultrasound in combination with parotid biopsy: a case report. Eur Radiol 2002; 12: pp. 134-137.
16. Kinoshita T., Ishii K., Naganuma H.: MR imaging findings of parotid tumors with pathologic diagnostic clues. J Clin Imaging 2004; 28: pp. 93-101.
17. Vogl T.J., Dresel S.H., Grevers G., et. al.: Sjoegren’s syndrome: MR imaging of the parotid gland. Eur Radiol 1996; 6: pp. 46-51.
18. Shah G.V.: MR imaging of salivary glands. Neuroimaging Clin N Am 2004; 14: pp. 777-808.
19. Som P.M., Sacher M., Stollman A.L.: Common tumors of the parapharyngeal space: refined imaging diagnosis. Radiology 1998; 169: pp. 81-85.
20. Kaneda T., Minami M., Ozawa K.: Imaging tumors of the minor salivary glands. Oral Radiol Endocrinol 2003; 78: pp. 385-390.
21. Okahara M., Kiyosue H., Hori Y., et. al.: Parotid tumors: MR imaging with pathological correlation. Eur Radiol 2003; 13: pp. 25-33.
22. Shah G.V., Fischbein N.J., Patel R., et. al.: Newer MR imaging techniques for head and neck. Magn Reson Imaging Clin N Am 1979; 11: pp. 449-469.
23. Batsakis J.G.: Tumors of the major salivary glands.Batsakis J.G.Tumors of the head and neck, clinical and pathological considerations.1979.Williams & WilkinsBaltimore, Md:pp. 1-75.
24. Koral K., Sayre J., Bhuta S., et. al.: Recurrent pleomorphic adenoma of the parotid gland in pediatric and adult patients: value of multiple lesions as a diagnostic indicator. AJR Am J Roentgenol 2003; 180: pp. 1171-1174.
25. Ikeda K., Katoh T., Ha-Kawa S.K., et. al.: The usefulness of MR in establishing the diagnosis of parotid pleomorphic adenoma. Am J Neuroradiol 1996; 17: pp. 555-559.
26. Tsushima Y., Matsumoto M., Endo K., et. al.: Characteristic bright signal of parotid pleomorphic adenomas on T2-weighted MR images with pathological correlation. Clin Radiol 1994; 49: pp. 485-489.
27. Hisatomi M., Asaumi J., Konouchi H., et. al.: Assessment of dynamic MRI of Warthin’s tumors arising as multiple lesions in the parotid glands. Oral Oncol 2002; 38: pp. 369-372.
28. Som P.M., Biller H.F.: High-grade malignancies of the parotid gland: identification with MR imaging. Radiology 1989; 173: pp. 823-826.
29. Sigal R., Monnet O., de Baere T.: Adenoid cystic carcinoma of the head and neck: evaluation with MR imaging and clinical-pathologic correlation in 27 patients. Radiology 1992; 184: pp. 95-101.
30. Freling N.J., Molenaar W.M., Vermey A.: Malignant parotid tumors: clinical use of MR imaging and histologic correlation. Radiology 1992; 185: pp. 691-696.
31. Swartz J.D., Rothman M.I., Marlowe F.I.: MR imaging of parotid mass lesions: attempts at histopathologic differentiation. J Comput Assist Tomogr 1989; 13: pp. 789-796.
32. Wang J., Takashima S., Takayama F., et. al.: Head and neck lesions: characterization with diffusion-weighted echo-planar MR imaging. Radiology 2001; 220: pp. 621-630.
33. Sakamoto M., Sasano T., Higano S., et. al.: Usefulness of heavily T2 weighted magnetic resonance images for the differential diagnosis of parotid tumors. Dentomaxill Radiol 2003; 32: pp. 295-299.