
Rationale and Objectives
To assess the diagnostic performance of magnetic resonance imaging (MRI) for targeting prostate cancer in patients with previous negative biopsies and elevated prostate-specific antigen (PSA) levels.
Materials and Methods
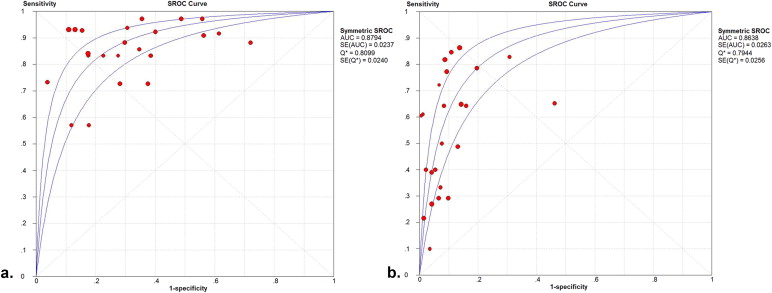
Pubmed, Scopus, and Cochrane Library databases were searched to identify suitable studies published from January 2001 to October 2013. Polled estimation and subgroup analysis data were obtained using a random effect model. Summary receiver operating characteristic curves were used to summarize overall test performance.
Results
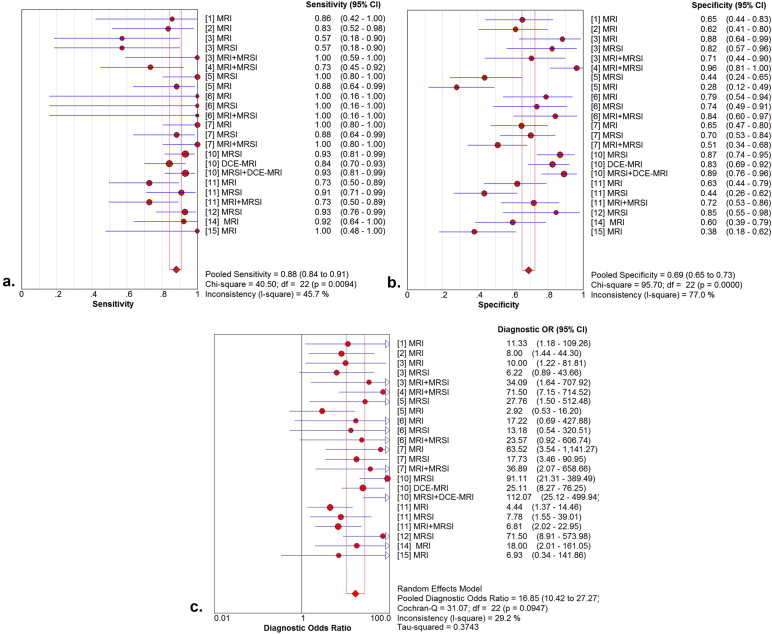
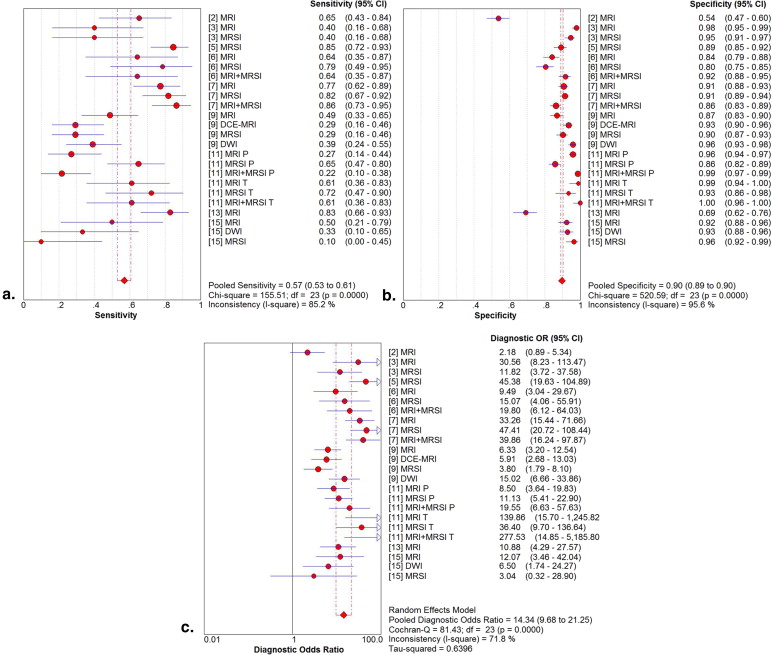
Fourteen studies involving 698 patients met the included criteria. The mean prostate cancer detection rate was 37.5%. Twelve studies had a pooled sensitivity, specificity, and diagnostic odds ratio (DOR) of 88%, 69%, and 16.84 by patient analysis, respectively. In the subgroup analysis, magnetic resonance imaging spectroscopy (MRSI) provided higher pooled sensitivity (91%) and specificity (69%) compared with T2-weighted imaging (T2WI). MRSI combined with MRI had the highest pooled specificity (73%). By site analysis, the pooled sensitivity, specificity, and DOR in nine studies were 57%, 90%, and 14.34, respectively. In the subgroup analysis, MRSI combined with MRI showed higher pooled sensitivity (58%) and specificity (93%) compared with T2WI. Diffusion-weighted MRI (DWI) showed the highest pooled specificity: 95% but the lowest pooled sensitivity: 38%.
Conclusions
A limited number of studies suggest that the value of MRI to target prostate cancer in patients with previous negative biopsies and elevated PSA levels appears significant. MRI combined with MRSI is particularly accurate. Further studies are necessary to confirm the eventual role of DWI in this field.
Prostate cancer is the most common malignancy in the Western European countries and the second cause of cancer-related fatality among male population in the United States, and the incidence has increased significantly in the developing world . At present, the diagnosis of prostate cancer is mainly based on the digital rectal examination (DRE) and evaluation of the serum prostate-specific antigen (PSA) levels. Abnormal findings are usually followed up by transrectal ultrasound (TRUS)–guided biopsy . Random biopsies of the prostate by TRUS stand for the gold standard of prostate cancer detection for patients with elevated PSA levels. However, because of the high false-negative rates and very low false-positive rates of initial TRUS-guided biopsy (TRUS-GB), patients may still have cancer despite a negative biopsy . Patients with previous negative biopsy results and persistently increasing PSA levels require repeat biopsies, which negatively affect their quality of life. A number of different techniques for prostate repeat biopsy have been developed, including saturation biopsy or active surveillance of PSA. It has been shown that the use of saturation biopsy techniques, which obtain greater number of prostate cores, has no advantage over standard TRUS-GB with respect to cancer detection rate . Furthermore, PSA monitoring may miss the significant prostate cancer . In addition, PSA-based screening is inadequate for detecting prostate cancer at earlier stages according to the recommendation of the U.S. Preventive Services Task Force.
Magnetic resonance imaging (MRI) has developed rapidly and gives the potential to improve prostate cancer diagnosis. MRI has a higher sensitivity for detecting prostate cancer than TRUS. Some attempts have been made to use MRI for MRI-guided biopsies (MRI-GB). Several studies have reported the use of MRI-GB with the patient in the prone position . However, MRI-GB is not commonly available and has some disadvantages as compared to TRUS-GB. The procedures are time-consuming and costly, and the prone position makes patient uncomfortable, especially for elderly or sick patients . Targeted prostate biopsy, which uses findings from MRI to guide needle aiming, may help to establish correct diagnosis for patients with prior negative biopsy. Using MRI to target suspicious areas on repeat biopsy might improve the chances of detecting a significant cancer. Targeting biopsies might also avoid saturation biopsy. It also has the advantage on detecting prostate cancers missed previously, particularly those outside the peripheral zone . Nowadays, the use of T1- and T2-weighted MRI, diffusion-weighted MRI (DWI), MR spectroscopy imaging (MRSI), dynamic contrast-enhanced MRI (DCE-MRI), and various combinations of these in multiparametric imaging protocols have been reported for the identification of prostatic lesions for targeted biopsy . The objective of this study was to summarize the currently available bulk of information to assess the diagnostic efficacy of MRI for targeting cancer in patients with previous prostate negative biopsies and persistently elevated PSA levels.
Materials and methods
Literature Search
Get Radiology Tree app to read full this article<
Inclusion and Exclusion Criteria
Get Radiology Tree app to read full this article<
Data Extraction and Quality Assessment
Get Radiology Tree app to read full this article<
Table 1
Quality Evaluation of Included Studies Using the Quality Assessment of Diagnostic Accuracy Studies (QUADAS) Tool
Included Studies 1 2 3 4 5 6 7 8 9 10 11 12 13 14 Perrotti et al. Y Y Y U Y Y Y Y Y Y U Y Y Y Beyersdorff et al. Y Y Y Y N Y Y Y Y Y U Y Y Y Yuen et al. Y Y Y U Y Y Y Y Y Y U Y Y Y Amsellem et al. Y Y Y Y Y Y Y Y Y Y U Y Y Y Prando et al. Y Y Y U Y Y Y Y Y Y U Y Y Y Bhatia et al. Y Y Y Y Y Y Y Y Y Y U Y Y Y Cirillo et al. Y Y Y Y Y Y Y Y Y Y U Y Y Y Portalez et al. Y Y Y Y Y Y Y Y Y Y U Y Y Y Sciarra et al. Y Y Y Y Y Y Y Y Y Y Y Y Y Y Testa et al. Y Y Y Y N Y Y Y Y Y Y Y Y Y Panebianco et al. Y Y Y U N Y Y Y Y Y U Y Y Y Girometti et al. Y Y Y Y Y Y Y Y Y Y U Y Y Y costa et al. Y Y Y N Y Y Y Y Y Y Y Y Y Y Scheidler et al. Y Y Y N N Y Y Y N Y U Y Y Y
MRI, magnetic resonance imaging; N, No; U, Unclear; Y, Yes.
1, patients spectrum; 2, selection criteria; 3, reference standard; 4, absence of disease progression bias; 5, absence of partial verification bias; 6, same reference standard; 7, absence of incorporation bias; 8, description of MRI execution; 9, description of reference standard execution; 10, MRI blinded from reference; 11, reference blinded from MRI; 12, same clinical data available; 13, uninterpretable test results reported; and 14, withdrawal.
Get Radiology Tree app to read full this article<
Get Radiology Tree app to read full this article<
Data Synthesis and Analysis
Get Radiology Tree app to read full this article<
Get Radiology Tree app to read full this article<
Get Radiology Tree app to read full this article<
Get Radiology Tree app to read full this article<
Get Radiology Tree app to read full this article<
Get Radiology Tree app to read full this article<
Results
Literature Search and Selection of Studies
Get Radiology Tree app to read full this article<
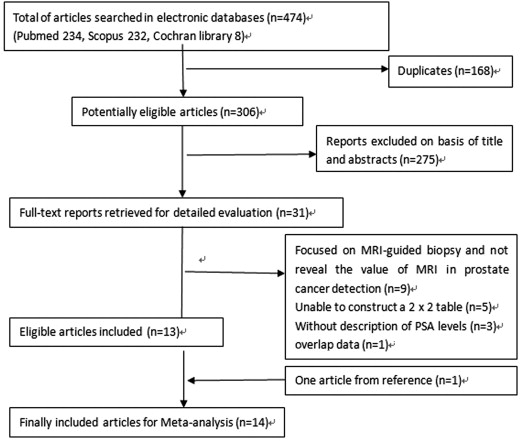
Get Radiology Tree app to read full this article<
Study Description, Study Quality, and Publication Bias
Get Radiology Tree app to read full this article<
Table 2
The Characteristics of 14 Eligible Studies
Author et al. year Number of Patients Age (Range) Detection Rate (%) PSA (Range), ng/mL Field Strength Reference Standard Blind Perrotti et al. 1999 33 63 (45–75) 21.20 11.7 (4.8–36) ND Biopsy Blind Beyersdorff et al. 2002 44 64.6 (46–76) 31.60 13.9 (4–53) 1.5T Biopsy Blind Yuen et al. 2004 24 64.5 (58–69) 29.20 11.7 (4–40) 1.5T Biopsy Blind Amsellem et al. 2005 42 62.3 (54–74) 35.70 12 (3.9–35) 1.5T Biopsy No Prando et al. 2005 42 63.3 (45–75) 40.50 6.8 (4.1–15.3) 1.5T Biopsy ND Bhatia et al. 2007 21 61.4 (50–77) 9.50 13.1 (4.3–46.6) 1.5T Biopsy ND Cirillo et al. 2008 54 65.4 (±5.2) 31.40 10.8 (±7.5) 1.5T Biopsy Blind Portalez et al. 2010 68 62.4 (49–76) 41.20 9.2 (1.6–25) 1.5T Biopsy ND Sciarra et al. 2010 90 63.5 (49–74) 48.90 6.2 (4.0–9.3) 1.5T Biopsy Blind Testa et al. 2010 58 63.9 (52–76) 40.70 11.4 (3–42) 1.5T Biopsy Blind Panebianco et al. 2011 43 60.3 (48–69) 68.30 6.4 (4–10) 3.0T Biopsy ND Scheidler et al. 2012 115 ND 32.80 6.2 (2.3–39.6) 1.5T Biopsy ND costa et al. 2013 38 64 (48–77) 34.20 14.4 (1.8–33.1) 3.0T Biopsy Blind Girometti et al. 2012 26 64 (51–74) 19.20 5.9 (2.5–9.7) 3.0T Biopsy ND
Rounds of Previous Negative Biopsies Type of Coil Repeat Biopsy Interval Between Last Biopsy and MRI Interval Between Repeat Biopsy and MRI MRI Protocol Consecutive Patients 2 (1–7) Endorectal surface coil 6-core + some multiple biopsies 6 months (2 weeks–1 year ND MRI Consecutive 2.2 (1–6) Endorectal and body phased-array coil 8-core + ≥1-core from MRI 9.3 months (6 weeks–36 months) 1 day–3 months MRI Consecutive 1.2 (1–3) Endorectal and phased-array torso surface coil 10-core + focused cores ND At least 1 week MRI MRSI Consecutive 2.0 (1–4) Endorectal coil 10-core + targeted cores (1–4) ND Immediately MRI MRSI Consecutive 3.5 (2–6) Body and pelvic phased-array and balloon-covered endorectal coil 12-core + focused cores >2 months ND MRI MRSI Consecutive 1.3 (1–3) Body and pelvic phased-array coil, balloon-covered endorectal coil 12-core + targeted cores (1–4) At least 8 weeks Within 1 month MRI MRSI Consecutive 1.5 (1–3) Pelvic phased-array coil balloon-covered endorectal coil 10-core + targeted cores (1–3) 46.8 (9–196 weeks) Within 1 month MRI MRSI Consecutive 1.14 (1–4) Endorectal-pelvic coil sensitivity encoding (SENSE) cardiac coil 8-core + 2 additional suspicious areas 6–13 months 2–22 days MRI MRSI DCE-MRI DWI Consecutive 1 Phased-array surface and expandable endorectal coil 10-core + targeted biopsies of suspicious areas At least 30 days Within 2 weeks MRI MRSI DCE-MRI Consecutive 1.7 (1–4) Body and endorectal, pelvic phased-array coil MRI/MRSI-directed cores>12 6–24 months Within 3 months MRI MRSI Consecutive 1 Phased-array surface and endorectal radio frequency coil 10-core + 3 suspicious areas ND ND MRI MRSI DCE-MRI Consecutive ND Phased-array coil and endorectal coil Systematic biopsy At least 8 weeks Within 1 year MRI Consecutive 2.0–5.0 Endorectal coil Systematic biopsy + suspicious areas 16 months 1 month (1 day–22 months) MRI DCE-MRI No At least 1 2-channels high-resolution loop coils 8-core + additional cores of suspicious areas Within 6 months 1.46 months (1 day–4.9 months) MRI MRSI DWI Consecutive
DCE, dynamic contrast-enhanced; DWI, diffusion-weighted MRI; MRI, magnetic resonance imaging; MRSI, magnetic resonance spectrographic imaging; ND, not documented; PSA, prostate-specific antigen.
Get Radiology Tree app to read full this article<
Get Radiology Tree app to read full this article<
Get Radiology Tree app to read full this article<
Summary Estimates of Sensitivity, Specificity, and DOR
Get Radiology Tree app to read full this article<
Table 3
True-positive (TP), False-positive (FP), False-negative (FN), and True-negative (TN) values, Sensitivity, Specificity, Positive Predictive Value (PPV), and Negative Predictive Value (NPV)
Reference Year TP FP FN TN Sensitivity Specificity PPV NPV By patient analysis MRI 1999 6 9 1 17 86 65 40 94 MRI 2002 10 10 2 16 83 62 50 89 MRI 2004 4 2 3 15 57 88 67 83 MRSI 2004 4 3 3 14 57 82 57 82 MRI + MRSI 2004 7 5 0 12 100 71 58 100 MRI + MRSI 2005 11 1 4 26 73 96 92 87 MRSI 2005 17 14 0 11 100 44 55 100 MRI 2005 15 18 2 7 88 28 45 78 MRI 2007 2 4 0 15 100 79 33 100 MRSI 2007 2 5 0 14 100 74 29 100 MRI + MRSI 2007 2 3 0 16 100 84 40 100 MRI 2008 17 13 0 24 100 65 57 100 MRSI 2008 15 11 2 26 88 70 58 93 MRI + MRSI 2008 17 18 0 19 100 51 49 100 MRSI 2010 41 6 3 40 93 87 87 93 DCE-MRI 2010 37 8 7 38 84 83 82 84 DCE-MRI + MRSI 2010 41 5 3 41 93 89 89 93 MRI 2010 16 12 6 20 73 63 57 77 MRSI 2010 20 18 2 14 91 44 53 88 MRI + MRSI 2010 16 9 6 23 73 72 64 79 MRSI 2011 26 2 2 11 93 85 93 85 MRI 2013 12 10 1 15 92 60 55 94 MRI 2012 5 13 0 8 100 38 28 100 By site analysis MRI 2002 15 115 8 134 65 54 12 94 MRI 2004 6 6 9 275 40 98 50 97 MRSI 2004 6 15 9 266 40 95 29 97 MRSI 2005 44 32 8 264 85 89 58 97 MRSI 2007 11 54 3 222 79 84 17 99 MRI 2007 9 44 5 232 64 80 17 98 MRI + MRIS 2007 9 23 5 253 64 92 28 98 MRI 2008 34 46 10 450 77 91 43 98 MRSI 2008 36 43 8 453 82 91 46 98 MRI + MRIS 2008 38 68 6 428 86 86 36 99 MRI 2010 20 48 21 319 49 87 29 94 DCE-MRI 2010 12 24 29 343 29 93 33 92 MRSI 2010 12 36 29 331 29 90 25 92 DWI 2010 16 15 25 352 39 96 52 93 MRI PZ 2010 10 21 27 482 27 96 32 95 MRSI PZ 2010 24 69 13 416 65 86 26 97 MRI + MRIS PZ 2010 8 7 29 496 22 99 53 94 MRI TZ 2010 11 1 7 89 61 99 92 93 MRSI TZ 2010 13 6 5 84 72 93 68 94 MRI + MRIS TZ 2010 11 0 7 90 61 100 100 93 MRI 2012 29 60 6 135 83 69 33 96 MRI 2012 6 15 6 181 50 92 29 97 DWI 2012 4 14 8 182 33 93 22 96 MRSI 2012 1 5 9 137 10 96 17 94
DCE, dynamic contrast-enhanced; DWI, diffusion-weighted MRI; MRI, magnetic resonance imaging; MRSI, magnetic resonance spectrographic imaging.
Get Radiology Tree app to read full this article<
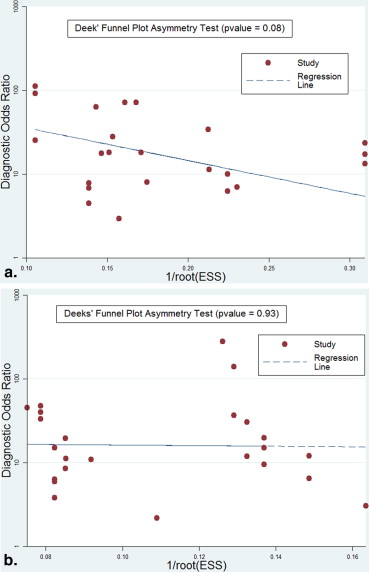
Threshold Effect, Heterogeneity Assessment, and Summary Receiver Operating Characteristic Curves
Get Radiology Tree app to read full this article<
Get Radiology Tree app to read full this article<
Subgroup Analysis
Get Radiology Tree app to read full this article<
Table 4
Subgroup Analysis
Subgroup Summary Sensitivity (95% CI) Summary Specificity (95% CI) Summary Diagnostic Odds Ratio (DOR) (95% CI) By patient analysis overall 88% (84%–91%) 69% (65%–73%) 16.85 (10.42–27.27) MRI 85% (77%–92%) 60% (53%–67%) 7.44 (3.88–14.27) MRSI 91% (85%–95%) 69% (62%–75%) 22.55 (9.46–53.73) MRI + MRSI 84% (73%–92%) 73% (64%–80%) 15.98 (6.04–42.27) By site analysis overall 57% (53%–61%) 90% (89%–90%) 14.34 (9.68–21.25) MRI 59% (52%–65%) 87% (85%–88%) 11.88 (6.15–22.94) MRSI 64% (57%–70%) 89% (88%–91%) 15.58 (7.29–33.30) MRI + MRSI 58% (49%–68%) 93% (91%–94%) 29.79 (14.65–60.61) DWI 38% (25%–52%) 95% (93%–97%) 11.68 (5.50–24.78)
DWI, diffusion-weighted MRI; MRI, magnetic resonance imaging; MRSI, magnetic resonance spectrographic imaging.
Get Radiology Tree app to read full this article<
Discussion
Get Radiology Tree app to read full this article<
Get Radiology Tree app to read full this article<
Get Radiology Tree app to read full this article<
Get Radiology Tree app to read full this article<
Get Radiology Tree app to read full this article<
Get Radiology Tree app to read full this article<
Get Radiology Tree app to read full this article<
References
1. Center M.M., Jemal A., Lortet-Tieulent J., et. al.: International variation in prostate cancer incidence and mortality rates. Eur Urol 2012; 61: pp. 1079-1092.
2. Siegel R., Ward E., Brawley O., et. al.: Cancer statistics, 2011: the impact of eliminating socioeconomic and racial disparities on premature cancer deaths. CA Cancer J Clin 2011; 61: pp. 212-236.
3. Wolf A.M., Wender R.C., Etzioni R.B., et. al.: American Cancer Society guideline for the early detection of prostate cancer: update 2010. CA Cancer J Clin 2010; 60: pp. 70-98.
4. Haas G.P., Delongchamps N., Brawley O.W., et. al.: The worldwide epidemiology of prostate cancer: perspectives from autopsy studies. Can J Urol 2008; 15: pp. 3866-3871.
5. Aigner F., Pallwein L., Junker D., et. al.: Value of real-time elastography targeted biopsy for prostate cancer detection in men with prostate specific antigen 1.25 ng/ml or greater and 4.00 ng/ml or less. J Urol 2010; 184: pp. 913-917.
6. Eichler K., Hempel S., Wilby J., et. al.: Diagnostic value of systematic biopsy methods in the investigation of prostate cancer: a systematic review. J Urol 2006; 175: pp. 1605-1612.
7. Luciani L.G., De Giorgi G., Valotto C., et. al.: Role of transperineal six-core prostate biopsy in patients with prostate-specific antigen level greater than 10 ng/mL and abnormal digital rectal examination findings. Urology 2006; 67: pp. 555-558.
8. Finne P., Auvinen A., Maattanen L., et. al.: Diagnostic value of free prostate-specific antigen among men with a prostate-specific antigen level of <3.0 microg per liter. Eur Urol 2008; 54: pp. 362-370.
9. Pondman K.M., Futterer J.J., ten Haken B., et. al.: MR-guided biopsy of the prostate: an overview of techniques and a systematic review. Eur Urol 2008; 54: pp. 517-527.
10. Tempany C., Straus S., Hata N., et. al.: MR-guided prostate interventions. J Magn Reson Imaging 2008; 27: pp. 356-367.
11. Schouten M.G., Bomers J.G., Yakar D., et. al.: Evaluation of a robotic technique for transrectal MRI-guided prostate biopsies. Eur Radiol 2012; 22: pp. 476-483.
12. Hambrock T., Hoeks C., Hulsbergen-van de Kaa C., et. al.: Prospective assessment of prostate cancer aggressiveness using 3-T diffusion-weighted magnetic resonance imaging-guided biopsies versus a systematic 10-core transrectal ultrasound prostate biopsy cohort. Eur Urol 2012; 61: pp. 177-184.
13. Sciarra A., Panebianco V., Ciccariello M., et. al.: Value of magnetic resonance spectroscopy imaging and dynamic contrast-enhanced imaging for detecting prostate cancer foci in men with prior negative biopsy. Clinical cancer research 2010; 16: pp. 1875-1883.
14. Cirillo S., Petracchini M., Della Monica P., et. al.: Value of endorectal MRI and MRS in patients with elevated prostate-specific antigen levels and previous negative biopsies to localize peripheral zone tumours. Clin Radiol 2008; 63: pp. 871-879.
15. Prando A., Kurhanewicz J., Borges A.P., et. al.: Prostatic biopsy directed with endorectal MR spectroscopic imaging findings in patients with elevated prostate specific antigen levels and prior negative biopsy findings: early experience. Radiology 2005; 236: pp. 903-910.
16. Michael Seitz A.S.-D., Bjartell A., et. al.: Functional magnetic resonance imaging in prostate cancer. Eur Urol 2009; 55: pp. 801-814.
17. Whiting P., Rutjes A.W., Reitsma J.B., et. al.: The development of QUADAS: a tool for the quality assessment of studies of diagnostic accuracy included in systematic reviews. BMC Med Res Methodol 2003; 3: pp. 25.
18. Harbord R.M., Deeks J.J., Egger M., et. al.: A unification of models for meta-analysis of diagnostic accuracy studies. Biostatistics 2007; 8: pp. 239-251.
19. Higgins J.P., Thompson S.G., Deeks J.J., et. al.: Measuring inconsistency in meta-analyses. BMJ 2003; 327: pp. 557-560.
20. Zamora J., Abraira V., Muriel A., et. al.: Meta-DiSc: a software for meta-analysis of test accuracy data. BMC Med Res Methodol 2006; 6: pp. 31.
21. Perrotti M., Han K.R., Epstein R.E., et. al.: Prospective evaluation of endorectal magnetic resonance imaging to detect tumor foci in men with prior negative prostastic biopsy: a pilot study. J Urol 1999; 162: pp. 1314-1317.
22. Beyersdorff D., Taupitz M., Winkelmann B., et. al.: Patients with a history of elevated prostate-specific antigen levels and negative transrectal US-guided quadrant or sextant biopsy results: value of MR imaging. Radiology 2002; 224: pp. 701-706.
23. Yuen J.S.P., Thng C.H., Tan P.H., et. al.: Endorectal magnetic resonance imaging and spectroscopy for the detection of tumor foci in men with prior negative transrectal ultrasound prostate biopsy. J Urol 2004; 171: pp. 1482-1486.
24. Amsellem-Ouazana D., Younes P., Conquy S., et. al.: Negative prostatic biopsies in patients with a high risk of prostate cancer: is the combination of endorectal MRI and magnetic resonance spectroscopy imaging (MRSI) a useful tool? A preliminary study. Eur Urol 2005; 47: pp. 582-586.
25. Bhatia C., Phongkitkarun S., Booranapitaksonti D., et. al.: Diagnostic accuracy of MRI/MRSI for patients with persistently high PSA levels and negative TRUS-guided biopsy results. J Med Assoc Thai 2007; 90: pp. 1391-1399.
26. Portalez D., Rollin G., Leandri P., et. al.: Prospective comparison of T2w-MRI and dynamic-contrast-enhanced MRI, 3D-MR spectroscopic imaging or diffusion-weighted MRI in repeat TRUS-guided biopsies. Eur Radiol 2010; 20: pp. 2781-2790.
27. Testa C., Schiavina R., Lodi R., et. al.: Accuracy of MRI/MRSI-based transrectal ultrasound biopsy in peripheral and transition zones of the prostate gland in patients with prior negative biopsy. NMR Biomed 2010; 23: pp. 1017-1026.
28. Panebianco V., Sciarra A., De Berardinis E., et. al.: PCA3 urinary test versus 1H-MRSI and DCEMR in the detection of prostate cancer foci in patients with biochemical alterations. Anticancer Res 2011; 31: pp. 1399-1405.
29. Scheidler J., Weres I., Brinkschmidt C., et. al.: Diagnosis of prostate cancer in patients with persistently elevated PSA and tumor-negative biopsy in ambulatory care: Performance of MR imaging in a multi-reader environment. Fortschr Röntgenstr 2012; 184: pp. 130-135.
30. Girometti R., Bazzocchi M., Como G., et. al.: Negative predictive value for cancer in patients with “gray-zone” PSA level and prior negative biopsy: preliminary results with multiparametric 3.0 Tesla MR. J Magn Reson Imaging 2012; 36: pp. 943-950.
31. Costa D.N., Bloch B.N., Yao D.F., et. al.: Diagnosis of relevant prostate cancer using supplementary cores from magnetic resonance imaging-prompted areas following multiple failed biopsies. Magn Reson Imaging 2013; 31: pp. 947-952.
32. Roehl K.A., Antenor J.A., Catalona W.J.: Serial biopsy results in prostate cancer screening study. J Urol 2002; 167: pp. 2435-2439.
33. Scattoni V., Zlotta A., Montironi R., et. al.: Extended and saturation prostatic biopsy in the diagnosis and characterisation of prostate cancer: a critical analysis of the literature. Eur Urol 2007; 52: pp. 1309-1322.
34. Ashley R.A., Inman B.A., Routh J.C., et. al.: Reassessing the diagnostic yield of saturation biopsy of the prostate. Eur Urol 2008; 53: pp. 976-981.
35. Taira A.V., Merrick G.S., Galbreath R.W., et. al.: Performance of transperineal template-guided mapping biopsy in detecting prostate cancer in the initial and repeat biopsy setting. Prostate Cancer Prostatic Dis 2010; 13: pp. 71-77.
36. Merrick G.S., Taubenslag W., Andreini H., et. al.: The morbidity of transperineal template-guided prostate mapping biopsy. BJU Int 2008; 101: pp. 1524-1529.
37. Barzell W.E., Melamed M.R., Cathcart P., et. al.: Identifying candidates for active surveillance: an evaluation of the repeat biopsy strategy for men with favorable risk prostate cancer. J Urol 2012; 188: pp. 762-767.
38. Kumar V., Jagannathan N.R., Kumar R., et. al.: Transrectal ultrasound-guided biopsy of prostate voxels identified as suspicious of malignancy on three-dimensional (1)H MR spectroscopic imaging in patients with abnormal digital rectal examination or raised prostate specific antigen level of 4-10 ng/ml. NMR Biomed 2007; 20: pp. 11-20.
39. Lawrentschuk N., Fleshner N.: The role of magnetic resonance imaging in targeting prostate cancer in patients with previous negative biopsies and elevated prostate-specific antigen levels. BJU Int 2009; 103: pp. 730-733.
40. Glas A.S., Lijmer J.G., Prins M.H., et. al.: The diagnostic odds ratio: a single indicator of test performance. J Clin Epidemiol 2003; 56: pp. 1129-1135.
41. Moore C.M., Robertson N.L., Arsanious N., et. al.: Image-guided prostate biopsy using magnetic resonance imaging-derived targets: a systematic review. Eur Urol 2013; 63: pp. 125-140.
42. Weinreb J.C., Blume J.D., Coakley F.V., et. al.: Prostate cancer: sextant localization at MR imaging and MR spectroscopic imaging before prostatectomy—results of ACRIN prospective multi-institutional clinicopathologic study. Radiology 2009; 251: pp. 122-133.
43. Song F., Khan K.S., Dinnes J., et. al.: Asymmetric funnel plots and publication bias in meta-analyses of diagnostic accuracy. Int J Epidemiol 2002; 31: pp. 88-95.