
Rationale and Objectives
To evaluate the value of the nonenhanced single-source dual-energy computed tomography (ssDECT) in differentiating metastases from adenomas in adrenal glands.
Materials and Methods
This retrospective study was approved by our Institutional Review Board, and written informed consent was waived. One hundred twelve patients (66 men:46 women; mean age, 58 years) with 63 adrenal metastases (AMs) and 64 adrenal adenomas (AAs) underwent a plain dual-energy spectral CT imaging from August 2011 to December 2013 were included. The fat (water) density (DFa [Wa]) from the material decomposition (MD) images and CT number and effective atomic number (eff-Z) from the virtual monochromatic spectral (VMS) image sets were measured for the AMs and AAs. The spectral Hounsfield unit (HU) curve (CT number as a function of photon energy from 40 to 140 keV) was generated, and its slope (K) was calculated. The difference of these parameters between AMs and AAs was statistically compared by the Wilcoxon rank sum test. Receiver operating characteristic curve (ROC) curves were used to compare the diagnostic efficacies of these measures in the identification of AAs and AMs. The distribution of spectral HU curve was analyzed using the chi-square test in terms of its slope K: ascending (K > 0.1), straight (−0.1 ≤ K ≤ 0.1), and descending (K < −0.1).
Results
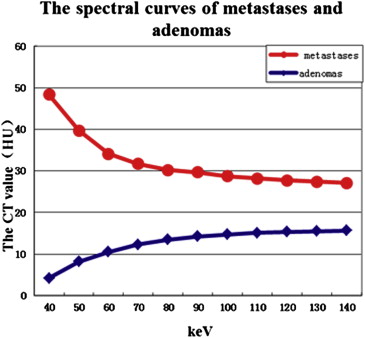
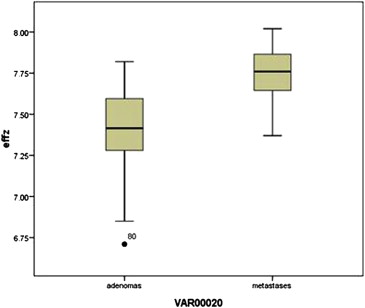
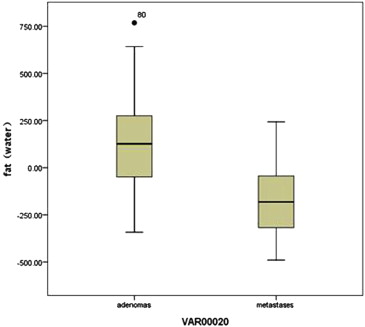
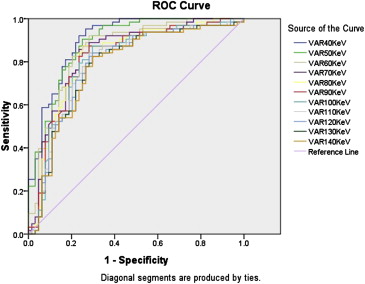
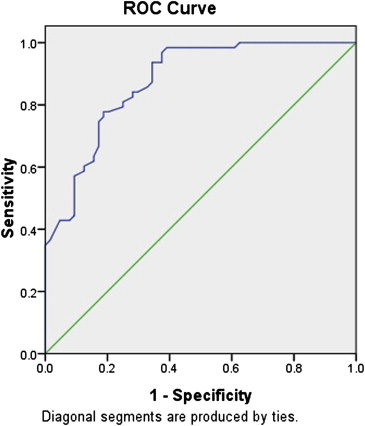
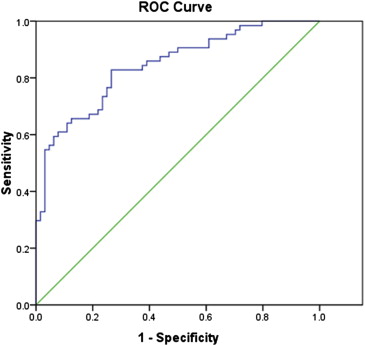
1) The CT number (medium, range) of metastases (50.47, 29.93 HU at 40 keV and 29.00, 9.36 HU at 140 keV) was significantly higher than that of adenomas (−0.76, 33.04 to 13.73, 18.96 HU) at each energy level from 40 to 140 keV ( P < .05). 2) The fat concentration of metastases (−177.37, 296.38 mg/mL) was statistically lower than that of adenomas (126.73, 328.07 mg/mL; P < .05). 3) The eff-Z of metastases (7.76, 0.23) was significantly higher than that of adenomas (7.42, 0.32; P < .05). 4) With CT number of VMS image at 40 keV of 21.78 HU as a threshold, the sensitivity and specificity for differentiating metastases from adenomas was 92.1% and 76.6%, respectively, and the area under the ROC curve was 0.90. 5) The spectral curve types included 3.2% (2 of 63) ascending, 20.6% (13 of 63) straight, and 76.2% (48 of 63) descending for the metastases, whereas the corresponding numbers were 60.9% (39 of 64), 21.9% (14 of 64), and 17.2% (11 of 64) for the adenomas. The difference was statistically significant (X 2 = 56.63; P < .05).
Conclusions
The nonenhanced ssDECT enables a multiparametric approach to provide an excellent sensitivity for identifying AMs from AAs.
The differentiation of metastases from adenomas in adrenal glands continues to be a challenge, primarily because an adrenal mass is found so often. The prevalence of adrenal adenomas (AAs) in the general population has been reported to be closer to 5% . And even for patients with extra-adrenal malignancy, most adrenal mass are adenomas .
It has been reported that unenhanced computed tomographic (CT) scans have a sensitivity of 71% and a specificity of 98% in the diagnosis of AA . There are many reports about the magnetic resonance (MR) imaging (MRI) in the differentiation between benign and malignant adrenal tumors . It is worth mentioning that combined analysis (chemical-shift imaging and early dynamic serial imaging) has a sensitivity of 94% and a specificity of 98% for diagnosing nonadenomas . However, about 10%–40% of adenomas are lipid poor, which reduces the sensitivity for characterization of adenomas on those scans .
Get Radiology Tree app to read full this article<
Get Radiology Tree app to read full this article<
Materials and methods
Patients
Get Radiology Tree app to read full this article<
Table 1
The Basic Information of Patients with Metastases and Adenomas
The Type of Disease Cases Lesions Male Female Mean Ages (years) Age Range (years) Metastases 52 63 38 14 61.8 ± 10.5 42–84 Adenomas 60 64 28 32 53.1 ± 9.7 24–76
Get Radiology Tree app to read full this article<
Imaging
Get Radiology Tree app to read full this article<
Image Analysis
Get Radiology Tree app to read full this article<
Statistical Analysis
Get Radiology Tree app to read full this article<
Results
Get Radiology Tree app to read full this article<
Table 2
The CT Number (HU) of Virtual Monochromatic Spectral Images (40–140 keV) of Adrenal Metastases and Adenomas
keV Metastases (Median, Range) Adenomas (Median, Range)Z__P Value 40 50.47, 29.93 −0.76, 33.04 −7.839 .00 50 41.18, 19.05 4.34, 25.57 −7.553 .00 60 36.36, 14.05 8.09, 22.01 −6.967 .00 70 34.98, 13.68 9.54, 19.66 −6.636 .00 80 34.02, 11.92 10.98, 17.31 −6.381 .00 90 33.37, 10.72 11.52, 18.51 −6.207 .00 100 31.91, 9.96 12.54, 19.28 −5.969 .00 110 30.74, 9.30 13.17, 19.70 −5.783 .00 120 30.24, 9.10 13.13, 19.04 −5.650 .00 130 29.51, 9.32 13.47, 19.25 −5.499 .00 140 29.00, 9.36 13.73, 18.96 −5.414 .00
Get Radiology Tree app to read full this article<
Get Radiology Tree app to read full this article<
Get Radiology Tree app to read full this article<
Get Radiology Tree app to read full this article<
Get Radiology Tree app to read full this article<
Get Radiology Tree app to read full this article<
Table 3
The Spectral Curve Types of Metastases and Adenomas
The Type of Disease Ascending Straight Descending Total Metastases, % ( n ) 3.2 (2/63) 20.6 (13/63) 76.2 (48/63) 63 Adenomas, % ( n ) 60.9 (39/64) 21.9 (14/64) 17.2 (11/64) 64 Total 41 27 59 127
Get Radiology Tree app to read full this article<
Get Radiology Tree app to read full this article<
Table 4
Receiver operating characteristic Curves for CT Number of Virtual Monochromatic Spectral Image, Effective Atomic Number, and Fat (Water) Concentration in Differentiating Adenomas From Metastases
The level of the keV Threshold Sensitivity (%) Specificity (%) Area 40 keV 21.78 HU 92.1 76.6 0.90 50 keV 19.53 HU 90.5 75.0 0.89 60 keV 17.43 HU 88.9 73.4 0.86 70 keV 20.40 HU 87.3 75.0 0.84 80 keV 19.58 HU 87.3 75.0 0.83 90 keV 21.79 HU 84.1 75.0 0.82 100 keV 22.87 HU 81.0 75.0 0.80 110 keV 22.56 HU 79.4 73.4 0.80 120 keV 22.14 HU 79.4 73.4 0.79 130 keV 22.98 HU 77.8 73.4 0.78 140 keV 22.91 HU 77.8 73.4 0.78 eff-Z 7.59 81.0 75.0 0.88 Fat −73.98 mg/mL 82.8 73.0 0.84
CT, computed tomography; eff-Z, effective atomic number.
Get Radiology Tree app to read full this article<
Discussion
Get Radiology Tree app to read full this article<
Get Radiology Tree app to read full this article<
Get Radiology Tree app to read full this article<
Get Radiology Tree app to read full this article<
Get Radiology Tree app to read full this article<
Get Radiology Tree app to read full this article<
Get Radiology Tree app to read full this article<
Get Radiology Tree app to read full this article<
Get Radiology Tree app to read full this article<
References
1. Kloos R.T., Gross M.D., Francis I.R., et. al.: Incidentally discovered adrenal masses. Endocr Rev 1995; 16: pp. 460.
2. Korobkin M., Francis I.R., Kloos R.T., et. al.: The incidental adrenal mass. Radiol Clin North Am 1996; 34: pp. 1037-1054.
3. Mitchell D.G., Crovello M., Matteucci C.T., et. al.: Benign adrenocortical masses: diagnosis with chemical shift MR imaging. Radiology 1992; 185: pp. 345-351.
4. Jung M.S., Byung K.P., Sung Y.P., et. al.: Characterization of lipid-poor adrenal adenoma: chemical-shift MRI and washout CT. Am J Roentgenol 2014; 202: pp. 1043-1050.
5. Ramalho M., de Campos R.O., Heredia V., et. al.: Characterization of adrenal lesions with 1.5-T MRI: preliminary observations on comparison of three in-phase and out-of-phase gradient-echo techniques. Am J Roentgenol 2011; 197: pp. 415-423.
6. Nakamura S., Namimoto T., Morita K., et. al.: Characterization of adrenal lesions using chemical shift MRI: comparison between 1.5 Tesla and two echo time pair selection at 3.0 Tesla MRI. J Magn Reson Imaging 2012; 35: pp. 95-102.
7. Pena C.S., Boland G.W., Hahn P.F., et. al.: Characterization of indeterminate (lipid-poor) adrenal masses: use of washout characteristics at contrast-enhanced CT. Radiology 2000; 217: pp. 798-802.
8. Caoili E.M., Korobkin M., Francis I.R., et. al.: Delayed enhanced CT of lipid-poor adrenal adenomas. Am J Roentgenol 2000; 175: pp. 1411-1415.
9. Boland G.W., Blake M.A., Holalkere N.S., et. al.: PET/CT for the characterization of adrenal masses in patients with cancer: qualitative versus quantitative accuracy in 150 consecutive patients. Am J Roentgenol 2009; 192: pp. 956-962.
10. Blake M.A., Cronin C.G., Boland G.W.: Adrenal imaging. Am J Roentgenol 2010; 194: pp. 1450-1460.
11. Shi J.W., Dai H.Z., Shen L., et. al.: Dual-energy CT: clinical application in differentiating an adrenal adenoma from a metastasis. Acta Radiologica 2014; 55: pp. 505-512.
12. Helck A., Hummel N., Meinel F.G., et. al.: Can single-phase dual-energy CT reliably identify adrenal adenomas?. Eur Radiol 2014; 24: pp. 1636-1642.
13. Graser A., Johnson T.R.C., Chandarana H., et. al.: Dual energy CT: preliminary observations and potential clinical applications in the abdomen. Eur Radiol 2009; 19: pp. 13-23.
14. Johnson T.R., Krauss B., Sedlmair M., et. al.: Material differentiation by dual energy CT: initial experience. Eur Radiol 2007; 17: pp. 1510-1517.
15. Gupta R.T., Ho L.M., Marin D., et. al.: Dual-energy CT for characterization of adrenal nodules: initial experience. Am J Roentgenol 2010; 194: pp. 1479-1483.
16. Yang J.X., Sun Y.H., Wang L.H.: Metastatic adrenal carcinoma (report of 11 cases). Chi J Urol 2004; 25: pp. 293-295.
17. Barzon L., Sonino N., Fallo F., et. al.: Prevalence and natural history of adrenal incidentalomas. Eur J Endocrinol 2003; 149: pp. 273-285.
18. Boland G.W., Blake M.A., Hahn P.F., et. al.: Incidental adrenal lesions: principles techniques and algorithms for imaging characterization. Radiology 2008; 249: pp. 756-775.
19. Arnold D.T., Reed J.B., Burt K.: Evaluation and management of the incidental adrenal mass. Proc (Bayl Univ Med Cent) 2003; 16: pp. 7-12.
20. Caoili E.M., Korobkin M., Francis I.R., et. al.: Adrenal masses: characterization with combined unenhanced and delayed enhanced CT. Radiology 2002; 222: pp. 629-633.
21. Szolar D.H., Korobkin M., Reittner P., et. al.: Adrenocortical carcinomas and adrenal pheochromocytomas: mass and enhancement loss evaluation at delayed contrast-enhanced CT. Radiology 2005; 234: pp. 479-485.
22. Lv P., Lin X.Z., Li J., et. al.: Differentiation of small hepatic hemangioma from small hepatocellular carcinoma: recently introduced spectral CT method. Radiology 2011; 259: pp. 720-729.
23. Lin X.Z., Wu Z.Y., Tao R., et. al.: Dual energy spectral CT imaging of insulinoma—value in preoperative diagnosis compared with conventional multi-detector CT. Euro J Radiol 2012; 81: pp. 2487-2494.
24. Yu Y., Lin X., Chen K., et. al.: Hepatocellular carcinoma and focal nodular hyperplasia of the liver: differentiation with CT spectral imaging. Euro Radiol 2013; 23: pp. 1660-1668.
25. Lee M.J., Hahn P.F., Papanicolau N., et. al.: Benign and malignant adrenal masses: CT distinction with attenuation coefficients, size, and observer analysis. Radiology 1991; 179: pp. 415-418.
26. Korobkin M., Giordano T.J., Brodeur F.J., et. al.: Adrenal adenomas: relationship between histologic lipid and CT and MR findings. Radiology 1996; 200: pp. 743-747.
27. Li X.H., Yu Y.Q., Wang W.Q., et. al.: Spectral CT imaging in the evaluation of composition of kidney stones. Chi J Radiol 2011; 45: pp. 1216-1219.