
Rationale and Objectives
To compare thermal dosimetry metrics for specified diameters of coagulation achieved using three different ablation energy sources.
Materials and Methods
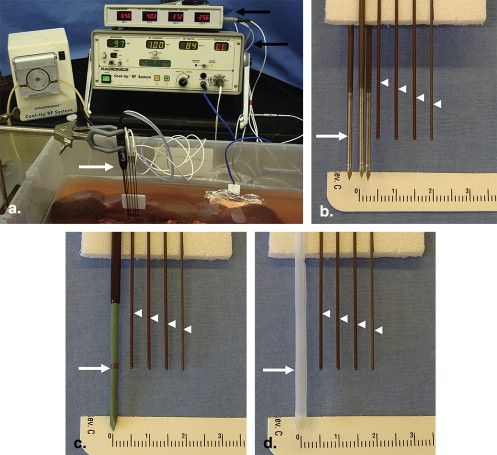
204 ablations measuring 20, 30, or 40 ± 2 mm were created in an ex-vivo bovine liver model using 1) 2.5 cm cluster RF electrodes ( n = 114), 2) 3 cm microwave antennas ( n = 45), and 3) 3 cm laser diffusing fibers ( n = 45). Continuous temperature monitoring was performed 5–20 mm from the applicators to calculate: a) the area under the curve (AUC), b) cumulative equivalent minutes at 43°C (CEM43), and c) Arrhenius damage integral (Ω) for the critical ablation margin (DOC), with results compared by multivariate analysis of variance and regression analysis.
Results
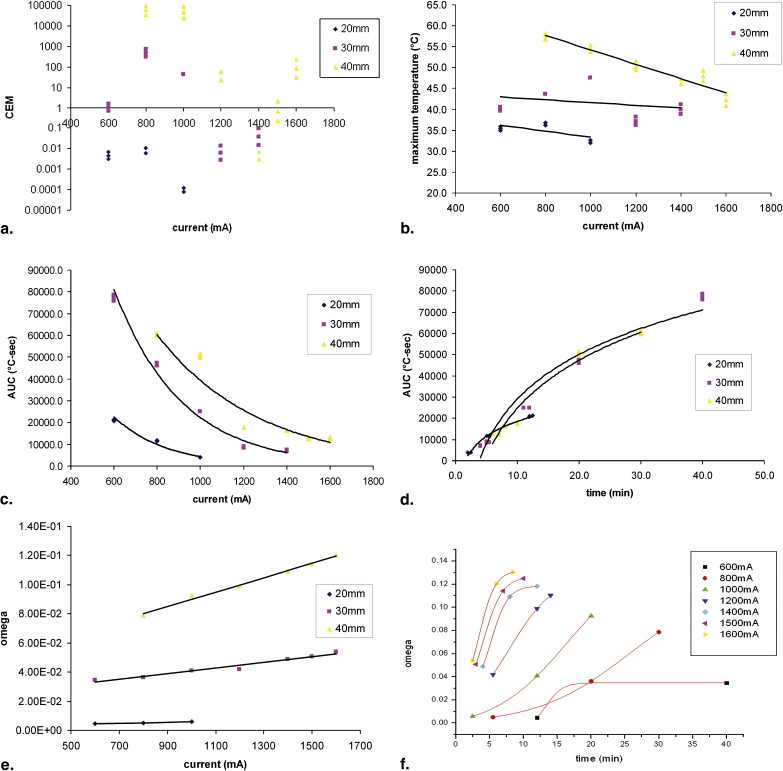
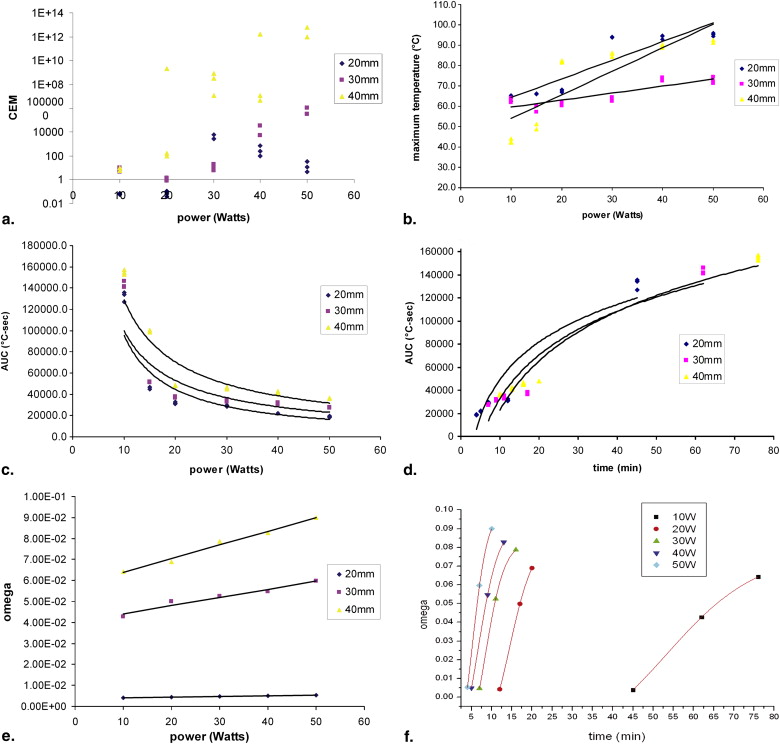
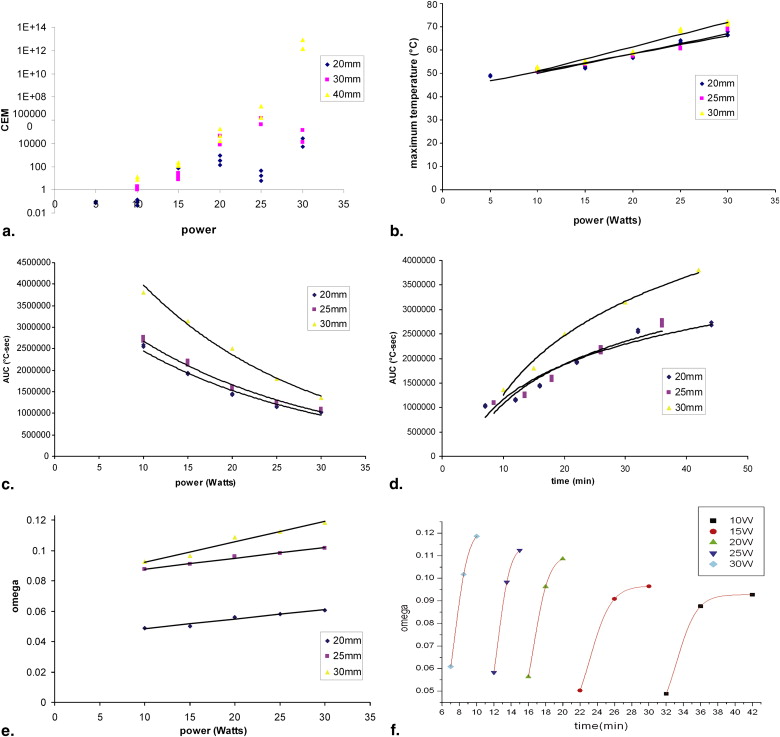
The end temperatures at the margin of coagulation varied, and was lowest for the RF cluster electrode (33–58°C), higher for laser (52–72°C), and covered the widest range for microwave (42–95°C). These end temperatures correlated with applied energy, as linear functions ( r 2 = 0.74–0.96). The total heat needed to achieve ablation (AUC) varied with applied energy and coagulation diameter as negative exponential (RF and laser) or negative power (microwave) functions ( r 2 = 0.82–0.98). Similarly, CEM43 values varied exponentially with energy and distance ( r 2 = 0.52–0.76) over a wide range of values (10 12 ). Likewise, Ω varied not only based upon energy source and DOC, but also as a positive linear correlation to applied energy and with sigmoid correlation to duration of ablation ( r 2 = 0.85–0.97).
Conclusion
Our study demonstrates that the thermal dosimetry of ablation is not based solely on a fixed end temperature at the margin of the coagulation zone. Thermal dosimetry is not constant, but dependent on the type and amount of energy applied and distance suggesting the need to take into account the rate of heat transfer for ablation dosimetry.
The past decade has witnessed a widespread expansion into the clinical setting of image-guided minimally-invasive ablation techniques using various thermal energy sources, such as radiofrequency, microwave, high intensity focused ultrasound, and laser to destroy focal tumors in multiple organ sites . In many cases, these techniques allow one to avoid major surgery, that otherwise would have been required for removal of malignancy or enable treatment for non-surgical candidates . Owing to advancements in both imaging modalities used for visualization and percutaneous devices used for delivery of energy into tumor tissue, these techniques have established themselves as viable treatment options for eradication of solid tumors in locations such as the liver , kidney , bone , lung , with ever expanding utility to additional locations including head and neck , adrenals, prostate and others .
Based upon conventional wisdom, current clinical algorithms for thermal ablation have used tissue heating >50°C for >5 minutes as a paradigm end point denoting induced coagulation for all tissue types . Yet, more recently obtained experimental data has shown that using a 50°C isotherm as the main surrogate treatment endpoint is likely overly simplistic and that the actual critical thermal dosimetry (ie, at the margin of the coagulation zone) is quite variable and tissue-specific in as of yet incompletely uncharacterized ways. This propels the need for a tissue specific understanding of heat- tissue interactions. Moreover the “high temperature” dosimetry of thermal ablation does not necessarily follow classical hyperthermia dosimetry that is based on a paradigm of prolonged, uniform heating of entire volume of tissue after achieving thermal steady state. For example, we have shown, that thermal dosimetry of a single internally-cooled radiofrequency ablation electrode was dependent not only on tissue type, but also on the amount of energy delivered to the tissue, and the distance of the critical ablation margin from the applicator . Most notably thermal dose required for coagulation was not constant, but correlated with current in a negative exponential fashion in both ex vivo and in vivo models. That study, using single RF electrode, raised two important questions: a) Are non-constant thermal doses only found for radiofrequency ablation (suggesting electromagnetic influence) or is it more global phenomenon?; and b) Given the effects of distance and current how important is the rate of heat transfer within the tissue for which other formulas such as the Arrhenius damage integral may be most useful to best express thermal dosimetry parameters?
Get Radiology Tree app to read full this article<
Materials and methods
Overview of Study Design
Get Radiology Tree app to read full this article<
RF energy deposition
Get Radiology Tree app to read full this article<
Get Radiology Tree app to read full this article<
Microwave energy deposition
Get Radiology Tree app to read full this article<
Laser energy deposition
Get Radiology Tree app to read full this article<
Get Radiology Tree app to read full this article<
Tissue thermometry
Get Radiology Tree app to read full this article<
Data analyses
Get Radiology Tree app to read full this article<
Get Radiology Tree app to read full this article<
Ω(t)=−ln(c(t)c(0))=A∫0te(−ΔERT)dt Ω
(
t
)
=
−
ln
(
c
(
t
)
c
(
0
)
)
=
A
∫
0
t
e
(
−
Δ
E
R
T
)
d
t
Where: Ω is the damage sustained by the tissue, c(t) = amount of the component of interest remaining, c(0) = amount of the component of interest at time zero, A = frequency factor (7.39 × 10 39 1/sec) and ΔE = the activation energy (2.577 × 10 5 J/mol for liver tissue) .
Get Radiology Tree app to read full this article<
Get Radiology Tree app to read full this article<
CEM43=tR(43−T) CE
M
43
=
t
R
(
43
−
T
)
Where: t = time interval, T = average temperature during time interval t, R = number of minutes needed to compensate for a 1° temperature decrease either above or below the break point (43°C), R is 0.5 for T above 43°C and 0.25 for T below 43°C) .
Get Radiology Tree app to read full this article<
Get Radiology Tree app to read full this article<
Results
Radiofrequency Ablation (Cluster Electrode)
Get Radiology Tree app to read full this article<
Table 1
Summary of the Relationships Between Thermal Parameters, Distance, and Current for RF Cluster Electrode
y Distance Function_r 2_ AUC vs. RF current AUC (°C-sec) 20 mm y = 267044e −0.0041x 0.97 30 mm y = 563027e −0.0032x 0.96 40 mm y = 331504e −0.0021x 0.90 AUC vs. duration AUC (°C-sec) 20 mm y = 10094Ln(x) − 4695.4 0.98 30 mm y = 30260Ln(x) − 40568 0.95 40 mm y = 32585Ln(x) − 50276 0.96 End temperature vs. RF current End temperature (°C) 20 mm y = -0.0072x + 40.6 0.45 30 mm y = −0.0033x + 44.947 0.07 40 mm y = −0.0172x + 71.443 0.91 CEM vs. RF current CEM 43 20 mm y = 2E-05e 0.0202x 0.52 30 mm y = 6E-07e 0.0304x 0.77 40 mm y = 4E-23e 0.0844x 0.83 Arrhenius integral vs. RF current Arrhenius integral 20 mm y = 3E-06x + 0.0032 0.92 30 mm y = 2E-05x + 0.0215 0.96 40 mm y = 5E-05x + 0.0404 0.99
RF, radiofrequency; AUC, area under the curve; CEM, cumulative equivalent minutes.
Table 2
Summary of the Relationships Between Thermal Parameters, Distance, and Power for MW Antenna
y Distance Function_r 2_ AUC vs. power AUC (°C-sec) 20 mm y = 1E+06x − 1.093 0.87 30 mm y = 808149x − 0.909 0.80 40 mm y = 956256x − 0.8704 0.86 AUC vs. duration AUC (°C-sec) 20 mm y = 46895Ln(x) − 58565 0.89 30 mm y = 54695Ln(x) − 93161 0.90 40 mm y = 61797Ln(x) − 119574 0.94 End temperature vs. power End temperature (°C) 20 mm y = 0.9166x + 55.064 0.82 30 mm y = 0.3427x + 56.163 0.75 40 mm y = 1.1567x + 42.446 0.72 CEM vs. power CEM 43 20 mm y = 2E-05e 0.0202x 0.52 30 mm y = 6E-07e 0.0304x 0.77 40 mm y = 4E-23e 0.0844x 0.83 Arrhenius integral vs. power Arrhenius integral 20 mm y = 3E-05x + 0.0036 0.99 30 mm y = 0.0004x + 0.0403 0.96 40 mm y = 0.0007x + 0.0574 0.98
MW, microwave; AUC, area under the curve; CEM, cumulative equivalent minutes.
Table 3
Summary of the Relationships Between Thermal Parameters, Distance, and Power for Laser-diffusing Fiber
y Distance Function_r 2_ AUC vs. power AUC (°C-sec) 20 mm y = 4E+06e − 0.0468x 0.97 25 mm y = 4E+06e − 0.0476x 0.98 30 mm y = 7E+06e − 0.0523x 0.98 AUC vs. duration AUC (°C-sec) 20 mm y = 1E+06Ln(x) − 1E+06 0.92 25 mm y = 1E+06Ln(x) − 2E+06 0.92 30 mm y = 2E+06Ln(x) − 3E+06 0.98 End temperature vs. power End temperature (°C) 20 mm y = 0.7749x + 42.898 0.95 25 mm y = 0.8493x + 41.5 0.94 30 mm y = 1.0493x + 40.44 0.95 CEM vs. power CEM 43 20 mm y = 2E-05e 0.0202x 0.52 25 mm y = 6E-07e 0.0304x 0.77 30 mm y = 4E-23e 0.0844x 0.83 Arrhenius integral vs. power Arrhenius integral 20 mm y = 0.0336x + 23.705 0.93 25 mm y = 0.0438x + 19.165 0.90 30 mm y = 0.0206x + 39.522 0.87
AUC, area under the curve; CEM, cumulative equivalent minutes.
Table 4
Summary of the Relationships Between Arrhenius Integral vs. Duration and Energy Applied
Energy_r 2_A 1__A 2__X 0 d x Arrhenius integral vs. duration RF cluster electrode 600 mA 0.92 −1730.7 47.9 −3790.8 923.9 800 mA 0.96 −779.4 53.3 −2989.0 955.1 1000 mA 0.96 −331.8 65.3 −1508.4 748.0 1200 mA 0.98 −1122.0 67.2 −1432.3 442.9 1400 mA 0.99 −723.1 114.2 −1425.9 691.4 1500 mA 0.99 −575.9 628.3 54.5 1893.6 1600 mA 0.99 −13.13002 65.02 43.785 122.87 Arrhenius integral vs. duration MW antenna 10 W 0.94 10.43263 43.21 203.8 257 20 W 0.98 −10.8419 57.22 33.616 195.32 30 W 0.99 7.8057 50.28 85.897 100.88 40 W 0.99 −301.01397 62.66 −618 306.07 50 W 0.99 −135.98162 99.28 −161.1 236.11 Arrhenius integral vs. duration laser fiber 10 W 0.96 −15.41863 86.32 507.54 873.89 15 W 0.98 −3.06785 54.28 272.23 440.45 20 W 0.99 −26.50642 70.08 79.662 570.18 25 W 0.99 8.93909 75.4 504.62 277.67 30 W 0.99 7.11334 65.42 351.04 248.68
RF, radiofrequency.
Parameters presented are best-fits for the formula: Y=A1−A21+e(X−X0)/dx+A2 Y
=
A
1
−
A
2
1
+
e
(
X
−
X
0
)
/
d
x
+
A
2 .
Get Radiology Tree app to read full this article<
Microwave
Get Radiology Tree app to read full this article<
Get Radiology Tree app to read full this article<
Laser
Get Radiology Tree app to read full this article<
Get Radiology Tree app to read full this article<
Comparison between Energy Sources
Get Radiology Tree app to read full this article<
Discussion
Get Radiology Tree app to read full this article<
Get Radiology Tree app to read full this article<
Get Radiology Tree app to read full this article<
Get Radiology Tree app to read full this article<
Get Radiology Tree app to read full this article<
Get Radiology Tree app to read full this article<
Acknowledgment
Get Radiology Tree app to read full this article<
Get Radiology Tree app to read full this article<
References
1. Tanabe K.K., Curley S.A., Dodd G.D., et. al.: Radiofrequency ablation: the experts weigh in. Cancer 2004; 100: pp. 641-650.
2. Howard J.H., Tzeng C.W., Smith J.K., et. al.: Radiofrequency ablation for unresectable tumors of the liver. Am Surg 2008; 74: pp. 594-600.
3. Solbiati L., Livraghi T., Goldberg S.N., et. al.: Percutaneous radio-frequency ablation of hepatic metastases from colorectal cancer: long-term results in 117 patients. Radiology 2001; 221: pp. 159-166.
4. Tateishi R., Shiina S., Teratani T., et. al.: Percutaneous radiofrequency ablation for hepatocellular carcinoma. An analysis of 1000 cases. Cancer 2005; 103: pp. 1201-1209.
5. Lencioni R., Della Pina C., Crocetti L., et. al.: Percutaneous ablation of hepatocellular carcinoma. Recent Results Cancer Res 2006; 167: pp. 91-105.
6. Curley S.A., Izzo F.: Radiofrequency ablation of primary and metastatic hepatic malignancies. Int J Clin Oncol 2002; 7: pp. 72-81.
7. Gervais D.A., Arellano R.S., Mueller P.: Percutaneous ablation of kidney tumors in nonsurgical candidates. Oncology (Williston Park, NY) 2005; 11: pp. 6-11.
8. Posteraro A.F., Dupuy D.E., Mayo-Smith W.W.: Radiofrequency ablation of bony metastatic disease. Clin Radiol 2004; 9: pp. 803-811.
9. Dupuy D.E., DiPetrillo T., Gandhi S., et. al.: Radiofrequency ablation followed by conventional radiotherapy for medically inoperable stage I non-small cell lung cancer. Chest 2006; 3: pp. 738-745.
10. Monchik J.M., Donatini G., Iannuccilli J., et. al.: Radiofrequency ablation and percutaneous ethanol injection treatment for recurrent local and distant well-differentiated thyroid carcinoma. Ann Surg 2006; 2: pp. 296-304.
11. Fan W.J., Wu P.H., Zhang L., et. al.: Radiofrequency ablation as a treatment for hilar cholangiocarcinoma. World J Gastroenterol 2008; 28: pp. 4540-4545.
12. Ward E., Munk P.L., Rashid F., et. al.: Musculoskeletal interventional radiology: radiofrequency ablation. Radiol Clin North Am 2008; 3: pp. 599-610.
13. Goldberg S.N., Gazelle G.S., Dawson S.I., et. al.: Tissue ablation with radiofrequency: effect of probe size, gauge, duration, and temperature on lesion volume. Acad Radiol 1995; 5: pp. 399-404.
14. Mertyna P., Hines-Peralta A., Liu Z., et. al.: Radiofrequency ablation: variability in heat sensitivity in tumors and tissues. J Vasc Interv Radiol 2007; 18: pp. 647-654.
15. Mertyna P., Dewhirst M.W., Halpern E., et. al.: Radiofrequency ablation: the effect of distance and baseline temperature on thermal dose required for coagulation. Int J Hyperthermia 2008; 4: pp. 1-10.
16. Goldberg S.N., Stein M.C., Gazelle G.S., et. al.: Percutaneous radiofrequency tissue ablation: optimization of pulsed-RF technique to increase coagulation necrosis. J Vasc Interv Radiol 1999; 7: pp. 907-916.
17. Chang I., Nguyen U.: Thermal modeling of lesion growth with radiofrequency ablation devices. Biomed Eng Online 2004; 1: pp. 27.
18. Sapareto S.A., Dewey W.C.: Thermal dose determination in cancer therapy. Int J Radiat Oncol Biol Phys 1984; 10: pp. 787-800.
19. Hall E.J.: Hyperthermia.Hall E.J.Giaccia A.J.Radiobiology for the radiologist.2006.Lippincott Williams WilkinsPhiladelphia:pp. 469-488.
20. Tateishi R., Shiina S., Teratani T., et. al.: Percutaneous radiofrequency ablation for hepatocellular carcinoma. An analysis of 1000 cases. Cancer 2005; 6: pp. 1201-1209.
21. Dewhirst M.W., Viglianti B.L., Lora-Michiels M., et. al.: Basic principles of thermal dosimetry and thermal thresholds for tissue damage from hyperthermia. Int J Hypertherm 2003; 3: pp. 267-294.
22. Liu Z., Lobo S.M., Humphries S., et. al.: Radiofrequency tumor ablation: insight into improved efficacy using computer modeling. AJR Am J Roentgenol 2005; 184: pp. 1347-1352.
23. Lepock J.R.: Measurement of protein stability and protein denaturation in cells using differential scanning calorimetry. Methods 2005; 2: pp. 117-125.
24. Duck F.: Physical properties of tissue.A comprehensive reference book.1990.Academic PressNew York:pp. 167-223.
25. Lepock J.R.: How do cells respond to their thermal environment?. Int J Hypertherm 2005; 8: pp. 681-687.
26. Lepock J.R.: Cellular effects of hyperthermia: relevance to the minimum dose for thermal damage. Int J Hypertherm 2003; 3: pp. 252-266.