
Rationale and Objective
Sensitive detection of bone mineral density (BMD) change is a key issue to monitor and evaluate the individual bone health status, as well as bone metabolism and bone mineral status. The ability to use thoracic quantitative computed tomography (QCT) to detect the annual change of BMD remains unclear. We aimed to investigate the sensitivity in detecting age-related bone mineral loss using the thoracic QCT from the electrocardiographically gated heart scans in comparison to whole-body dual-energy X-ray absorptiometry (DXA) and standard lumbar QCT.
Materials and Methods
A total of 121 asymptomatic patients’ imaging data, including DXA whole body scan, cardiac CT scan, and abdomen scans were analyzed. The BMD of the thoracolumbar spine, upper, and lower extremities were measured using QCT and DXA, respectively. The age-related annual rate of bone density loss was computed and compared to the thoracic and lumbar QCT, as well DXA measures.
Results
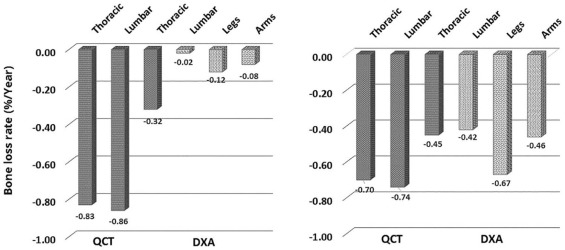
The age-related annual rate of bone loss with QCT was −0.70 mg/mL 3 (−0.75%/y) in women, −0.83 mg/mL 3 (−0.86%/y) in men in the thoracic and the lumbar trabecular QCT, respectively. Compared to the QCT, DXA demonstrates a lower annual rate of bone loss in the area of BMD measurement ( P < .05 in all, excluding legs of women) in −0.45, −0.42, −0.67, and −0.46 in women, in −0.32, −0.02, −0.12, and −0.08 in men for thoracic, lumbar, leg, and arm, respectively.
Conclusion
We conclude that the thoracic and the lumbar QCT provide a similar and more sensitive method for detecting bone mineral loss when compared to DXA.
Introduction
Bone fracture and cardiovascular disease are two of the most common diseases and strongly associated with high morbidity and mortality. Osteoporosis and coronary atherosclerosis are crucial independent risk factors for bone fracture and cardiovascular disease, respectively , and both can be detected by quantitative computed tomography (QCT) using a low-dose cardiac CT-produced image . Given that the importance of using QCT to assess bone mineral density (BMD) of the spine may be a potentially diagnostic tool for osteoporosis-related vertebral fractures, several initial studies have indicated that the lumbar QCT is robust for the detection of osteoporosis, and BMD change can be more sensitively detected with serial scans . As a matter of fact, some preliminary thoracic QCT data from a routine lung or heart scan have indicated its compatibility with the lumbar QCT even if the sensitivity to detect the annual loss rate of BMD with the thoracic QCT remains unclear. In this study, we aimed to evaluate the ability to detect the age-related annual rate of bone loss by the thoracic QCT with an electrocardiographically gated routine heart scan in comparison to whole-body double-energy densitometry (DXA) and lumbar QCT.
Subject and Methods
Study Population
This chart review retrospective study comprises a total of 121 (56, 20–81 years) asymptomatic patients who underwent DXA whole-body and CT heart and abdomen scans on the same day. The aims of the study were the quantification of coronary calcified burden and examination of body composition, including bone mineral content (BMC), BMD, and percentage of the body fat and fat-free mass. The exclusion criteria are patients with metal implement in the thoracolumbar spine (only one case). All patients had optimal CT and DXA images with no significant noise or metal artifact.
CT Scan Technique
Get Radiology Tree app to read full this article<
Get Radiology Tree app to read full this article<
Get Radiology Tree app to read full this article<
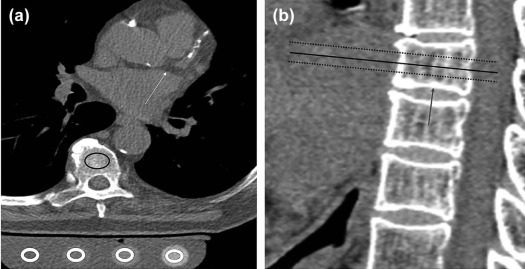
QCT BMD Measurement, Coronary Calcium Burden Quantification, and Investigation in Spine Degenerative Change
Get Radiology Tree app to read full this article<
Get Radiology Tree app to read full this article<
Get Radiology Tree app to read full this article<
Whole-body DXA Scans and BMD Measurement
Get Radiology Tree app to read full this article<
Get Radiology Tree app to read full this article<
Analysis
Get Radiology Tree app to read full this article<
Get Radiology Tree app to read full this article<
Results
Get Radiology Tree app to read full this article<
TABLE 1
Demographic Characteristics Over Genders
Female ( n = 60) Male ( n = 61) Age (y) 57.7 ± 11.8 55.7 ± 11.9 Race, % Caucasian 4.5 5.5 Hispanic 34.1 34.5 African-American 52.3 47.3 Asian 9.1 12.7 Height (cm) 158.5 ± 9.5 170.4 ± 11.0 Weight (kg) 71.4 ± 17.2 86.5 ± 20.1 Body mass index (kg/m 2 ) 28.1 ± 5.4 26.8 ± 5.2 Agatston score 109 ± 313 377 ± 512 Total fat percentage (%) 36.2 ± 7.9 25.0 ± 7.9 Total free-rat mass (%) 61.0 ± 7.6 71.9 ± 7.6 Total bone mineral content (%) 2.7 ± 0.5 3.0 ± 0.5
TABLE 2
The Age-related Annual Rate of Bone Loses (%/y) Over Genders with QCT and DXA
Female ( n = 60) Male ( n = 61) β 95% CI β 95% CI QCT Thoracic TRAB, %/y −0.70 −2.50, 1.11 −0.83 −3.12, 1.47 QCT Lumbar TRAB,%/y −0.75 −2.22, 0.74 −0.86 −2.7, 0.97 DXA Thoracic, %/y −0.45 \* −1.67, 0.92 −0.32 † −2.41, 1.77 DXA Lumbar, %/y −0.42 \* −1.45, 0.75 −0.02 † −0.24, 0.19 DXA Legs, %/y −0.67 −1.90, 0.56 −0.12 † −0.31, 0.08 DXA Arms, %/y −0.46 \* −0.57, 0.65 −0.08 † −0.24, 0.07
CI, confidence interval; DXA, dual-energy X-ray absorptiometry; QCT, quantitative computed tomography; TQCT, thoracic quantitative computed tomography; TRAB, trabecular bone.
Get Radiology Tree app to read full this article<
Get Radiology Tree app to read full this article<
Get Radiology Tree app to read full this article<
Get Radiology Tree app to read full this article<
TABLE 3
The Correlation Between BMD Assessment and Weight or Age
Female Male Weight Age Weight Age QCT Thoracic TRAB 0.26 \* −0.55 † 0.07 −0.47 † QCT Lumbar TRAB 0.02 −0.62 † 0.08 −0.45 † DXA Thoracic 0.50 † −0.13 0.41 † 0.27 \* DXA Lumbar 0.55 † −0.25 0.34 † 0.30 \* DXA Legs 0.34 † −0.27 \* 0.36 † 0.04 DXA Arms 0.23 −0.19 0.32 † 0.14
BMD, bone mineral densaity; DXA, dual-energy X-ray absorptiometry; QCT, quantitative computed tomography; TRAB, trabecular bone.
Get Radiology Tree app to read full this article<
Get Radiology Tree app to read full this article<
Get Radiology Tree app to read full this article<
Get Radiology Tree app to read full this article<
TABLE 4
Bone Mineral Density and T-score of Women Across Age Categories
Total ( n = 60) Age (Y) Trend P Value <50 ( n = 14) 50–64 ( n = 24) ≥65 ( n = 22) QCT Thoracic TRAB (mg/cc) 172.1 ± 53.2 216.4 ± 41.3 178.4 ± 52.6 137.0 ± 33.1 <.001 QCT Thoracic T-score −1.2 ± 1.7 0.0 ± 1.5 −1.1 ± 1.5 −2.4 ± 0.9 <.001 QCT Lumbar TRAB (mg/cc) 133.9 ± 42.5 174.8 ± 31.8 139.5 ± 31.0 108.4 ± 38.5 <.001 QCT Lumbar T-score −1.2 ± 1.7 −0.2 ± 1.6 −1.3 ± 1.0 −2.2 ± 1.3 <.001 DXA Thoracic (g/cm 2 ) 0.75 ± 0.12 0.75 ± 0.12 0.78 ± 0.12 0.72 ± 0.09 .462 DXA Thoracic T-score −1.1 ± 1.2 −1.0 ± 1.3 −0.9 ± 1.3 −1.5 ± 0.8 .231 DXA Lumbar (g/cm 2 ) 0.98 ± 0.16 1.00 ± 0.15 1.02 ± 0.14 0.91 ± 0.12 .046 DXA Lumbar T-score −0.8 ± 1.2 −0.6 ± 1.2 −0.6 ± 1.3 −1.3 ± 1.3 .062 DXA Legs (g/cm 2 ) 0.95 ± 0.15 0.99 ± 0.15 0.97 ± 0.13 0.92 ± 0.15 .193 DXA Legs T-score −1.8 ± 1.4 −1.6 ± 1.4 −1.7 ± 1.4 −2.1 ± 1.3 .363 DXA Arms (g/cm 2 ) 0.64 ± 0.10 0.67 ± 0.08 0.65 ± 0.08 0.62 ± 0.1.2 .222 DXA Arms T-score −1.5 ± 1.2 −1.0 ± 1.3 −1.4 ± 1.1 −1.9 ± 1.1 .052
DXA, dual-energy X-ray absorptiometry; QCT, quantitative computed tomography; TRAB, trabecular bone.
The patient’s weight was adjusted when the difference within groups was tested.
TABLE 5
Bone Mineral Density and T-score of Men Across Age Categories
Total ( n = 61) Age (Y) Trend P Value <50 ( n = 23) 50–64 ( n = 25) ≥65 ( n = 13) QCT Thoracic TRAB (mg/mL 3 ) 174.3 ± 55.3 198.8 ± 54.9 168.0 ± 51.5 143.3 ± 42.0 .003 QCT Thoracic T-score −1.2 ± 1.5 −0.2 ± 1.4 −1.4 ± 1.3 −2.2 ± 0.9 <.001 QCT Lumbar TRAB (mg/mL 3 ) 131.9 ± 39.4 142.7 ± 40.3 138.7 ± 41.9 116.4 ± 34.4 .042 QCT Lumbar T-score −1.4 ± 1.0 −0.1 ± 1.3 −1.1 ± 0.8 −2.0 ± 0.7 <.001 DXA Thoracic (g/cm 2 ) 0.84 ± 0.12 0.82 ± 0.09 0.84 ± 0.14 0.88 ± 0.16 .242 DXA Thoracic T-score −0.4 ± 1.3 −0.7 ± 1.0 −0.3 ± 1.2 0.0 ± 1.6 .014 DXA Lumbar (g/cm 2 ) 1.04 ± 0.16 1.03 ± 0.14 1.01 ± 0.17 1.10 ± 0.15 .213 DXA Lumbar T-score −0.2 ± 1.2 −0.4 ± 1.0 −0.3 ± 1.3 0.2 ± 1.1 .113 DXA Legs (g/cm 2 ) 1.12 ± 0.14 1.13 ± 0.12 1.10 ± 0.15 1.09 ± 0.13 .737 DXA Legs T-score −1.5 ± 1.0 −1.4 ± 0.8 −1.6 ± 1.1 −1.6 ± 1.0 .655 DXA Arms (g/cm 2 ) 0.78 ± 0.08 0.78 ± 0.08 0.76 ± 0.09 0.76 ± 0.07 .315 DXA Arms T-score −1.4 ± 1.0 −1.2 ± 1.1 −1.5 ± 1.0 −1.5 ± 1.0 .421
DXA, dual-energy X-ray absorptiometry; QCT, quantitative computed tomography; TRAB, trabecular bone.
The patient’s weight was adjusted when the difference within groups was tested.
Get Radiology Tree app to read full this article<
Get Radiology Tree app to read full this article<
Get Radiology Tree app to read full this article<
Get Radiology Tree app to read full this article<
Get Radiology Tree app to read full this article<
Discussion
Get Radiology Tree app to read full this article<
Get Radiology Tree app to read full this article<
Get Radiology Tree app to read full this article<
Get Radiology Tree app to read full this article<
Limitation
Get Radiology Tree app to read full this article<
Conclusion
Get Radiology Tree app to read full this article<
References
1. Kim D.H., Vaccaro A.R.: Osteoporotic compression fractures of the spine; current options and considerations for treatment. Spine J 2006; 6: pp. 479-487.
2. Budoff M.J., Hokanson J.E., Nasir K., et. al.: Progression of coronary artery calcium predicts all-cause mortality. JACC Cardiovasc Imaging 2010; 3: pp. 1229-1236.
3. Budoff M.J., Hamirani Y.S., Gao Y.L., et. al.: Measurement of thoracic bone mineral density with quantitative CT. Radiology 2010; 257: pp. 434-440.
4. Budoff M.J., Malpeso J.M., Zeb I., et. al.: Measurement of phantomless thoracic bone mineral density on coronary artery calcium CT scans acquired with various CT scanner models. Radiology 2013; 267: pp. 830-836.
5. Li D., Mao S.S., Khazai B., et. al.: Noncontrast cardiac computed tomography image-based vertebral bone mineral density: the Multi-Ethnic Study of Atherosclerosis (MESA). Acad Radiol 2013; 20: pp. 621-627.
6. Grampp S., Genant H.K., Mathur A., et. al.: Comparisons of noninvasive bone mineral measurements in assessing age-related loss, fracture discrimination, and diagnostic classification. J Bone Miner Res 1997; 12: pp. 697-711.
7. Guglielmi G., Grimston S.K., Fischer K.C., et. al.: Osteoporosis: diagnosis with lateral and posteroanterior dual X-ray absorptiometry compared with quantitative CT. Radiology 1994; 192: pp. 845-850.
8. Lenchik L., Shi R., Register T.C., et. al.: Measurement of trabecular bone mineral density in the thoracic spine using cardiac gated quantitative computed tomography. J Comput Assist Tomogr 2004; 28: pp. 134-139.
9. Wong M., Papa A., Lang T., et. al.: Validation of thoracic quantitative computed tomography as a method to measure bone mineral density. Calcif Tissue Int 2005; 76: pp. 7-10.
10. Looker A.C., Borrud L.G., Hughes J.P., et. al.: Total body bone area, bone mineral content, and bone mineral density for individuals aged 8 years and over: United States, 1999–2006. Vital Health Stat 2013; 11: National Center for Health Statistics
11. Shepherd J.A., Baim S., Bilezikian J.P., et. al.: Executive summary of the 2013 International Society for Clinical Densitometry position development conference on body composition. J Clin Densitom 2013; 16: pp. 489-495.
12. Grampp S., Jergas M., Lang P., et. al.: Quantitative CT assessment of the lumbar spine and radius in patients with osteoporosis. AJR Am J Roentgenol 1996; 167: pp. 133-140.
13. Genant H.K., Engelke K., Fuerst T., et. al.: Noninvasive assessment of bone mineral and structure: state of the art. J Bone Miner Res 1996; 11: pp. 707-730.
14. Mao S.S., Li D., Luo Y., et. al.: Application of quantitative computed tomography for assessment of trabecular bone mineral density, microarchitecture and mechanical property. Clin Imaging 2016; 40: pp. 330-338.
15. Boyanov M.: Estimation of lumbar spine bone mineral density by dual-energy X-ray absorptiometry: standard anteroposterior scans vs sub-regional analyses of whole-body scans. Br J Radiol 2008; 81: pp. 637-642.
16. Feyerabend A.J., Lear J.L.: Regional variations in bone mineral density as assessed with dual-energy photon absorptiometry and dual X-ray absorptiometry. Radiology 1993; 186: pp. 467-469.
17. Nysom K., Molgaard C., Michaelsen K.F.: Bone mineral density in the lumbar spine as determined by dual-energy X-ray absorptiometry. Comparison of whole-body scans and dedicated regional scans. Acta Radiol 1998; 39: pp. 632-636.
18. Franck H., Munz M.: Total body and regional bone mineral densitometry (BMD) and soft tissue measurements: correlations of BMD parameter to lumbar spine and hip. Calcif Tissue Int 2000; 67: pp. 111-115.
19. Liu G., Peacock M., Eilam O., et. al.: Effect of osteoarthritis in the lumbar spine and hip on bone mineral density and diagnosis of osteoporosis in elderly men and women. Osteoporos Int 1997; 7: pp. 564-569.
20. Guglielmi G., Floriani I., Torri V., et. al.: Effect of spinal degenerative changes on volumetric bone mineral density of the central skeleton as measured by quantitative computed tomography. Acta Radiol 2005; 46: pp. 269-275.