
Objectives
To determine the accuracy of three-dimensional k-t broad-use linear acquisition speed-up technique (k-t BLAST) accelerated magnetic resonance imaging (MRI) for the assessment of left ventricular (LV) parameters compared to segmented multiple breath-hold cine imaging.
Methods
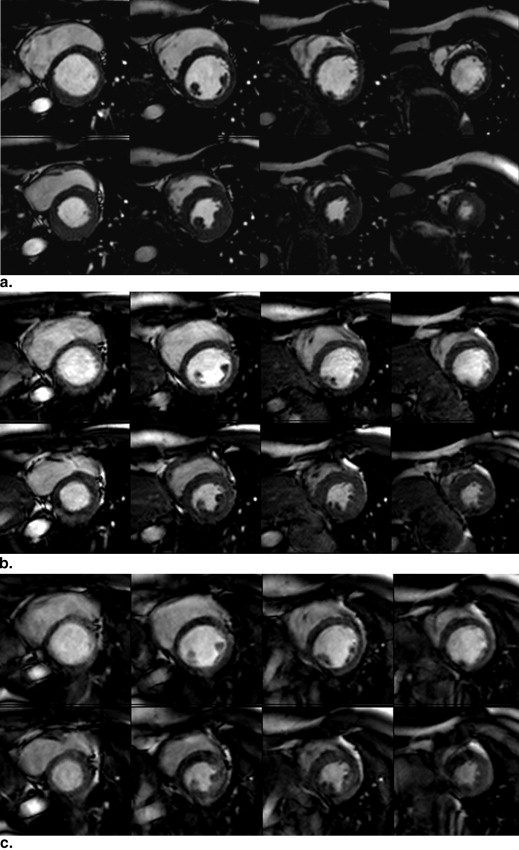
A multislice cine (steady state free precession [SSFP]) sequence was performed with complete ventricular coverage during multiple breath-holds (temporal resolution 47 ms, voxel size 1.25 × 1.25 × 8 mm 3 ). In addition, two k-t BLAST sequences with complete coverage were acquired, KT1 (temporal resolution 57 ms, voxel size 1.25 × 1.25 × 4 mm 3 ) and k-t2 (temporal resolution 57 ms, voxel size 1.25 × 1.25 × 8 mm 3 ), during a single breath-hold. For comparison of SSFP and k-t BLAST, LV parameters were determined: ejection fraction (EF), end-diastolic volume, end-systolic volume, and LV mass.
Results
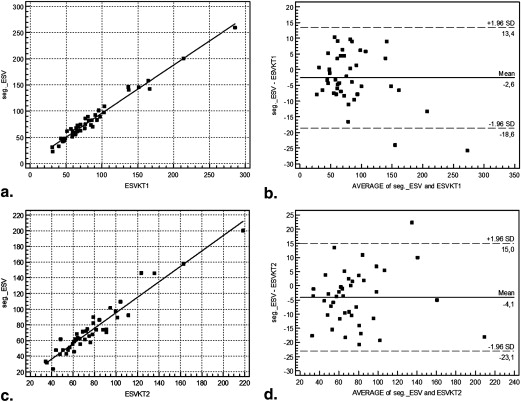
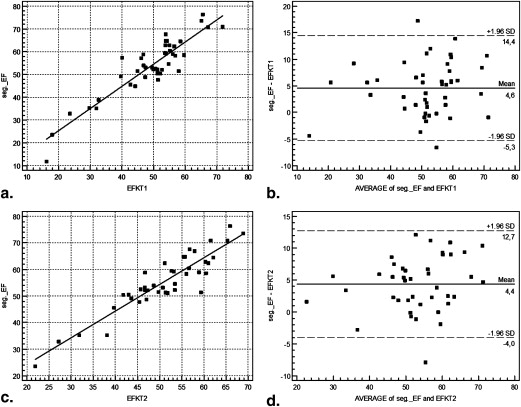
EF was underestimated by KT1 (47%) and KT2 (48%) compared to the SSFP sequence (53%). All parameters showed high correlation with the k-t BLAST sequences and the SSFP sequence ( r = 0.88–0.98, P < .001). The mean relative difference for KT1/KT2 compared to the SSFP sequence was −0.11/−0.09 for the EF, −0.073/−0.086 for the EDV, 0.044/0.051 for the ESV, and 0.085/0.12 for the LV mass.
Conclusions
The use of three-dimensional k-t BLAST enabled a determination of the LV parameters with high correlation compared to the SSFP sequence. EF was slightly underestimated, and LV mass was slightly overestimated.
Cardiovascular magnetic resonance imaging (MRI) is known as the standard of reference for the assessment of global left ventricular (LV) parameters, which allows the accurate and reproducible acquisition of LV volumes and mass . Imaging the beating heart with the use of MRI is challenging as both cardiac and respiratory motions have to be compensated. However, for the examination of LV function including the assessment of global LV functional parameters as well as for the assessment of regional wall motion abnormalities, MRI is considered the gold standard for a long time . Some requirements have to be fulfilled to provide the high diagnostic accuracy of MRI in the assessment of LV function. A spatial resolution of at least 2.5 mm in in-plane orientation, a temporal resolution of about 50 ms per frame, and a slice thickness of 8 mm or less should be used . The high-resolution segmented cine steady state free precession (SSFP) technique, which is the most widely used and investigated technique, can be considered as the reference technique. However, this technique consists of a time-consuming acquisition of multiple short-axis slices for coverage of the entire ventricle, so patients are required to perform multiple breath-holds .
Thus, several techniques based on parallel imaging (generalized autocalibrating partially parallel acquisition [GRAPPA], sensitivity encoding [SENSE]) were introduced for shortening the acquisition time. These techniques enable the acquisition of a reduced data set by undersampling in k-space taking into account the spatial encoding effect of coil sensitivity, if multiple receiver coils are used for signal reception . In contrast to the segmented cine SSFP technique, which traditionally requires one breath-hold per slice, the accelerated techniques can acquire the cine data with coverage of the entire left ventricle during one, two, or three breath-holds. However, these techniques involve tradeoffs in spatiotemporal resolution. If the accelerated techniques are carried out with sufficient temporal and spatial resolution, they usually cause a loss of signal-to-noise ratio (SNR) and carrier-to-noise ratio (CNR) compared to the segmented SSFP sequence .
Get Radiology Tree app to read full this article<
Get Radiology Tree app to read full this article<
Material and methods
Subjects
Get Radiology Tree app to read full this article<
MRI
Get Radiology Tree app to read full this article<
Get Radiology Tree app to read full this article<
Get Radiology Tree app to read full this article<
Image Analysis
Get Radiology Tree app to read full this article<
Get Radiology Tree app to read full this article<
Statistical Methods
Get Radiology Tree app to read full this article<
Results
SNR and CNR
Get Radiology Tree app to read full this article<
Global LV Functional Parameters
Get Radiology Tree app to read full this article<
Table 1
Mean Values of Global Left Ventricular Functional Parameters, Determined with the Different Cine Techniques and Mean Relative Differences of the Values, Determined with the k-t BLAST Techniques Compared to the Reference Technique
Mean Value Segmented SSFP Mean Value KT1 Mean Value KT2 Mean Relative Difference KT1 Mean Relative Difference KT2 EDV 168 ± 46 mL 158 ± 50 mL 155 ± 38 mL −7.3% −8.6% ESV 81 ± 43 mL 84 ± 48 mL 78 ± 34 mL +5.1% +4.4% EF 54.1 ± 12.4% 49.2 ± 12.0% 50.9 ± 9.9% −11% −9.0% LV mass 99 ± 36 g/m 2 108 ± 36 g/m 2 111 ± 32 g/m 2 +8.5% +12%
BLAST, broad-use linear acquisition speed-up technique; SSFP, steady state free precession; KT1, first three-dimensional sequence; KT2, second three-dimensional sequence; EDV, end-diastolic volume; ESV, end-systolic volume; EF, ejection fraction; LV mass, left ventricular myocardium mass.
Get Radiology Tree app to read full this article<
Get Radiology Tree app to read full this article<
Get Radiology Tree app to read full this article<
Get Radiology Tree app to read full this article<
Get Radiology Tree app to read full this article<
Get Radiology Tree app to read full this article<
Get Radiology Tree app to read full this article<
Table 2
Mean Values of Image Quality Scores
Segmented SSFP Aliasing Artefacts Segmented SSFP Overall KT1 Aliasing Artefacts KT1 Overall KT2 Aliasing Artefacts KT2 Overall Observer 1 3.8 3.9 3.0 3.1 3.4 3.2 Observer 2 3.9 3.7 3.1 3.2 3.4 3.5
SSFP, steady state free precession; KT1, first three-dimensional sequence; KT2, second three-dimensional sequence.
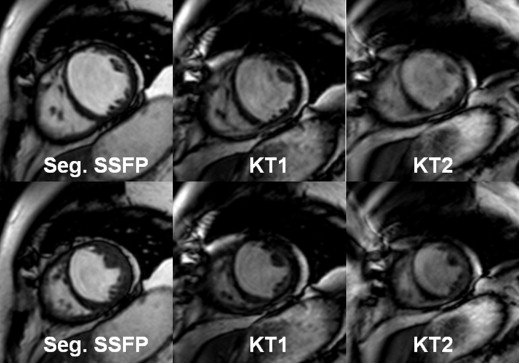
SSFP, evaluation of the presence of aliasing artefacts and overall image quality by two observers using a 4-point scale (overall image quality: 4 = excellent, 3 = good, 2 = moderate, 1 = fair; aliasing artefacts: 4 = not visible, 3 = visible, 2 = visible with relevant influence on overall image, 1 = strong artefacts).
Get Radiology Tree app to read full this article<
Discussion
Get Radiology Tree app to read full this article<
Get Radiology Tree app to read full this article<
Get Radiology Tree app to read full this article<
Get Radiology Tree app to read full this article<
Get Radiology Tree app to read full this article<
Get Radiology Tree app to read full this article<
Get Radiology Tree app to read full this article<
Get Radiology Tree app to read full this article<
Get Radiology Tree app to read full this article<
Get Radiology Tree app to read full this article<
Get Radiology Tree app to read full this article<
Get Radiology Tree app to read full this article<
Study Limitations
Get Radiology Tree app to read full this article<
References
1. Bellenger N.G., Pennell D.J.: Assessment of cardiac function.Manning W.J.Pennell D.J.Cardiovascular magnetic resonance.2002.Churchill LivingstonePhiladelphia:pp. 103.
2. Pennell D.J., Sechtem U.P., Higgins C.B., et. al.: Clinical indications for cardiovascular magnetic resonance (CMR): consensus panel report. Eur Heart J 2004; 25: pp. 1940-1965.
3. Pattynama P.M.T., Lamb H., van der Velde E.A., et. al.: Left ventricular measurements by cine and spin-echo MR imaging: a study of reproducibility with variance component analysis. Radiology 1993; 187: pp. 261-268.
4. Pattynama P.M.T., Lamb H.J., van der Velde E.A., et. al.: Reproducibility of MRI-derived measurements of right ventricular volumes and myocardial mass. Magn Reson Imaging 1995; 13: pp. 53-63.
5. Pluim B.M., Lamb H.J., Kayser H.W., et. al.: Functional and metabolic evaluation of the athlete’s heart by magnetic resonance imaging and dobutamine stress magnetic resonance spectroscopy. Circulation 1998; 97: pp. 666-672.
6. Mohiaddin R.H., Hasegawa M.: Measurement of atrial volumes by magnetic resonance imaging in healthy volunteers and in patients with myocardial infarction. Eur Heart J 1995; 16: pp. 106-111.
7. Higgins C.B., Sakuma H.: Heart disease: functional evaluation with MR imaging. Radiology 1996; 199: pp. 307-315.
8. Miller S., Simonetti O.P., Carr J., et. al.: MR Imaging of the heart with cine true fast imaging with steady-state precession: influence of spatial and temporal resolutions on left ventricular functional parameters. Radiology 2002; 223: pp. 263-269.
9. Carr J.C., Simonetti O., Bundy J., et. al.: Cine MR angiography of the heart with segmented true fast imaging with steady-state precession. Radiology 2001; 219: pp. 828-834.
10. Moon J.C., Lorenz C.H., Francis J.M., et. al.: Breathhold FLASH and FISP cardiovascular MR imaging: leftventricular volume differences and reproducibility. Radiology 2002; 223: pp. 789-797.
11. Wintersperger B.J., Nikolaou K., Dietrich O., et. al.: Single breath-hold real-time cine MR imaging: improved temporal resolution using generalized autocalibrating partially parallel acquisition (GRAPPA) algorithm. Eur Radiol 2003; 13: pp. 1931-1936.
12. Kacere R.D., Pereyra M., Nemeth M.A., et. al.: Quantitative assessment of left ventricular function: steady-state free precession MR imaging with or without sensitivity encoding. Radiology 2005; 235: pp. 1031-1035.
13. Mascarenhas N.B., Muthupillai R., Cheong B., et. al.: Fast 3D cine steady-state free precession imaging with sensitivity encoding for assessment of left ventricular function in a single breathhold. AJR Am J Roentgenol 2006; 187: pp. 1235-1239.
14. Pruessmann K.P., Weiger M., Scheidegger M.B., et. al.: SENSE: sensitivity encoding for fast MRI. Magn Reson Med 1999; 42: pp. 952-962.
15. Alley M.T., Napel S., Amano Y., et. al.: Fast 3D cardiac cine MR imaging. J Magn Reson Imaging 1999; 9: pp. 751-755.
16. Jung B.A., Hennig J., Scheffler K.: Single-breathhold 3D-true FISP cine cardiac imaging. Magn Reson Med 2002; 48: pp. 921-925.
17. Tsao J., Boesiger P., Pruessmann K.P.: k-t BLAST and k-t SENSE: dynamic MRI with high frame rate exploiting spatiotemporal correlations. Magn Reson Med 2003; 50: pp. 1031-1042.
18. Tsao J., Kozerke S., Boesiger P., et. al.: Optimizing spatiotemporal sampling for k-t BLAST and k-t SENSE: application to high-resolution real-time cardiac steady-state free precession. Magn Reson Med 2005; 53: pp. 1372-1382.
19. Hansen M.S., Kozerke S., Pruessmann K.P., et. al.: On the influence of training data quality in k-t BLAST reconstruction. Magn Reson Med 2004; 52: pp. 1175-1183.
20. Kozerke S., Tsao J., Razavi R., et. al.: Accelerating cardiac cine 3D imaging using k-t BLAST. Magn Reson Med 2004; 52: pp. 19-26.
21. Lin L.I.: A concordance correlation coefficient to evaluate reproducibility. Biometrics 1989; 45: pp. 255-268.
22. Bland J.M., Altman D.G.: Statistical methods for assessing agreement between two methods of clinical measurement. Lancet 1986; 1: pp. 307-310.
23. Jahnke C., Nagel E., Gebker R., et. al.: Four-dimensional single breathhold magnetic resonance imaging using k-t BLAST enables reliable assessment of left- and right-ventricular volumes and mass. J Magn Reson Imaging 2007; 25: pp. 737-742.
24. Jahnke C., Paetsch I., Gebker R., et. al.: Accelerated 4D dobutamine stress MR imaging with k-t BLAST: feasibility and diagnostic performance. Radiology 2006; 241: pp. 718-728.
25. Greil F.G., Germann S., Kozerke S., et. al.: Assessment of left ventricular volumes and mass with fast 3D cine steady-state free precession k-t space broad-use linear acquisition speed-up technique (k-t BLAST). J Magn Reson Imaging 2008; 27: pp. 510-515.
26. Huber S., Muthupillai R., Mojibian H., et. al.: Rapid assessment of regional and global left ventricular function using three-dimensional k-t BLAST imaging. J Magn Reson Imaging 2008; 26: pp. 727-738.