
Rationale and Objectives
To measure and validate patchy and large myocardial infarction (MI) at 3 days and 5 weeks in beating and nonbeating hearts using contrast-enhanced three-dimensional (3D) inversion-recovery gradient echo (IR-GRE) magnetic resonance imaging (MRI) and microscopy.
Materials and Methods
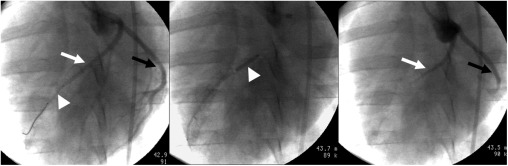
Pigs ( n = 28) were subjected to 1) patchy MI (group I), 2) large MI (group II), or 3) combined (patchy and large) MI (groups III and IV) using microemboli and/or 90-minute left anterior descending (LAD) occlusion and imaged at 3 days and 5 weeks after interventions. Gadolinium diethylenetriamine penta-acetic acid (Gd-DTPA)–enhanced 3D and two-dimensional (2D) IR-GRE were performed for comparison in beating and nonbeating hearts. Macroscopic histochemical and microscopic histopathologic measurements were used for validation.
Results
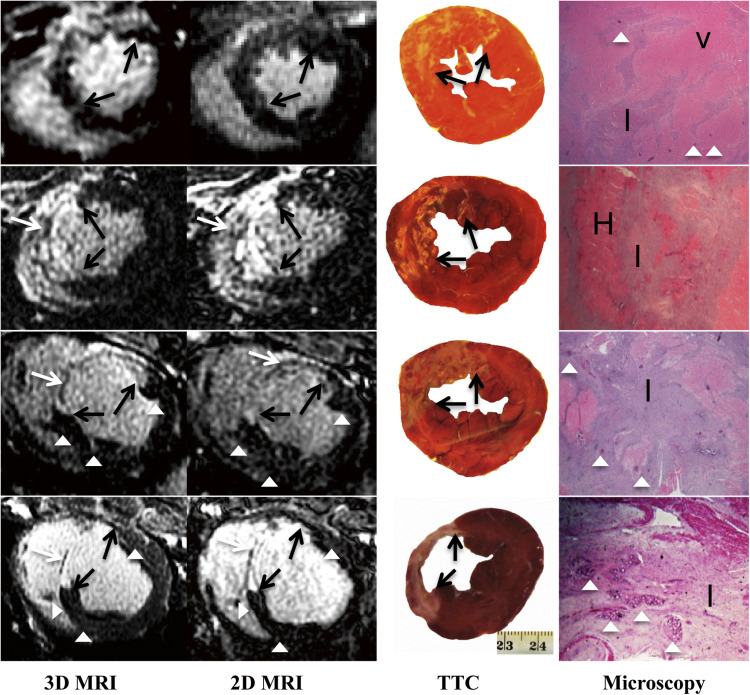
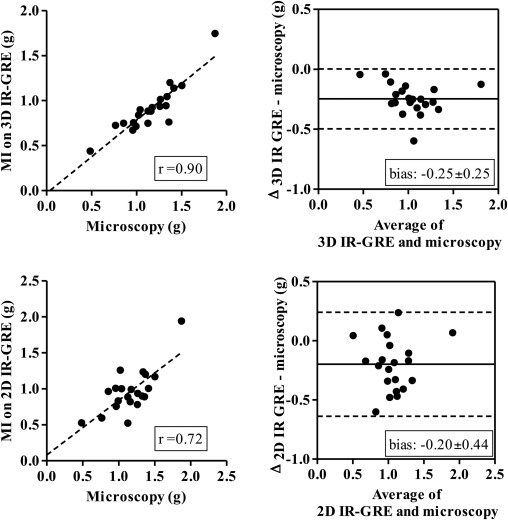
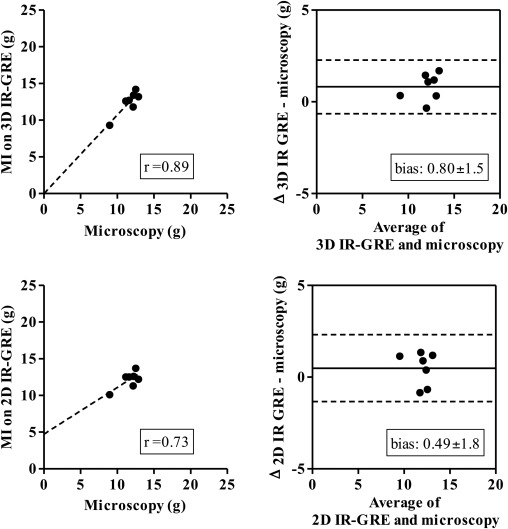
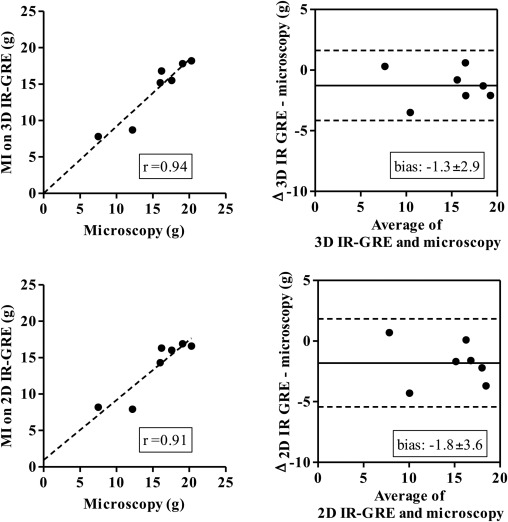
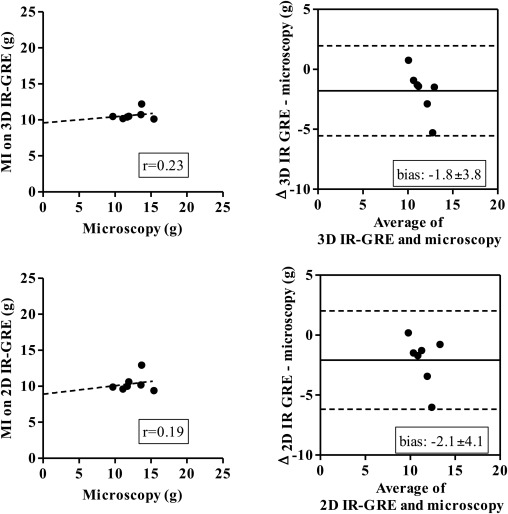
Three-dimensional images demonstrated hyperenhanced patchy microinfarction, large MI, hypoenhanced/hyperenhanced microvascular obstruction, and infarct resorption. Acute and chronic combined MI on 3D was underestimated compared to microscopy (bias: −1.8 ± 3.8%) but overestimated acute large infarction. In beating and nonbeating hearts, close correlations/agreements were found between 3D/2D acquisitions in all groups (beating hearts: r = 0.70–0.99; bias: group I 0.47 ± 2.0%, II 0.33 ± 1.2%, III 0.54 ± 1.5%, and IV 0.28 ± 1.0%).
Conclusions
The 3D IR-GRE underestimated the extent of acute and chronic combined MI compared to microscopic measurements. This sequence may have the potential to differentiate patchy from large MI and demonstrate MI healing after coronary interventions.
Coronary artery disease remains the main cause of death in developed countries . Obstruction of major and minor coronary arteries results in the development of large and patchy myocardial infarction (MI), respectively. The extent and pattern of MI is a determinant factor for prognosis and patient survival . Accurate quantification of infarction provides important information to guide clinicians in deciding which patients are likely to receive benefit from a revascularization procedure .
Positron emission tomography, single-photon emission computed tomography, echocardiography, and magnetic resonance imaging (MRI) have been the clinical modalities for assessing myocardial viability. The reference standard for cardiac MRI is two-dimensional (2D) inversion-recovery gradient echo sequence (IR-GRE), but the main limitation of this sequence is the long acquisition time . The recently developed contrast-enhanced three-dimensional (3D) IR-GRE or turbo FLASH has been validated against 2D IR-GRE in patients and swine using different field strengths but not in nonbeating hearts on 2D, 3D IR-GRE or microscopy. The purpose of this MRI study was to 1) determine the diagnostic value of delayed contrast-enhanced 3D IR-GRE for measuring acute and chronic patchy and large MI in a beating and nonbeating swine heart model and 2) validate the extent of acute and chronic MI measured on 3D IR-GRE against 2D IR-GRE, macroscopic histochemical, and microscopic histopathologic techniques.
Materials and methods
Animal Preparation
Get Radiology Tree app to read full this article<
Get Radiology Tree app to read full this article<
Get Radiology Tree app to read full this article<
Magnetic Resonance Imaging
Get Radiology Tree app to read full this article<
Microscopy
Get Radiology Tree app to read full this article<
Image Analysis
Get Radiology Tree app to read full this article<
Statistical Analysis
Get Radiology Tree app to read full this article<
Results
MRI of Patchy and Large MI
Get Radiology Tree app to read full this article<
Get Radiology Tree app to read full this article<
Table 1
Comparison of the MI/remote Myocardium Signal Intensity (SI) Ratio in Patchy and Large Infarction on 3D and 2D IR-GRE Acquisitions (Note the Significant Effect of Motion on SI Ratio)
Group 3D IR-GRE 2D IR-GRE Beating heart Group I 1.8 ± 0.1 † 1.8 ± 0.1 † Group II 2.5 ± 0.1 2.5 ± 0.1 Group III 2.5 ± 0.1 2.6 ± 0.1 Group IV 2.6 ± 0.1 2.6 ± 0.1 Nonbeating heart Group I 2.2 ± 0.1 ∗ † 2.1 ± 0.1 ∗ † Group I 2.2 ± 0.1 ∗ † 2.1 ± 0.1 ∗ † Group II 3.3 ± 0.1 ∗ 3.2 ± 0.1 ∗ Group III 3.0 ± 0.1 ∗ 3.0 ± 0.1 ∗ Group IV 3.2 ± 0.1 ∗ 3.3 ± 0.1 ∗
IR-GRE, inversion-recovery gradient echo; MI, myocardial infarction; 2D, two-dimensional; 3D, three-dimensional.
Get Radiology Tree app to read full this article<
Get Radiology Tree app to read full this article<
Get Radiology Tree app to read full this article<
Microscopic Validation
Get Radiology Tree app to read full this article<
Table 2
Comparison of the Extent of MI on 3D, 2D IR-GRE Acquisitions, Histochemical Staining (TTC), and Microscopic Histopathology
Group 3D IR-GRE 2D IR-GRE TTC Microscopy Beating heart Group I 8.2 ± 0.5 7.7 ± 0.5 Group II 12.5 ± 0.6 ∗ § 12.1 ± 0.4 ∗ Group III 14.3 ± 1.6 ∗ 13.7 ± 1.5 ∗ Group IV 10.6 ± 0.3 ‖ 10.4 ± 0.5 ‖ Nonbeating heart Group I 7.7 ± 0.4 7.9 ± 0.6 7.4 ± 0.4 Group II 12.7 ± 0.5 ∗ 12.4 ± 0.4 ∗ 13.0 ± 1.6 ∗ 11.6 ± 0.5 Group III 14.1 ± 1.7 ∗ § 14.1 ± 1.9 ∗ § 13.6 ± 1.4 ∗ § 15.6 ± 1.7 † ‡ Group IV 10.3 ± 0.4 § ‖ 10.4 ± 0.3 § ‖ 10.5 ± 1.2 § ‖ 12.4 ± 0.7 ‖
IR-GRE, inversion-recovery gradient echo; MI, myocardial infarction; TTC, triphenyltetrazolium chloride; 2D, two-dimensional; 3D, three-dimensional.
Get Radiology Tree app to read full this article<
Get Radiology Tree app to read full this article<
Get Radiology Tree app to read full this article<
Get Radiology Tree app to read full this article<
Get Radiology Tree app to read full this article<
Get Radiology Tree app to read full this article<
Get Radiology Tree app to read full this article<
Get Radiology Tree app to read full this article<
Get Radiology Tree app to read full this article<
Get Radiology Tree app to read full this article<
Beating Versus Nonbeating Hearts
Get Radiology Tree app to read full this article<
Discussion
Get Radiology Tree app to read full this article<
Get Radiology Tree app to read full this article<
Get Radiology Tree app to read full this article<
Get Radiology Tree app to read full this article<
Get Radiology Tree app to read full this article<
Get Radiology Tree app to read full this article<
Get Radiology Tree app to read full this article<
Get Radiology Tree app to read full this article<
References
1. Go A.S., Mozaffarian D., Roger V.L., et. al.: Heart disease and stroke statistics–2014 update: a report from the American Heart Association. Circulation 2014; 129: pp. e28-e292.
2. West A.M., Kramer C.M.: Cardiovascular magnetic resonance imaging of myocardial infarction, viability, and cardiomyopathies. Current Problems Cardiol 2010; 35: pp. 176-220.
3. Selvanayagam J.B., Kardos A., Francis J.M., et. al.: Value of delayed-enhancement cardiovascular magnetic resonance imaging in predicting myocardial viability after surgical revascularization. Circulation 2004; 110: pp. 1535-1541.
4. Simonetti O., Kim R., Fieno D., et. al.: An improved MR imaging technique for the visualization of myocardial infarction. Radiology 2001; 218: pp. 215-223.
5. Dewey M., Laule M., Taupitz M., et. al.: Myocardial viability: assessment with three-dimensional MR imaging in pigs and patients. Radiology 2006; 239: pp. 703-709.
6. Peukert D., Laule M., Taupitz M., et. al.: 3D and 2D delayed-enhancement magnetic resonance imaging for detection of myocardial infarction: preclinical and clinical results. Acad Radiol 2007; 14: pp. 788-794.
7. Tatli S., Zou K.H., Fruitman M., et. al.: Three-dimensional magnetic resonance imaging technique for myocardial-delayed hyperenhancement: a comparison with the two-dimensional technique. J Magn Reson Imaging 2004; 20: pp. 378-382.
8. Goetti R., Kozerke S., Donati O.F., et. al.: Acute, subacute, and chronic myocardial infarction: quantitative comparison of 2D and 3D late gadolinium enhancement MR imaging. Radiology 2011; 259: pp. 704-711.
9. Peters D.C., Appelbaum E.A., Nezafat R., et. al.: Left ventricular infarct size, peri-infarct zone, and papillary scar measurements: a comparison of high-resolution 3D and conventional 2D late gadolinium enhancement cardiac MR. J Magn Reson Imaging 2009; 30: pp. 794-800.
10. Bauner K.U., Muehling O., Theisen D., et. al.: Assessment of myocardial viability with 3D MRI at 3 T. AJR Am J Roentgenol 2009; 192: pp. 1645-1650.
11. Kino A., Zuehlsdorff S., Sheehan J.J., et. al.: Three-dimensional phase-sensitive inversion-recovery turbo FLASH sequence for the evaluation of left ventricular myocardial scar. AJR Am J Roentgenol 2009; 193: pp. W381-W388.
12. Kino A., Keeling A.N., Farrelly C.T., et. al.: Assessment of left ventricular myocardial scar in infiltrative and non-ischemic cardiac diseases by free breathing three dimensional phase sensitive inversion recovery (PSIR) TurboFLASH. Int J Cardiovasc Imaging 2011; 27: pp. 527-537.
13. Nguyen T.D., Spincemaille P., Weinsaft J.W., et. al.: A fast navigator-gated 3D sequence for delayed enhancement MRI of the myocardium: comparison with breathhold 2D imaging. J Magn Reson Imaging 2008; 27: pp. 802-808.
14. Yin G., Zhao S., Lu M., et. al.: Assessment of left ventricular myocardial scar in coronary artery disease by a three-dimensional MR imaging technique. J Magn Reson Imaging 2013; 38: pp. 72-79.
15. Varga-Szemes A., Kiss P., Brott B.C., et. al.: Embozene microspheres induced nonreperfused myocardial infarction in an experimental swine model. Cathet Cardiovasc Intervent 2013; 81: pp. 689-697.
16. Indik J.H., Allen D., Gura M., et. al.: Utility of the ventricular fibrillation waveform to predict a return of spontaneous circulation and distinguish acute from post myocardial infarction or normal swine in ventricular fibrillation cardiac arrest. Circ Arrhythm Electrophysiol 2011; 4: pp. 337-343.
17. Saeed M., Hetts S.W., Do L., et. al.: Coronary microemboli effects in preexisting acute infarcts in a swine model: cardiac MR imaging indices, injury biomarkers, and histopathologic assessment. Radiology 2013; 268: pp. 98-108.
18. Saeed M., Saloner D., Martin A., et. al.: Adeno-associated viral vector-encoding vascular endothelial growth factor gene: effect on cardiovascular MR perfusion and infarct resorption measurements in swine. Radiology 2007; 243: pp. 451-460.
19. Schwartz R.S., Burke A., Farb A., et. al.: Microemboli and microvascular obstruction in acute coronary thrombosis and sudden coronary death: relation to epicardial plaque histopathology. J Am Coll Cardiol 2009; 54: pp. 2167-2173.
20. Saeed M., Lee R.J., Weber O., et. al.: Scarred myocardium imposes additional burden on remote viable myocardium despite a reduction in the extent of area with late contrast MR enhancement. Eur Radiol 2006; 16: pp. 827-836.
21. Heiberg E., Engblom H., Engvall J., et. al.: Semi-automatic quantification of myocardial infarction from delayed contrast enhanced magnetic resonance imaging. Scand Cardiovasc J 2005; 39: pp. 267-275.
22. Heiberg E., Ugander M., Engblom H., et. al.: Automated quantification of myocardial infarction from MR images by accounting for partial volume effects: animal, phantom, and human study. Radiology 2008; 246: pp. 581-588.
23. Breuckmann F., Nassenstein K., Bucher C., et. al.: Systematic analysis of functional and structural changes after coronary microembolization: a cardiac magnetic resonance imaging study. J Am Coll Cardiol Img 2009; 2: pp. 121-130.
24. Jablonowski R., Nordlund D., Kanski M., et. al.: Infarct quantification using 3D inversion recovery and 2D phase sensitive inversion recovery; validation in patients and ex vivo. BMC Cardiovasc Disord 2013; 13: pp. 110.
25. Yan A.T., Shayne A.J., Brown K.A., et. al.: Characterization of the peri-infarct zone by contrast-enhanced cardiac magnetic resonance imaging is a powerful predictor of post-myocardial infarction mortality. Circulation 2006; 114: pp. 32-39.
26. O’Regan D.P., Ahmed R., Neuwirth C., et. al.: Cardiac MRI of myocardial salvage at the peri-infarct border zones after primary coronary intervention. Am J Physiol Heart Circ Physiol 2009; 297: pp. H340-H346.
27. Robbers L.F., Delewi R., Nijveldt R., et. al.: Myocardial infarct heterogeneity assessment by late gadolinium enhancement cardiovascular magnetic resonance imaging shows predictive value for ventricular arrhythmia development after acute myocardial infarction. Eur Heart J Cardiovasc Imaging 2013; 14: pp. 1150-1158.
28. Crawford T., Cowger J., Desjardins B., et. al.: Determinants of postinfarction ventricular tachycardia. Circ Arrhythm Electrophysiol 2010; 3: pp. 624-631.
29. Wu K.C.: CMR of microvascular obstruction and hemorrhage in myocardial infarction. J Cardiovasc Magn Reson 2012; 14: pp. 68.
30. Fieno D.S., Hillenbrand H.B., Rehwald W.G., et. al.: Infarct resorption, compensatory hypertrophy, and differing patterns of ventricular remodeling following myocardial infarctions of varying size. J Am Coll Cardiol 2004; 43: pp. 2124-2131.
31. Kuhl H.P., Papavasiliu T.S., Beek A.M., et. al.: Myocardial viability: rapid assessment with delayed contrast-enhanced MR imaging with three-dimensional inversion-recovery prepared pulse sequence. Radiology 2004; 230: pp. 576-582.
32. Ugander M., Oki A.J., Hsu L.Y., et. al.: Extracellular volume imaging by magnetic resonance imaging provides insights into overt and sub-clinical myocardial pathology. Eur Heart J 2012; 33: pp. 1268-1278.