
Rationale and Objectives
To determine the intraobserver and interobserver variabilities of thymic measurements on computed tomography (CT) in patients with pathologic diagnosis of thymic hyperplasia or normal thymus.
Materials and Methods
Thirty-three patients with pathologic diagnosis of thymic hyperplasia ( n = 25) or normal thymus ( n = 8) who had identifiable thymus gland on CT were retrospectively studied. Two radiologists independently measured thymic size and CT attenuation. Concordance correlation coefficients (CCCs) and Bland–Altman plots were used to assess intraobserver and interobserver agreements.
Results
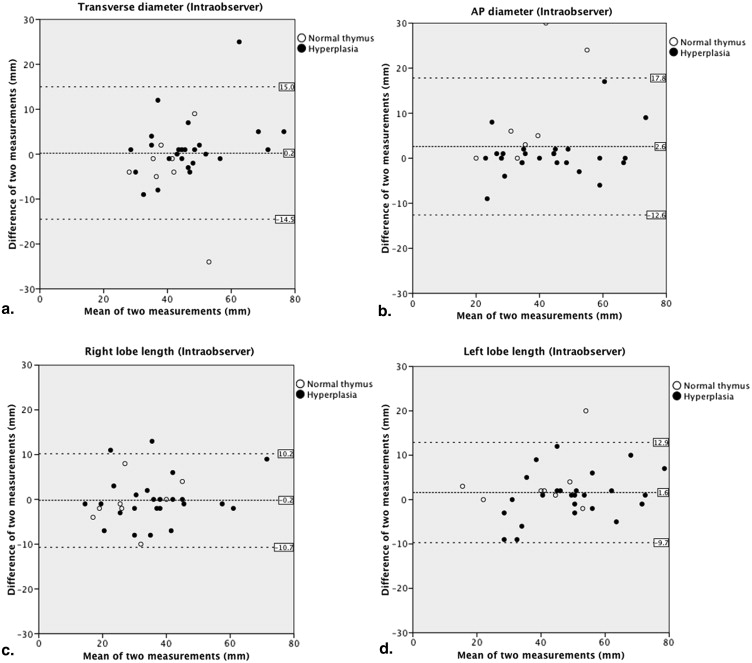
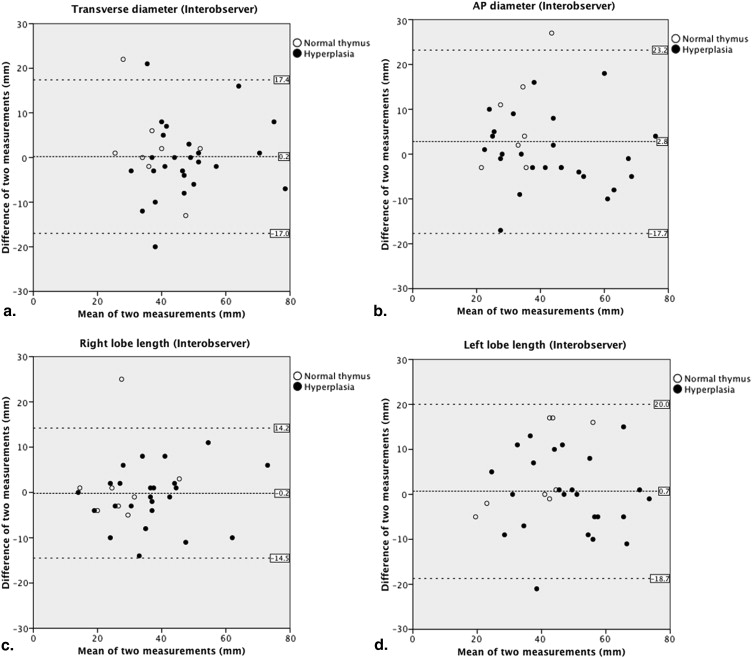
The intraobserver and interobserver agreements of thymic diameters and the lobe length were moderate, with CCCs ranging from 0.73 to 0.89 and from 0.72 to 0.81, respectively. Higher agreement was noted among patients whose measurements were performed on the same CT image in two independent measurements, with intraobserver CCC ≥ 0.95 for diameters and length. After providing readers with an instruction for consistent selection of CT image for measurements, the intraobserver and interobserver agreements improved, resulting in CCCs ranging from 0.81 to 0.92 and from 0.77 to 0.85 for diameters and length, respectively. Thymic lobe thickness had the least agreement. CT attenuation measurements were highly reproducible, with CCCs ranging from 0.88 to 0.97. In patients with thymic CT attenuation >30 HU (Hounsfield unit), the attenuation measurements were more reproducible with narrower 95% limits of agreement.
Conclusions
Thymic size measurements had moderate-to-high intraobserver and interobserver agreements, when the instruction for consistent selection of images was provided to the readers. CT attenuation was highly reproducible, with higher reproducibility for thymic glands with >30 HU. Awareness of thymic measurement variability is necessary when interpreting measured values of normal thymus and thymic pathology on CT.
Thymus demonstrates unique morphologic transition according to age, reaching its maximum weight at puberty and subsequently undergoing “involution”, which is defined as a decrease in size and weight with advancing age . The assessment of thymic size on imaging in relation to patient’s age is an important component of radiologic interpretation of thymus glands and thymic pathology. Measurements of normal and abnormal thymus glands using computed tomography (CT) were extensively studied in early 1980s . Baron et al. studied 154 patients without clinical basis to suspect thymic abnormality, who underwent chest CT, and described width, thickness, and attenuation of the normal thymus in different age groups ranging from 6 to >50 years. Francis et al. revisited the age-related changes of thymic size in 309 patients without clinical evidence of thymic abnormality and 23 patients with thymic abnormalities and described transverse and anterior–posterior (AP) diameters, craniocaudal extent, and thickness of thymus gland in each age group. As demonstrated by these earlier studies, given the unique feature of involution over time, thymic measurements should be interpreted relative to the “normal” measurement values in the corresponding age group of patients.
Ackman et al. recently studied the AP diameter, lobe thickness, CT attenuation, and morphologic features of thymus in subjects who were aged 20–30 years and have presumably normal thymus and reported that the thymus gland had significantly higher attenuation and more commonly had quadrilateral shape in women compared to men. In our previous study of 31 patients with pathologically proven thymic hyperplasia, the size of the thymic gland with hyperplasia was significantly larger compared to the age-matched mean values of normal thymus . The study also demonstrated that the thymic CT attenuation >41.2 HU (Hounsfield unit) on contrast-enhanced CT is suggestive of lymphoid hyperplasia rather than true hyperplasia. The size and the CT attenuation of thymic gland are important factors to define “normal” thymus and to diagnose thymic pathology .
Get Radiology Tree app to read full this article<
Get Radiology Tree app to read full this article<
Materials and methods
Subjects
Get Radiology Tree app to read full this article<
Initial Sets of Thymic Measurements
Get Radiology Tree app to read full this article<
Get Radiology Tree app to read full this article<
Get Radiology Tree app to read full this article<
Second Sets of Measurements after Providing the Instruction for CT Image Selection
Get Radiology Tree app to read full this article<
Statistical Analysis
Get Radiology Tree app to read full this article<
Results
Intraobserver and Interobserver Variabilities of the Initial Sets of Measurements
Get Radiology Tree app to read full this article<
Table 1
Intraobserver Variability of Thymic Measurements: The First Set of Measurements
Thymic Measurements Intraobserver CCC (95% CI) Mean Relative Difference (mm) 95% Limits of Agreement (mm) Transverse diameter 0.73 (0.53–0.85) −2.6 −19.4 to 14.1 AP diameter 0.80 (0.63–0.89) −0.3 −20.5 to 19.9 Right lobe length 0.89 (0.79–0.94) −1.8 −12.7 to 9.1 Left lobe length 0.76 (0.57–0.87) −1.9 −23.1 to 19.2 Right lobe thickness 0.61 (0.35–0.78) 0.7 −11.2 to 12.6 Left lobe thickness 0.65 (0.41–0.81) 0.2 −9.0 to 9.3 CT attenuation 0.91 (0.82–0.95) 4.5 (HU) −24.5 to 33.4 (HU)
AP, anterior–posterior; CCC, concordance correlation coefficient; CI, confidence interval; CT, computed tomography; HU, Hounsfield unit.
Get Radiology Tree app to read full this article<
Get Radiology Tree app to read full this article<
Table 2
Interobserver Variability of Thymic Measurements: The Second Sets of Measurements
Thymic Measurements Interobserver CCC (95% CI) Mean Relative Difference (mm) 95% Limits of Agreement (mm) Transverse diameter 0.81 (0.66–0.90) −1.2 −14.6 to 12.2 AP diameter 0.72 (0.52–0.85) −1.3 −24.8 to 22.2 Right lobe length 0.80 (0.66–0.89) −5.9 −17.0 to 5.1 Left lobe length 0.73 (0.53–0.85) 0.2 −21.9 to 22.4 Right lobe thickness 0.56 (0.29–0.75) −2.8 −16.6 to 11.0 Left lobe thickness 0.59 (0.34–0.76) −2.1 −12.6 to 8.4 CT attenuation 0.90 (0.80–0.95) 0.1 (HU) −31.7 to 31.8 (HU)
AP, anterior–posterior; CCC, concordance correlation coefficient; CI, confidence interval; CT, computed tomography; HU, Hounsfield unit.
Get Radiology Tree app to read full this article<
Get Radiology Tree app to read full this article<
Variability and the Selection of Representative CT Image for Measurement
Get Radiology Tree app to read full this article<
Table 3
Intraobserver Variability of Thymic Measurements in Matched and Unmatched CT Image Slice for Measurements
Thymic Measurements Sixteen Patients Measured on the Same Image Seventeen Patients Measured on the Different Images Interobserver CCC (95% CI) Mean Relative Difference (mm) 95% Limits of Agreement (mm) Interobserver CCC (95% CI) Mean Relative Difference (mm) 95% Limits of Agreement (mm) Transverse diameter 0.95 (0.87–0.98) −1.5 −8.8 to 5.8 0.52 (0.14–0.76) −3.7 −26.1 to 18.7 AP diameter 0.99 (0.96–1.00) −0.9 −6.3 to 4.4 0.47 (0.07–0.74) 0.3 −27.8 to 28.4 Right lobe length 0.96 (0.90–0.99) −1.4 −7.7 to 4.8 0.80 (0.54–0.92) −2.1 −16.4 to 12.2 Left lobe length 0.97 (0.93–0.99) −2.8 −8.1 to 2.5 0.47 (0.04–0.76) −1.1 −30.5 to 28.3 Right lobe thickness 0.76 (0.48–0.90) −0.2 −10.7 to 10.3 0.36 (−0.11 to 0.70) 1.6 −11.7 to 14.9 Left lobe thickness 0.80 (0.53–0.93) −0.8 −8.1 to 6.6 0.48 (0.04–0.76) 1.1 −9.4 to 11.6 CT attenuation 0.99 (0.98–1.00) 0.6 (HU) −6.9 to 8.1 (HU) 0.86 (0.66–0.94) 8.1 (HU) −30.7 to 46.9 (HU)
AP, anterior–posterior; CCC, concordance correlation coefficient; CI, confidence interval; CT, computed tomography; HU, Hounsfield unit.
Get Radiology Tree app to read full this article<
Intraobserver and Interobserver Variabilities of the Second Sets of Measurements
Get Radiology Tree app to read full this article<
Get Radiology Tree app to read full this article<
Table 4
Intraobserver Variability of Thymic Measurements: The Second Set of Measurements
Thymic Measurements Intraobserver CCC (95% CI) Mean Relative Difference (mm) 95% Limits of Agreement (mm) Transverse diameter 0.81 (0.66–0.90) 0.2 −14.5 to 15.0 AP diameter 0.85 (0.72–0.92) 2.6 −12.6 to 17.8 Right lobe length 0.92 (0.84–0.96) −0.2 −10.7 to 10.2 Left lobe length 0.92 (0.85–0.96) 1.6 −9.7 to 12.9 Right lobe thickness 0.91 (0.82–0.95) −0.2 −5.3 to 4.9 Left lobe thickness 0.83 (0.70–0.91) 0.2 −6.3 to 6.7 CT attenuation 0.97 (0.94–0.99) 0.9 (HU) −16.1 to 18.0 (HU)
AP, anterior–posterior; CCC, concordance correlation coefficient; CI, confidence interval; CT, computed tomography; HU, Hounsfield unit.
Table 5
Interobserver Variability of Thymic Measurements: The Second Set of Measurements
Thymic Measurements Interobserver CCC (95% CI) Mean Relative Difference (mm) 95% Limits of Agreement (mm) Transverse diameter 0.78 (0.61–0.89) 0.2 −17.0 to 17.4 AP diameter 0.77 (0.58–0.88) 2.8 −17.7 to 23.2 Right lobe length 0.85 (0.72–0.92) −0.2 −14.5 to 14.2 Left lobe length 0.82 (0.68–0.91) 0.7 −18.7 to 20.0 Right lobe thickness 0.80 (0.64–0.89) −1.2 −9.2 to 6.9 Left lobe thickness 0.57 (0.29–0.76) 0.1 −11.0 to 11.2 CT attenuation 0.88 (0.78–0.94) −2.9 (HU) −38.4 to 32.5 (HU)
AP, anterior–posterior; CCC, concordance correlation coefficient; CI, confidence interval; CT, computed tomography; HU, Hounsfield unit.
Get Radiology Tree app to read full this article<
Discussion
Get Radiology Tree app to read full this article<
Get Radiology Tree app to read full this article<
Get Radiology Tree app to read full this article<
Get Radiology Tree app to read full this article<
Get Radiology Tree app to read full this article<
Get Radiology Tree app to read full this article<
Get Radiology Tree app to read full this article<
Get Radiology Tree app to read full this article<
Get Radiology Tree app to read full this article<
Get Radiology Tree app to read full this article<
Get Radiology Tree app to read full this article<
Get Radiology Tree app to read full this article<
Get Radiology Tree app to read full this article<
References
1. Nishino M., Ashiku S.K., Kocher O.N., et. al.: The thymus: a comprehensive review. Radiographics 2006; 26: pp. 335-348.
2. Nasseri F., Eftekhari F.: Clinical and radiologic review of the normal and abnormal thymus: pearls and pitfalls. Radiographics 2010; 30: pp. 413-428.
3. Steinmann G.: Changes in the human thymus during aging.The Human Thymus.1986.SpringerNew York City, New York:pp. 43-88.
4. Baron R., Lee J., Sagel S., et. al.: Computed tomography of the normal thymus. Radiology 1982; 142: pp. 121-125.
5. Baron R., Lee J., Sagel S., et. al.: Computed tomography of the abnormal thymus. Radiology 1982; 142: pp. 127-134.
6. Francis I., Glazer G., Bookstein F., et. al.: The thymus: reexamination of age-related changes in size and shape. AJR Am J Roentgenol 1985; 145: pp. 249-254.
7. Moore A.V., Korobkin M., Olanow W., et. al.: Age-related changes in the thymus gland: CT-pathologic correlation. AJR Am J Roentgenol 1983; 141: pp. 241-246.
8. Keats T.E., Sistrom C.: Atlas of radiologic measurement.7th ed2001.Mosby IncMaryland Heights, Missouri
9. Ackman J.B., Kovacina B., Carter B.W., et. al.: Sex difference in normal thymic appearance in adults 20–30 years of age. Radiology 2013; 268: pp. 245-253.
10. Araki T., Sholl L.M., Gerbaudo V.H., Hatabu H., Nishino M.: Imaging characteristics of pathologically proven thymic hyperplasia: identifying features that can differentiate true from lymphoid hyperplasia. AJR American Journal of Roentgenology 2014; 202: pp. 471-478.
11. Shimosato Y., Mukai K.: Tumors of the mediastinum: atlas of tumor pathology, 3rd series1997.Armed Forces Institute of PathologyWashington, DCpp. 158-168.
12. Lavini C.: Thymus gland pathology: clinical, diagnostic, and therapeutic features.2008.SpringerNew York City, New York
13. Zhao B., James L.P., Moskowitz C.S., et. al.: Evaluating variability in tumor measurements from same-day repeat CT scans of patients with non–small cell lung cancer. Radiology 2009; 252: pp. 263-272.
14. Nishino M., Guo M., Jackman D.M., et. al.: CT tumor volume measurement in advanced non-small-cell lung cancer: performance characteristics of an emerging clinical tool. Academic radiology 2011; 18: pp. 54-62.
15. Hasselbalch H., Nielsen M.B., Jeppesen D., et. al.: Sonographic measurement of the thymus in infants. European Radiology 1996; 6: pp. 700-703.
16. Lin L.I.: A concordance correlation coefficient to evaluate reproducibility. Biometrics 1989; 45: pp. 255-268.
17. Nishino M., Jackman D.M., Hatabu H., et. al.: New Response Evaluation Criteria in Solid Tumors (RECIST) guidelines for advanced non-small cell lung cancer: comparison with original RECIST and impact on assessment of tumor response to targeted therapy. AJR American Journal of Roentgenology 2010; 195: pp. W221-W228.
18. Altman D.G., Bland J.M.: Measurement in medicine: the analysis of method comparison studies. Statistician 1983; 32: pp. 307-317.
19. Bland J.M., Altman D.G.: Statistical methods for assessing agreement between two methods of clinical measurement. Lancet 1986; 1: pp. 307-310.
20. McErlean A., Panicek D.M., Zabor E.C., et. al.: Intra- and Interobserver variability in CT measurements in oncology. Radiology 2013; 269: pp. 451-459.
21. Dewitte K., Fierens C., Stockl D., et. al.: Application of the Bland-Altman plot for interpretation of method-comparison studies: a critical investigation of its practice. Clinical Chemistry 2002; 48: pp. 799-801. author reply 801–2