
Rationale and Objectives
The aim of the present study was to characterize the kinetics of two nanoparticle-based contrast agents for preclinical imaging, Exitron nano 6000 and Exitron nano 12000, and the iodinated agent eXIA 160 in both healthy mice and in a mouse model of hepatocellular carcinoma (HCC). Semiautomatic segmentation of liver lesions for estimation of total tumor load of the liver was evaluated in HCC mice.
Materials and Methods
The normal time course of contrast enhancement was assessed in 15 healthy C57BL/6 mice. Imaging of tumor spread in the liver was evaluated in 15 mice harboring a transgenic HCC model (ASV-B mice). Automatic segmentation of liver lesions for determination of total tumor burden of the liver was tested in three additional ASV-B mice before and after an experimental therapy.
Results
In healthy mice, clearance of the contrast agent from blood was completed within 3–4 hours for eXIA 160 and Exitron nano 6000, whereas complete blood clearance of Exitron nano 12000 required about 24 hours. eXIA 160 provided maximum liver contrast at 1 hour post injection (p.i.) followed by a continuous decline. Enhancement of liver contrast with Exitron nano 6000 and Exitron nano 12000 reached a plateau at about 4 hours p.i., which lasted until the end of the measurements at 96 hours p.i. Maximum contrast enhancement of the liver was not statistically different between Exitron nano 6000 and Exitron nano 12000, but was about three times lower for eXIA 160 ( P < .05). Visually Exitron nano 12000 provided the best liver-to-tumor contrast. Semiautomatic liver and tumor segmentation was feasible after the administration of Exitron nano 12000 but did not work properly for the other two contrast agents.
Conclusions
Both nanoparticle-based contrast agents provided stronger and longer lasting contrast enhancement of healthy liver parenchyma. Exitron nano 12000 allowed automatic segmentation of tumor lesions for estimation of the total tumor load in the liver.
In vivo, noninvasive imaging of rodent models has gained importance in recent years as a tool not only for investigating pathomechanisms of diseases but also for evaluation of new drugs and treatment options . For imaging of structure and morphology, micro–computed tomography (micro-CT) has been widely adopted, not least as part of hybrid imaging systems. Micro-CT especially in combination with positron emission tomography and/or single-photon emission computed tomography (SPECT) has become available in many institutions for preclinical research.
Micro-CT is used for evaluation of the anatomy of healthy mice and for characterization of diseases and therapy-induced changes over time in mouse models of inflammatory and metabolic diseases , cardiovascular diseases and, most frequently, in tumors . Micro-CT has been described as “scaled down” CT for small animals , which requires a very high spatial resolution to provide the same diagnostic accuracy for imaging of small animals than conventional CT provides in humans .
Get Radiology Tree app to read full this article<
Get Radiology Tree app to read full this article<
Get Radiology Tree app to read full this article<
Methods
Animal Preparation
Get Radiology Tree app to read full this article<
Get Radiology Tree app to read full this article<
Contrast Agents and Micro-CT Imaging
Get Radiology Tree app to read full this article<
Get Radiology Tree app to read full this article<
Analyses of Kinetics
Get Radiology Tree app to read full this article<
Get Radiology Tree app to read full this article<
Contrastenhancement(t)=HU(t)−HU(t=0), Contrast
enhancement
(
t
)
=
HU
(
t
)
−
HU
(
t
=
0
)
,
where HU( t ) is the HU value of blood, liver, or spleen at time t (ranging from 0 to 96 hours) and HU ( t = 0) is the corresponding native HU value, that is, before the injection of the contrast agent.
Get Radiology Tree app to read full this article<
Get Radiology Tree app to read full this article<
Lesioncontrast(t)=HU(liver,t)−HU(tumor,t), Lesion
contrast
(
t
)
=
HU
(
liver
,
t
)
−
HU
(
tumor
,
t
)
,
where HU (liver, t ) is the HU value in the normal liver parenchyma at time t (ranging from 0 to 24 hours) and HU (tumor, t ) is the HU value in the tumor lesions at the same time.
Get Radiology Tree app to read full this article<
Get Radiology Tree app to read full this article<
Image Segmentation
Get Radiology Tree app to read full this article<
Get Radiology Tree app to read full this article<
Get Radiology Tree app to read full this article<
Histologic Estimation of Liver Tumor Load
Get Radiology Tree app to read full this article<
Statistical Analyses
Get Radiology Tree app to read full this article<
Get Radiology Tree app to read full this article<
Get Radiology Tree app to read full this article<
Get Radiology Tree app to read full this article<
Results
Get Radiology Tree app to read full this article<
Contrast Agent Kinetics
Get Radiology Tree app to read full this article<
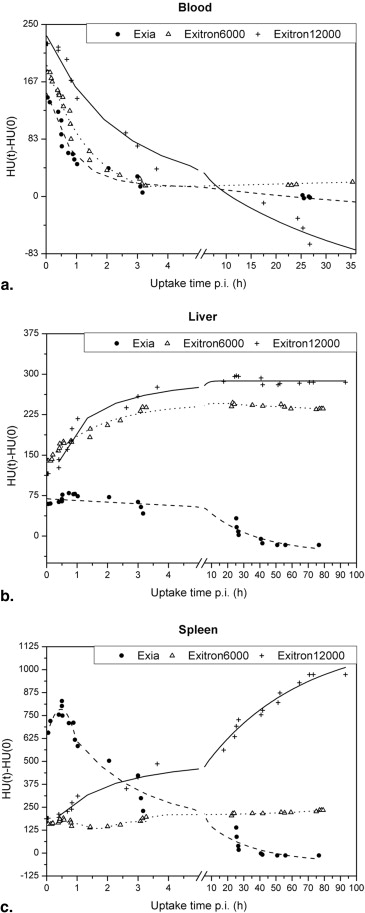
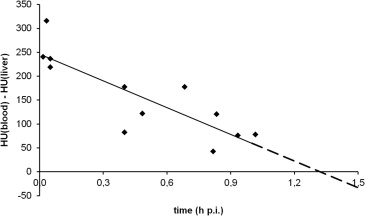
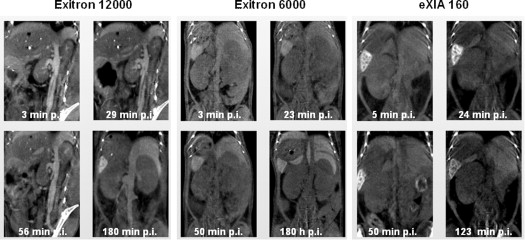
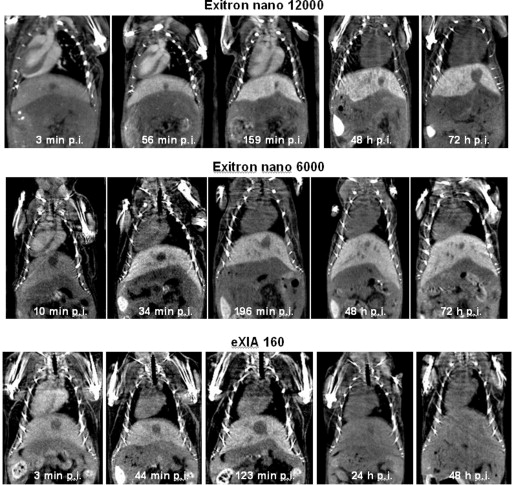
Table 1
Contrast Enhancement (in Hounsfield unit, Median Values, IQR in Parenthesis) of Blood Pool, Liver, and Spleen by the Three Different Contrast Agents During the Course of Observation After Administration
Organ Contrast Agent 0–20 min 20–60 min 60–240 min 12–36 h 36–60 h >60 h Blood eXIA 160 141 (85–194) 56 (38–116) 23 (0–50) 16 (0–32) 0 n/a Exitron nano 6000 121 (111–252) 72 (58–184) 21 (19–43) 15 (0–24) 17 (7–47) 0 Exitron nano 12000 314 (11–413) 284 (74–315) 199 (91–290) 22 (0–28) 0 0 Liver eXIA 160 79 (6–97) 108 (59–135) 68 (15–109) 4 (0–65) 0 n/a Exitron nano 6000 164 ∗ (94–187) 186 ∗ (146–221) 198 ∗ (155–332) 273 ∗ (185–346) 278 ∗ (188–317) 257 (205–302) Exitron nano 12000 109 (14–172) 199 † (94–223) 298 † (212–332) 360 † (250–380) 330 † (186–394) 344 (151–397) Spleen eXIA 160 489 (203–1131) 483 ∗ (183–1495) 381 (65–1025) 23 (0–44) 0 n/a Exitron nano 6000 150 (136–228) 167 (131–248) 200 (85–256) 233 ∗ (157–284) 220 ∗ (184–292) 279 (189–360) Exitron nano 12000 258 (70-294) 274 (63–335) 437 ‡ (332–455) 863 † , ‡ (536–918) 838 † , ‡ (570–897) 1212 ‡ (1095–1216)
Get Radiology Tree app to read full this article<
Get Radiology Tree app to read full this article<
Get Radiology Tree app to read full this article<
Get Radiology Tree app to read full this article<
Get Radiology Tree app to read full this article<
Get Radiology Tree app to read full this article<
Get Radiology Tree app to read full this article<
Get Radiology Tree app to read full this article<
Get Radiology Tree app to read full this article<
Tumor Lesion Contrast
Get Radiology Tree app to read full this article<

Get Radiology Tree app to read full this article<
Get Radiology Tree app to read full this article<
Segmentation of Tumor Burden Before and After Therapy
Get Radiology Tree app to read full this article<
Table 2
Results of the Manual Volumetric Measurements of the Total Liver and the Semiautomatic Volumetry of Tumor Lesions in the Liver in Three ASV-B Mice with Hepatocellular Carcinoma Imaged Before (Pre) and 3 Weeks After (Post) the Initiation of Low-Carbohydrate Diet
Mouse No Total Liver Volume (cm 3 ) Tumor Volume (cm 3 ) Tumor Load (%) Tumor Load (%) Pre Post Pre Post Pre Post Histology (Post) ASV-B 1 6.69 6.48 5.50 4.81 82 73 76 ASV-B 2 6.87 6.90 5.10 4.78 74 69 76 ASV-B 3 7.28 7.38 4.58 3.90 63 53 78
There was no change in total liver volume, whereas tumor volume showed a tendency for reduction after therapy ( P = .109). The last column shows the tumor load determined in histology sections.
Get Radiology Tree app to read full this article<
Discussion
Get Radiology Tree app to read full this article<
Get Radiology Tree app to read full this article<
Get Radiology Tree app to read full this article<
Get Radiology Tree app to read full this article<
Get Radiology Tree app to read full this article<
Get Radiology Tree app to read full this article<
Get Radiology Tree app to read full this article<
Get Radiology Tree app to read full this article<
Get Radiology Tree app to read full this article<
Get Radiology Tree app to read full this article<
Get Radiology Tree app to read full this article<
Get Radiology Tree app to read full this article<
Get Radiology Tree app to read full this article<
Get Radiology Tree app to read full this article<
Conclusions
Get Radiology Tree app to read full this article<
Get Radiology Tree app to read full this article<
Get Radiology Tree app to read full this article<
References
1. Schambach S.J., Bag S., Groden C., et. al.: Vascular imaging in small rodents using micro-CT. Methods 2010; 50: pp. 26-35.
2. Schambach S.J., Bag S., Schilling L., et. al.: Application of micro-CT in small animal imaging. Methods 2010; 50: pp. 2-13.
3. Hallouard F., Anton N., Choquet P., et. al.: Iodinated blood pool contrast media for preclinical X-ray imaging applications—a review. Biomaterials 2010; 31: pp. 6249-6268.
4. Fiebig T., Boll H., Figueiredo G., et. al.: Three-dimensional in vivo imaging of the murine liver: a micro-computed tomography-based anatomical study. PloS One 2012; 7: pp. e31179.
5. Suckow C.E., Stout D.B.: MicroCT liver contrast agent enhancement over time, dose, and mouse strain. Mol Imaging Biol 2008; 10: pp. 114-120.
6. Dorner M., Ploss A.: Deconstructing hepatitis C virus infection in humanized mice. Ann N Y Acad Sci 2011; 1245: pp. 59-62.
7. Gabele E., Dostert K., Dorn C., et. al.: A new model of interactive effects of alcohol and high-fat diet on hepatic fibrosis. Alcohol Clin Exp Res 2011; 35: pp. 1361-1367.
8. Kao C.Y., Hoffman E.A., Beck K.C., et. al.: Long-residence-time nano-scale liposomal iohexol for X-ray-based blood pool imaging. Acad Radiol 2003; 10: pp. 475-483.
9. Prajapati S.I., Keller C.: Contrast enhanced vessel imaging using microCT. J Vis Exp 2011; 47: pp. 2377.
10. Detombe S.A., Dunmore-Buyze J., Drangova M.: Evaluation of eXIA 160 cardiac-related enhancement in C57BL/6 and BALB/c mice using micro-CT. Contrast Media Mol Imaging 2012; 7: pp. 240-246.
11. Almajdub M., Nejjari M., Poncet G., et. al.: In-vivo high-resolution X-ray microtomography for liver and spleen tumor assessment in mice. Contrast Media Mol Imaging 2007; 2: pp. 88-93.
12. Boll H., Figueiredo G., Fiebig T., et. al.: Comparison of Fenestra LC, ExiTron nano 6000, and ExiTron nano 12000 for micro-CT imaging of liver and spleen in mice. Acad Radiol 2013; 20: pp. 1137-1143.
13. Boll H., Nittka S., Doyon F., et. al.: Micro-CT based experimental liver imaging using a nanoparticulate contrast agent: a longitudinal study in mice. PloS One 2011; 6: pp. e25692.
14. Graham K.C., Detombe S.A., MacKenzie L.T., et. al.: Contrast-enhanced microcomputed tomography using intraperitoneal contrast injection for the assessment of tumor-burden in liver metastasis models. Invest Radiol 2008; 43: pp. 488-495.
15. Graham K.C., Ford N.L., MacKenzie L.T., et. al.: Noninvasive quantification of tumor volume in preclinical liver metastasis models using contrast-enhanced x-ray computed tomography. Invest Radiol 2008; 43: pp. 92-99.
16. Bartling S.H., Stiller W., Semmler W., et. al.: Small animal computed tomography imaging. Curr Med Imaging Rev 2007; 3: pp. 45-59.
17. Pialat J.B., Burghardt A.J., Sode M., et. al.: Visual grading of motion induced image degradation in high resolution peripheral computed tomography: impact of image quality on measures of bone density and micro-architecture. Bone 2012; 50: pp. 111-118.
18. Figueiredo G., Brockmann C., Boll H., et. al.: Comparison of digital subtraction angiography, micro-computed tomography angiography and magnetic resonance angiography in the assessment of the cerebrovascular system in live mice. Clin Neuroradiol 2012; 22: pp. 21-28.
19. Schambach S.J., Bag S., Steil V., et. al.: Ultrafast high-resolution in vivo volume-CTA of mice cerebral vessels. Stroke 2009; 40: pp. 1444-1450.
20. Weichert J.P., Lee F.T., Chosy S.G., et. al.: Combined hepatocyte-selective and blood-pool contrast agents for the CT detection of experimental liver tumors in rabbits. Radiology 2000; 216: pp. 865-871.
21. Willekens I., Buls N., De Maeseneer M., et. al.: Use of eXIA 160 XL for contrast studies in micro-computed tomography: experimental observations. Mol Imaging 2013; 12: pp. 1-8.
22. Willekens I., Lahoutte T., Buls N., et. al.: Time-course of contrast enhancement in spleen and liver with Exia 160, Fenestra LC, and VC. Mol Imaging Biol 2009; 11: pp. 128-135.
23. Kass D.A., Hare J.M., Georgakopoulos D.: Murine cardiac function: a cautionary tail. Circ Res 1998; 82: pp. 519-522.
24. Ford N.L., Graham K.C., Groom A.C., et. al.: Time-course characterization of the computed tomography contrast enhancement of an iodinated blood-pool contrast agent in mice using a volumetric flat-panel equipped computed tomography scanner. Invest Radiol 2006; 41: pp. 384-390.
25. Almajdub M., Magnier L., Juillard L., et. al.: Kidney volume quantification using contrast-enhanced in vivo X-ray micro-CT in mice. Contrast Media Mol Imaging 2008; 3: pp. 120-126.
26. Daskalow K., Rohwer N., Raskopf E., et. al.: Role of hypoxia-inducible transcription factor 1 alpha for progression and chemosensitivity of murine hepatocellular carcinoma. J Mol Med 2010; 88: pp. 817-827.
27. Dupuy E., Hainaud P., Villemain A., et. al.: Tumoral angiogenesis and tissue factor expression during hepatocellular carcinoma progression in a transgenic mouse model. J Hepatol 2003; 38: pp. 793-802.
28. Vincent F., Bonnin P., Clemessy M., et. al.: The role of angiotensinogen in hepatocellular carcinoma. Fund Clin Pharmacol 2009; 23: pp. 65.
29. Rothe J.H., Grieser C., Lehmkuhl L., et. al.: Size determination and response assessment of liver metastases with computed tomography—comparison of RECIST and volumetric algorithms. Eur J Radiol 2013; 82: pp. 1831-1839.
30. Rothe J.H., Steffen I.G., Lehmkuhl L., et. al.: Volume measurement of liver metastases using multidetector computed tomography: comparison of lesion diameter and volume segmentation—a phantom study. Rofo 2010; 182: pp. 1082-1090.
31. Ashton J.R., Befera N., Clark D., et. al.: Anatomical and functional imaging of myocardial infarction in mice using micro-CT and eXIA 160 contrast agent. Contrast Media Mol Imaging 2014; 9: pp. 161-168.
32. McDonald M.A., Watkin K.L.: Small particulate gadolinium oxide and gadolinium oxide albumin microspheres as multimodal contrast and therapeutic agents. Invest Radiol 2003; 38: pp. 305-310.
33. Dupuy E., Habib A., Lebret M., et. al.: Thrombin induces angiogenesis and vascular endothelial growth factor expression in human endothelial cells: possible relevance to HIF-1 alpha. J Thromb Haemost 2003; 1: pp. 1096-1102.