
Rationale and Objectives
Diaphragmatic motion in a standing position during tidal breathing remains unclear. The purpose of this observational study was to evaluate diaphragmatic motion during tidal breathing in a standing position in a health screening center cohort using dynamic chest radiography in association with participants’ demographic characteristics.
Materials and Methods
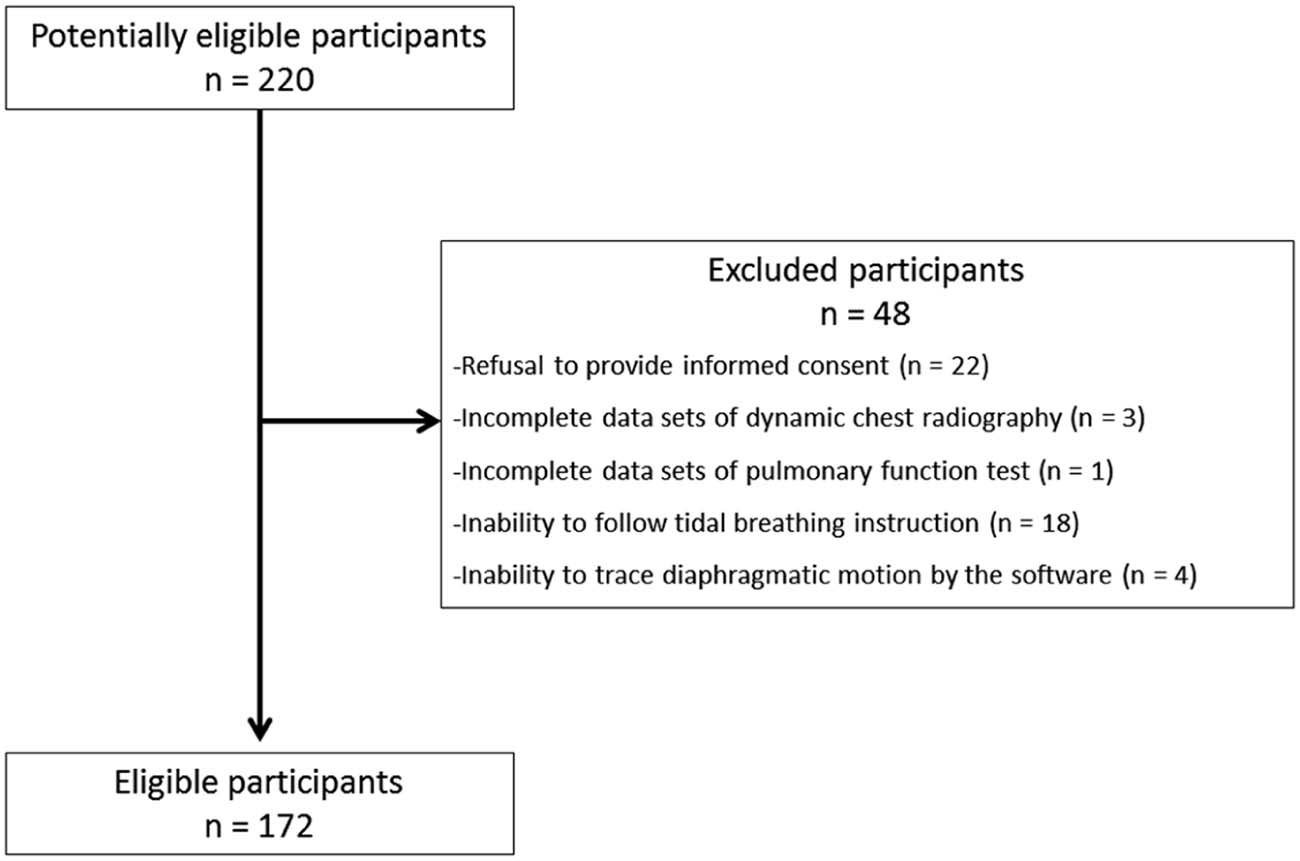
One hundred seventy-two subjects (103 men; aged 56.3 ± 9.8 years) underwent sequential chest radiographs during tidal breathing using dynamic chest radiography with a flat panel detector system. We evaluated the excursions of and peak motion speeds of the diaphragms. Associations between the excursions and participants’ demographics (gender, height, weight, body mass index [BMI], smoking history, tidal volume, vital capacity, and forced expiratory volume) were investigated.
Results
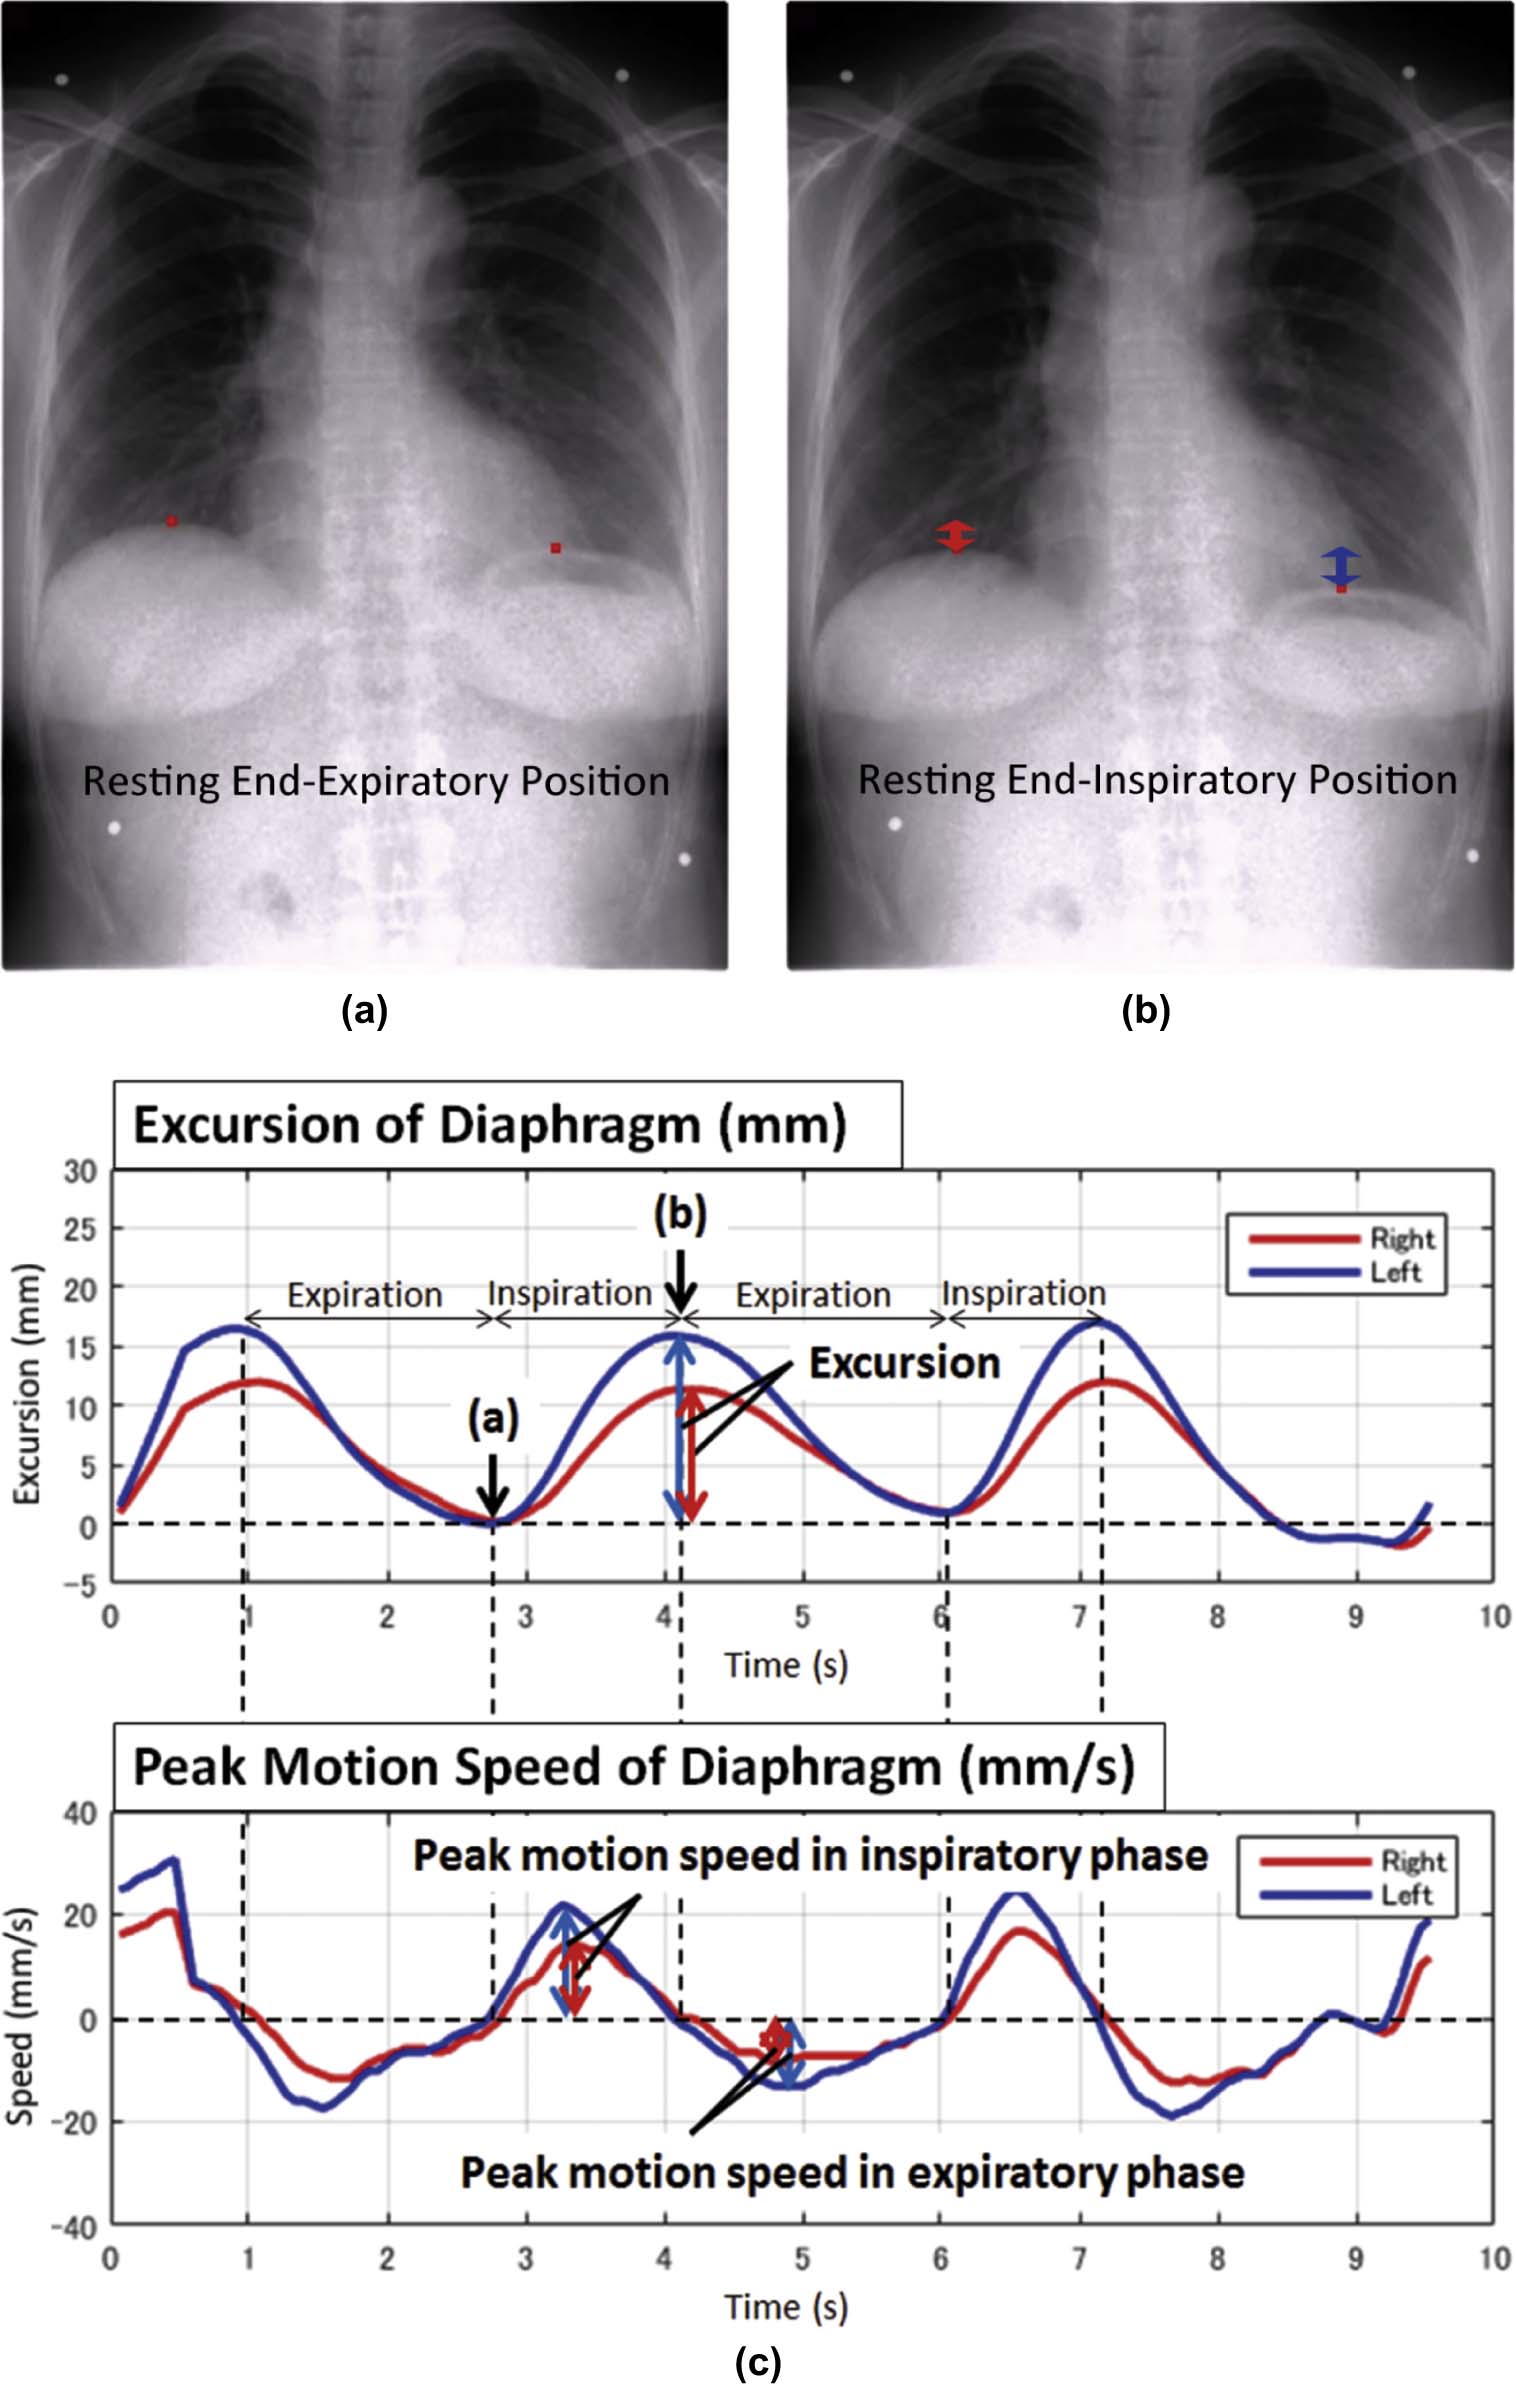
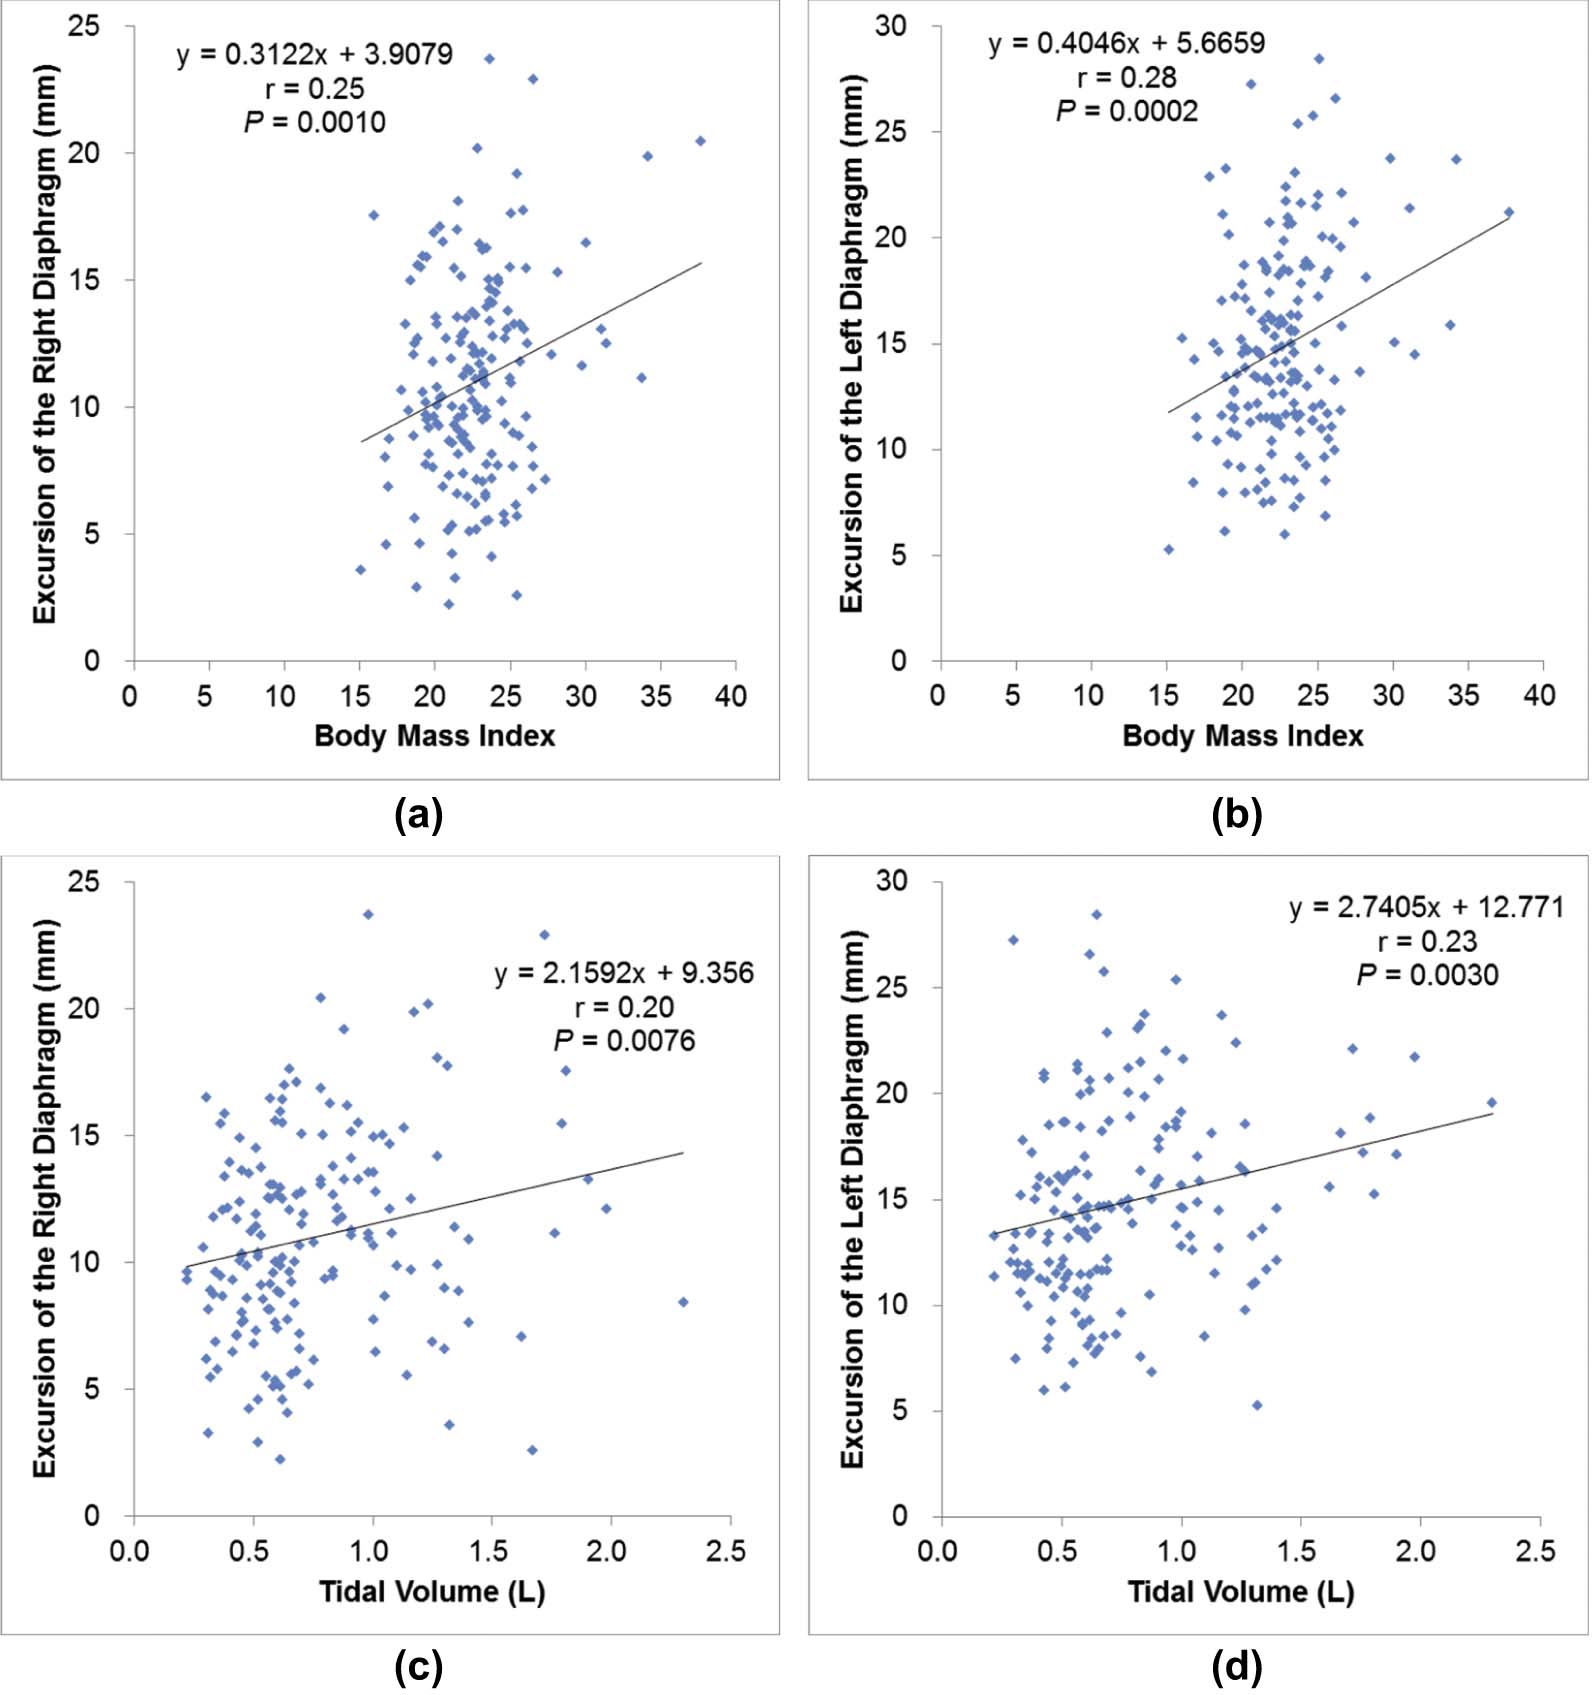
The average excursion of the left diaphragm (14.9 ± 4.6 mm, 95% CI 14.2–15.5 mm) was significantly larger than that of the right (11.0 ± 4.0 mm, 95% CI 10.4–11.6 mm) ( P < 0.001). The peak motion speed of the left diaphragm (inspiratory, 16.6 ± 4.2 mm/s; expiratory, 13.7 ± 4.2 mm/s) was significantly faster than that of the right (inspiratory, 12.4 ± 4.4 mm/s; expiratory, 9.4 ± 3.8 mm/s) (both P < 0.001). Both simple and multiple regression models demonstrated that higher BMI and higher tidal volume were associated with increased excursions of the bilateral diaphragm (all P < 0.05).
Conclusions
The average excursions of the diaphragms are 11.0 mm (right) and 14.9 mm (left) during tidal breathing in a standing position. The diaphragmatic motion of the left is significantly larger and faster than that of the right. Higher BMI and tidal volume are associated with increased excursions of the bilateral diaphragm.
Introduction
The bilateral diaphragm is the most important respiratory muscle. Diaphragmatic dysfunction is an underappreciated cause of respiratory difficulties and may be due to a wide variety of issues, including surgery, trauma, tumor, and infection . Several previous studies have evaluated diaphragmatic motion using fluoroscopy , ultrasound , magnetic resonance (MR) fluoroscopy (dynamic MR imaging [MRI]) , and computed tomography (CT) . However, the data of the previous studies using ultrasound, MR fluoroscopy, or CT were obtained in a supine position , not in a standing position. Also, while the data of the previous studies using fluoroscopy were obtained in a standing position, the data were assessed under forced breathing , not under tidal or resting breathing. Thus, diaphragmatic motion in a standing position during tidal breathing remains unclear, even though it is essential for understanding respiratory physiology in our daily life. Furthermore, the evaluation of diaphragmatic motion using fluoroscopy, ultrasound, dynamic MRI, or CT has not been used as a routine examination because of limitations, including high radiation dose, small field of view, low temporal resolution, and/or high cost.
Recently, dynamic chest radiography using a flat panel detector (FPD) system with a large field of view was introduced for clinical use. This technique can provide sequential chest radiographs with high temporal resolution during respiration , and the radiation dose is much lower than that of CT. Also, whereas CT and MRI are performed in the supine or prone position, dynamic chest radiology can be performed in a standing or sitting position, which is physiologically relevant. To the best of our knowledge, no detailed study has analyzed diaphragmatic motion during tidal breathing by using dynamic chest radiography.
Get Radiology Tree app to read full this article<
Materials and Methods
Study Population
Get Radiology Tree app to read full this article<
Get Radiology Tree app to read full this article<
Imaging Protocol of Dynamic Chest Radiology (“Dynamic X-Ray Phrenicography”)
Get Radiology Tree app to read full this article<
Image Analysis
Get Radiology Tree app to read full this article<
Get Radiology Tree app to read full this article<
Pulmonary Function Tests
Get Radiology Tree app to read full this article<
Statistical Analysis
Get Radiology Tree app to read full this article<
Results
Participants’ Characteristics
Get Radiology Tree app to read full this article<
TABLE 1
Demographic Characteristics of the Study Population (172 Volunteers)
Demographic Variables Value Mean ± SD or n (%) Range Age (years) 56.3 ± 9.8 36–85 Female/Male (n, %) 69 (40.1)/103 (59.9) — Height (cm) 163.7 ± 9.0 137.9–184.2 Weight (kg) 61.0 ± 12.0 28.8–111.8 BMI (kg/m 2 ) 22.7 ± 3.2 15.1–37.7 Smoking history Current or Former 58 (33.7) — Never 114 (66.3) — Pulmonary function test Tidal volume (L) 0.76 ± 0.38 0.22–2.30 VC (L) 3.42 ± 0.83 1.24–5.70 %VC 107.7 ± 15.3 58.7–159.6 FEV 1 (L) 2.70 ± 0.68 1.06–4.72 FEV 1 % 80.8 ± 6.4 57.3–97.3 %FEV 1 104.0 ± 14.9 55.1–163.9
BMI, body mass index; FEV, forced expiratory volume; SD, standard deviation; VC, vital capacity.
Range indicates the minimum–maximum.
Get Radiology Tree app to read full this article<
Excursions and Peak Motion Speeds of the Bilateral Diaphragm
Get Radiology Tree app to read full this article<
TABLE 2
Excursions and Peak Motion Speeds of the Bilateral Diaphragm During Tidal Breathing in a Standing Position ( n = 172)
Right Left Comparison Between Right and Left Mean ± SD (Range) Mean ± SD (Range)P Value \* Excursion of the diaphragm (mm) 11.0 ± 4.0 (2.2–23.7) 14.9 ± 4.6 (5.3–28.5) <0.001 Peak motion speed of the diaphragm (inspiratory phase) (mm/s) 12.4 ± 4.4 (3.6–28.0) 16.6 ± 4.2 (6.3–27.7) <0.001 Peak motion speed of the diaphragm (expiratory phase) (mm/s) 9.4 ± 3.8 (3.3–25.1) 13.7 ± 4.2 (5.1–26.2) <0.001
Get Radiology Tree app to read full this article<
Get Radiology Tree app to read full this article<
Univariate Analysis of Associations Between the Diaphragmatic Excursions and Participants’ Demographics
Get Radiology Tree app to read full this article<
TABLE 3
Univariate Analysis of Associations Between the Excursions and Participant Demographics ( n = 172)
Demographic Variables For Excursion of the Right Diaphragm For Excursion of the Left Diaphragm Continuous Variables_r_ (95% CI)P Value † r (95% CI)P Value † Age (years) −0.18(−0.32to−0.03) 0.017 \* −0.11(−0.26to0.04) 0.148 Height(cm) −0.02(−0.17to0.13) 0.752 0.10(−0.05to0.24) 0.203 Weight(kg) 0.13(−0.02to0.28) 0.084 0.22(0.07to0.36) 0.004 \* BMI 0.25(0.10to0.39) 0.001 \* 0.28(0.14to0.42) <0.001 \* Tidal volume 0.20(0.05to0.34) 0.008 \* 0.23(0.08to0.36) 0.003 \* VC 0.00(−0.15to0.15) 0.991 0.13(−0.02to0.28) 0.084 %VC 0.00(−0.15to0.15) 0.956 0.07(−0.08to0.22) 0.348 FEV 1 −0.02(−0.17to0.13) 0.807 0.12(−0.03to0.26) 0.132 FEV 1 % −0.03(−0.17to0.12) 0.738 −0.02(−0.17to0.13) 0.757 %FEV 1 −0.13(−0.28to0.02) 0.086 −0.02(−0.17to0.13) 0.820
Nominal Variables Difference(95% CI)P Value ‡ Difference(95% CI)P Value ‡ Gender −0.60(−1.84to0.64) 0.340 0.69(−0.73to2.11) 0.340 Smoking history −0.80(−2.08to0.48) 0.222 0.00(−1.47to1.47) 1.000
BMI, body mass index; CI, confidence interval; FEV, forced expiratory volume; VC, vital capacity.
Get Radiology Tree app to read full this article<
Get Radiology Tree app to read full this article<
Get Radiology Tree app to read full this article<
Get Radiology Tree app to read full this article<
Multivariate Analysis of Associations Between the Excursions and Participants’ Demographics
Get Radiology Tree app to read full this article<
TABLE 4
Multivariate Analysis of Associations Between the Excursions and Participant Demographics Using All Variables as Factors (Model 1) ( n = 172)
Variable For the Excursion of Right Diaphragm For the Excursion of Left Diaphragm Coefficient † SE_P_ Value ‡ Coefficient † SE_P_ Value ‡ Intercept −26.859 22.979 0.244 −36.777 26.818 0.172 Age −0.053 0.118 0.652 −0.016 0.138 0.906 Gender 0.540 1.250 0.666 0.584 1.459 0.690 Height 0.163 0.157 0.301 0.229 0.184 0.214 Weight −0.246 0.109 0.026 \* −0.308 0.128 0.017 \* BMI 0.949 0.302 0.002 \* 1.171 0.352 0.001 \* Tidal volume 2.124 0.809 0.010 \* 2.205 0.944 0.021 \* VC 2.588 3.625 0.476 2.356 4.231 0.578 %VC 0.014 0.106 0.899 −0.008 0.124 0.948 FEV 1 −3.257 4.675 0.487 −1.925 5.456 0.725 FEV 1 % 0.106 0.102 0.304 0.059 0.119 0.624 %FEV 1 −0.039 0.113 0.731 −0.011 0.132 0.937 Smoking history 0.372 0.348 0.286 0.193 0.406 0.636
BMI, body mass index; FEV, forced expiratory volume; SE, standard error; VC, vital capacity.
Multiple linear regression analysis using all variables as factors demonstrates that weight, BMI, and tidal volume are independently associated with the bilateral excursion of the diaphragms after adjusting for other clinical variables including age, gender, smoking history, height, VC, %VC, FEV 1 , FEV 1 %, and %FEV 1 .
Get Radiology Tree app to read full this article<
Get Radiology Tree app to read full this article<
Get Radiology Tree app to read full this article<
Get Radiology Tree app to read full this article<
Discussion
Get Radiology Tree app to read full this article<
Get Radiology Tree app to read full this article<
Get Radiology Tree app to read full this article<
Get Radiology Tree app to read full this article<
Get Radiology Tree app to read full this article<
Conclusions
Get Radiology Tree app to read full this article<
Acknowledgments
Get Radiology Tree app to read full this article<
Appendix
Supplementary Data
Get Radiology Tree app to read full this article<
Video S1
Get Radiology Tree app to read full this article<
Get Radiology Tree app to read full this article<
Get Radiology Tree app to read full this article<
Data S1
Get Radiology Tree app to read full this article<
Get Radiology Tree app to read full this article<
References
1. Nason L.K., Walker C.M., McNeeley M.F., et. al.: Imaging of the diaphragm: anatomy and function. Radiographics 2012; 32: pp. E51-E70.
2. Alexander C.: Diaphragm movements and the diagnosis of diaphragmatic paralysis. Clin Radiol 1966; 17: pp. 79-83.
3. Simon G., Bonnell J., Kazantzis G., et. al.: Some radiological observations on the range of movement of the diaphragm. Clin Radiol 1969; 20: pp. 231-233.
4. Verschakelen J.A., Deschepper K., Jiang T.X., et. al.: Diaphragmatic displacement measured by fluoroscopy and derived by Respitrace. J Appl Physiol 1989; 67: pp. 694-698.
5. Kleinman B.S., Frey K., VanDrunen M., et. al.: Motion of the diaphragm in patients with chronic obstructive pulmonary disease while spontaneously breathing versus during positive pressure breathing after anesthesia and neuromuscular blockade. Anesthesiology 2002; 97: pp. 298-305.
6. Houston J.G., Morris A.D., Howie C.A., et. al.: Technical report: quantitative assessment of diaphragmatic movement–a reproducible method using ultrasound. Clin Radiol 1992; 46: pp. 405-407.
7. Harris R.S., Giovannetti M., Kim B.K.: Normal ventilatory movement of the right hemidiaphragm studied by ultrasonography and pneumotachography. Radiology 1983; 146: pp. 141-144.
8. Gierada D.S., Curtin J.J., Erickson S.J., et. al.: Diaphragmatic motion: fast gradient-recalled-echo MR imaging in healthy subjects. Radiology 1995; 194: pp. 879-884.
9. Suga K., Tsukuda T., Awaya H., et. al.: Impaired respiratory mechanics in pulmonary emphysema: evaluation with dynamic breathing MRI. J Magn Reson Imaging 1999; 10: pp. 510-520.
10. Unal O., Arslan H., Uzun K., et. al.: Evaluation of diaphragmatic movement with MR fluoroscopy in chronic obstructive pulmonary disease. Clin Imaging 2000; 24: pp. 347-350.
11. Etlik O., Sakarya M.E., Uzun K., et. al.: Demonstrating the effect of theophylline treatment on diaphragmatic movement in chronic obstructive pulmonary disease patients by MR-fluoroscopy. Eur J Radiol 2004; 51: pp. 150-154.
12. Iwasawa T., Takahashi H., Ogura T., et. al.: Influence of the distribution of emphysema on diaphragmatic motion in patients with chronic obstructive pulmonary disease. Jpn J Radiol 2011; 29: pp. 256-264.
13. Shirakawa T., Fukuda K., Miyamoto Y., et. al.: Parietal pleural invasion of lung masses: evaluation with CT performed during deep inspiration and expiration. Radiology 1994; 192: pp. 809-811.
14. Pettiaux N., Cassart M., Paiva M., et. al.: Three-dimensional reconstruction of human diaphragm with the use of spiral computed tomography. J Appl Physiol 1997; 82: pp. 998-1002.
15. Pan T., Lee T.Y., Rietzel E., et. al.: 4D-CT imaging of a volume influenced by respiratory motion on multi-slice CT. Med Phys 2004; 31: pp. 333-340.
16. Low D.A., Nystrom M., Kalinin E., et. al.: A method for the reconstruction of four-dimensional synchronized CT scans acquired during free breathing. Med Phys 2003; 30: pp. 1254-1263.
17. Tanaka R., Sanada S., Okazaki N., et. al.: Evaluation of pulmonary function using breathing chest radiography with a dynamic flat panel detector: primary results in pulmonary diseases. Invest Radiol 2006; 41: pp. 735-745.
18. Prewitt J.M.: Object enhancement and extraction.Lipkin B.Rosenfeld A.Picture processing and psychopictorics.1970.AcademicNew York:pp. 75-149.
19. Wolffsohn J.S., Mukhopadhyay D., Rubinstein M.: Image enhancement of real-time television to benefit the visually impaired. Am J Ophthalmol 2007; 144: pp. 436-440.
20. Wanger J., Clausen J.L., Coates A., et. al.: Standardisation of the measurement of lung volumes. Eur Respir J 2005; 26: pp. 511-522.
21. Miller M.R., Hankinson J., Brusasco V., et. al.: Standardisation of spirometry. Eur Respir J 2005; 26: pp. 319-338.
22. IAEA : International basic safety standards for protection against ionizing radiation and for the safety of radiation sources. International Atomic Energy Agency Vienna, Safety Report Series No. 1151996.
23. Womack C.J., Hyman B.A., Gardner A.W.: Prediction of peak oxygen consumption in patients with intermittent claudication. Angiology 1998; 49: pp. 591-598.