
Objectives
To measure and compare the objective image quality of true noncontrast (TNC) images with virtual noncontrast (VNC) images acquired by tin-filter–enhanced, dual-source, dual-energy computed tomography (DECT) of upper abdomen.
Materials and Methods
Sixty-three patients received unenhanced abdominal CT and enhanced abdominal DECT (100/140 kV with tin filter) in portal-venous phase. VNC images were calculated from the DECT datasets using commercially available software. The mean attenuation of relevant tissues and image quality were compared between the TNC and VNC images. Image quality was rated objectively by measuring image noise and the sharpness of object edges using custom-designed software. Measurements were compared using Student two-tailed t -test. Correlation coefficients for tissue attenuation measurements between TNC and VNC were calculated and the relative deviations were illustrated using Bland-Altman plots.
Results
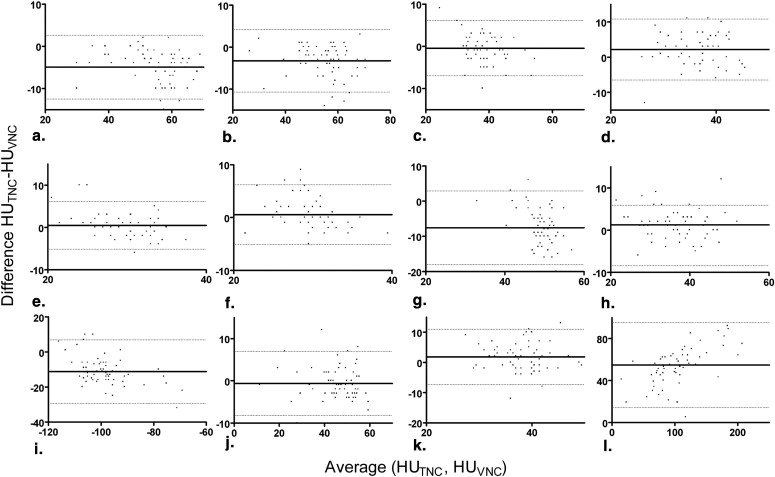
Mean attenuation differences between TNC and VNC (HU TNC − HU VNC ) image sets were as follows: right liver lobe −4.94 Hounsfield units (HU), left liver lobe −3.29 HU, vena cava −2.19 HU, spleen −7.46 HU, pancreas 1.29 HU, fat −11.14 HU, aorta 1.29 HU, bone marrow 36.83 HU (all P < .05); right kidney 0.46 HU, left kidney 0.56 HU, vena portae −0.48 HU and muscle −0.62 HU (nonsignificant). Good correlations between VNC and TNC series were observed for liver, vena portae, kidneys, pancreas, muscle and bone marrow (Pearson’s correlation coefficient ≥0.75). Mean image noise was significantly higher in TNC images ( P < .0001). Measurements of edge sharpness revealed no significant differences between VNC and TNC images ( P = .19).
Conclusion
The Hounsfield units in VNC images closely resemble TNC images in the majority of the organs of the upper abdomen (kidneys, liver, pancreas). In spleen and fat, Hounsfield numbers in VNC images are tend to be higher than in TNC images. VNC images show a low image noise and satisfactory edge sharpness. Other criteria of image quality and the depiction of certain lesions need to be evaluated additionally.
The idea of dual-energy computed tomography (DECT) has existed since the invention of CT . However, only recently CT technology has advanced far enough to enable dose-neutral DECT acquisitions . Material differentiation in DECT is based on the dependence of photo absorption on energy and atomic number. If CT data that were acquired with different energies are available, a differentiation of the effective atomic numbers of the scanned materials and thus a differentiation of materials with different atomic numbers is feasible . Besides other possible technical approaches, dual-source CT with its two x-ray tubes can supply two simultaneous CT acquisitions with different energy levels . The energetic difference between the two spectra can be enhanced using a tin filter . The filter leads to a sharpening of the high-energy spectrum and thus a higher mean energy level of this spectrum and more effective dual energy discrimination. Thus, it is possible to use of 100 kV instead of 80 kV to create the lower energy spectrum that leads to an improved image quality of the low-energy images especially in the abdomen . Several clinical applications of DECT have recently been investigated . Because of the high atomic number of iodine, the amount of iodine contributing to every voxel can be quantified in DECT datasets using a three-material decomposition algorithm . Thus, the iodine content can be subtracted from the contrast enhanced images, resulting in virtual noncontrast (VNC) images.
Nonenhanced scans can be of interest for the measurement of contrast uptake of lesions, for imaging metabolic changes of liver tissue, and for the detection of calcifications, hematoma, and hemorrhagic cysts. However, because the unenhanced scan is not necessary in many patients, many radiology centers tend to abstain from acquiring the additional images for reasons of dose reduction. Unfortunately, once contrast is administered, the acquisition of noncontrast image is no longer possible in a reasonable time interval, which can hamper the interpretation of incidental findings.
Get Radiology Tree app to read full this article<
Get Radiology Tree app to read full this article<
Materials and methods
Patient Population
Get Radiology Tree app to read full this article<
CT Scanning Protocol
Get Radiology Tree app to read full this article<
Image Reconstruction and Postprocessing
Get Radiology Tree app to read full this article<
Measurement of Hounsfield Numbers for TNC and VNC
Get Radiology Tree app to read full this article<
Table 1
Summary of Measurement Results
Organ HU TNC HU VNC HU TNC −HU VNC P Value Correlation Coefficient Right liver lobe52.84 ± 9.1857.78 ± 10.10−4.94 ± 3.86<.00010.92 ( P < .0001) Left liver lobe53.68 ± 9.0256.97 ± 9.55−3.29 ± 3.79<.00010.92 ( P < .0001) Vena portae 38.56 ± 5.18 39.03 ± 6.29 −0.48 ± 3.32 .2587 0.85 ( P < .0001) Vena cava38.03 ± 5.3835.84 ± 5.382.19 ± 4.42.00120.66 ( P < .0001) Right kidney 29.97 ± 3.32 29.51 ± 4.63 0.46 ± 2.88 .2091 0.79 ( P < .0001) Left kidney 30.03 ± 3.28 29.48 ± 4.40 0.56 ± 2.88 .1313 0.75 ( P < .0001) Spleen45.57 ± 3.5553.16 ± 5.58−7.46 ± 5.38<.00010.38 ( P = .0026) Pancreas37.76 ± 6.7936.48 ± 7.141.29 ± 3.67.00720.86 ( P < .0001) Fat−100.10 ± 27.96−88.95 ± 27.81−11.14 ± 9.26<.00010.94 ( P < .0001) ∗ Muscle 45.48 ± 10.03 46.10 ± 10.49 −0.62 ± 3.88 .21 0.93 ( P < .0001) Aorta39.02 ± 5.1637.17 ± 5.391.29 ± 3.67.00270.61 ( P < .0001) Bone marrow134.62 ± 61.5279.95 ± 46.5636.83 ± 46.31<.00010.96 ( P < .0001)
HU, Hounsfield unit; TNC, true noncontrast; VNC, virtual noncontrast.
P values refer to paired sample t -tests. Statistically significant differences are printed in bold face.
Get Radiology Tree app to read full this article<
Get Radiology Tree app to read full this article<
Objective Measurements of Image Quality
Get Radiology Tree app to read full this article<
Get Radiology Tree app to read full this article<
Get Radiology Tree app to read full this article<
Get Radiology Tree app to read full this article<
Get Radiology Tree app to read full this article<
Radiation Dose Evaluation
Get Radiology Tree app to read full this article<
Statistical Analysis
Get Radiology Tree app to read full this article<
Get Radiology Tree app to read full this article<
Results
Hounsfield Numbers
Get Radiology Tree app to read full this article<
Table 2
Comparison of the Differences in the CT Numbers of TNC and VNC Images (TNC-VNC) in Recently Published Studies
Organ Graser et al Altenbernd et al Zhang et al Toepker et al Barrett et al Own Data Average Year 2009 2010 2010 2011 2011 2012 DS scanner generation First First First Second Second Second Tube potentials (kVp) 140/80 140/80 140/80 140/100 140/100 140/100 Quality reference mAs 96/404 96/404 96/404 178/230 178/230 151/196 Mean CTDI vol Not given Not given 8.2 12.9 11.0 11.2 Number of patients 110 40 102 86 75 63 476 Right liver lobe −2.0 ( P = .09) −3.3 ( P = .000) 0.3 ( P = .856) −5.7 ( P < .001) −2.7 ( P < .001) −4.94 ( P < .0001) −2.7 Left liver lobe −3.29 ( P < .0001) Right kidney 0.8 ( P = .26) — — −0.1 ( P = .883) — 0.46 ( P = .2091) 0,4 Left kidney — — — 0.56 ( P = .1313) Spleen — — −0.5 ( P = .062) −6.3 ( P < .001) — −7.46 ( P < .0001) −4.3 Pancreas — — 2.9 ( P = .089) −2.4 ( P < .001) — 1.29 ( P = .0072) −1.0 Fat — −11.3 ( P = .000) −14.1 ( P < .001) −7 ( P < .001) — −11.14 ( P < .0001) −11.0 Muscle −1.6 ( P = .42) −1.4 ( P = .519) 0.5 ( P = .544) −2.8 ( P < .001) — −0.62 ( P = .21) −1.1 Aorta 0.9 ( P = .16) −0.3 ( P = .88) 6.0 ( P < .001) −2.6 ( P < .001) — 1.84 ( P = .0027) −0.6
CT, computed tomography; CTDI vol , volume CT dose index; DS, dual source; TNC, true noncontrast; VNC, virtual noncontrast.
Get Radiology Tree app to read full this article<
Objective Image Quality
Get Radiology Tree app to read full this article<

Get Radiology Tree app to read full this article<
Radiation Dose
Get Radiology Tree app to read full this article<
Get Radiology Tree app to read full this article<
Discussion
Get Radiology Tree app to read full this article<
Get Radiology Tree app to read full this article<
Get Radiology Tree app to read full this article<
Get Radiology Tree app to read full this article<
Get Radiology Tree app to read full this article<
Get Radiology Tree app to read full this article<
Get Radiology Tree app to read full this article<
Get Radiology Tree app to read full this article<
Limitations
Get Radiology Tree app to read full this article<
Conclusions
Get Radiology Tree app to read full this article<
Acknowledgments
Get Radiology Tree app to read full this article<
References
1. Hounsfield G.N.: Computerized transverse axial scanning (tomography). 1. Description of system. Br J Radiol 1973; 46: pp. 1016-1022.
2. Flohr T.G., McCollough C.H., Bruder H., et. al.: First performance evaluation of a dual-source CT (DSCT) system. Eur Radiol 2006; 16: pp. 256-268.
3. Johnson T.R., Krauss B., Sedlmair M., et. al.: Material differentiation by dual energy CT: initial experience. Eur Radiol 2007; 17: pp. 1510-1517.
4. Petersilka M., Bruder H., Krauss B., et. al.: Technical principles of dual source CT. Eur J Radiol 2008; 68: pp. 362-368.
5. Primak A.N., Ramirez Giraldo J.C., Liu X., et. al.: Improved dual-energy material discrimination for dual-source CT by means of additional spectral filtration. Med Phys 2009; 36: pp. 1359-1369.
6. Avrin D.E., Macovski A., Zatz L.E.: Clinical application of Compton and photo-electric reconstruction in computed tomography: preliminary results. Invest Radiol 1978; 13: pp. 217-222.
7. Thomas C., Krauss B., Ketelsen D., et. al.: Differentiation of urinary calculi with dual energy CT: effect of spectral shaping by high energy tin filtration. Invest Radiol 2010; 45: pp. 393-398.
8. Leschka S., Stolzmann P., Baumuller S., et. al.: Performance of dual-energy CT with tin filter technology for the discrimination of renal cysts and enhancing masses. Acad Radiol 2010; 17: pp. 526-534.
9. Stolzmann P, Leschka S, Scheffel H, et al. Characterization of urinary stones with dual-energy CT: improved differentiation using a tin filter. Invest Radiol; 45:1–6.
10. Karcaaltincaba M., Aktas A.: Dual-energy CT revisited with multidetector CT: review of principles and clinical applications. Diagn Interv Radiol 2011; 17: pp. 181-194.
11. Renard B., Remy-Jardin M., Santangelo T., et. al.: Dual-energy CT angiography of chronic thromboembolic disease: Can it help recognize links between the severity of pulmonary arterial obstruction and perfusion defects?. Eur J Radiol 2011; 79: pp. 467-472.
12. Scheffel H., Stolzmann P., Frauenfelder T., et. al.: Dual-energy contrast-enhanced computed tomography for the detection of urinary stone disease. Invest Radiol 2007; 42: pp. 823-829.
13. Uotani K., Watanabe Y., Higashi M., et. al.: Dual-energy CT head bone and hard plaque removal for quantification of calcified carotid stenosis: utility and comparison with digital subtraction angiography. Eur Radiol 2009; 19: pp. 2060-2065.
14. Watanabe Y., Uotani K., Nakazawa T., et. al.: Dual-energy direct bone removal CT angiography for evaluation of intracranial aneurysm or stenosis: comparison with conventional digital subtraction angiography. Eur Radiol 2009; 19: pp. 1019-1024.
15. Zhang L.J., Peng J., Wu S.Y., et. al.: Liver virtual non-enhanced CT with dual-source, dual-energy CT: a preliminary study. Eur Radiol 2010; 20: pp. 2257-2264.
16. Graser A., Johnson T.R., Chandarana H., et. al.: Dual energy CT: preliminary observations and potential clinical applications in the abdomen. Eur Radiol 2009; 19: pp. 13-23.
17. Graser A., Johnson T.R., Hecht E.M., et. al.: Dual-energy CT in patients suspected of having renal masses: can virtual nonenhanced images replace true nonenhanced images?. Radiology 2009; 252: pp. 433-440.
18. Altenbernd J., Heusner T.A., Ringelstein A., et. al.: Dual-energy-CT of hypervascular liver lesions in patients with HCC: investigation of image quality and sensitivity. Eur Radiol 2011; 21: pp. 738-743.
19. Barrett T., Bowden D.J., Shaida N., et. al.: Virtual unenhanced second generation dual-source CT of the liver: is it time to discard the conventional unenhanced phase?. Eur J Radiol 2012; 81: pp. 1438-1445.
20. De Cecco C.N., Buffa V., Fedeli S., et. al.: Dual energy CT (DECT) of the liver: conventional versus virtual unenhanced images. Eur Radiol 2010; 20: pp. 2870-2875.
21. Shaida N., Bowden D.J., Barrett T., et. al.: Acceptability of virtual unenhanced CT of the aorta as a replacement for the conventional unenhanced phase. Clin Radiol 2012; 67: pp. 461-467.
22. Toepker M., Moritz T., Krauss B., et. al.: Virtual non-contrast in second-generation, dual-energy computed tomography: reliability of attenuation values. Eur J Radiol 2012; 81: pp. e398-e405.
23. Christner J.A., Kofler J.M., McCollough C.H.: Estimating effective dose for CT using dose-length product compared with using organ doses: consequences of adopting International Commission on Radiological Protection publication 103 or dual-energy scanning. AJR Am J Roentgenol 2010; 194: pp. 881-889.
24. Thomas C., Heuschmid M., Schilling D., et. al.: Urinary calculi composed of uric acid, cystine, and mineral salts: differentiation with dual-energy CT at a radiation dose comparable to that of intravenous pyelography. Radiology 2010; 257: pp. 402-409.
25. Sommer W.H., Graser A., Becker C.R., et. al.: Image quality of virtual noncontrast images derived from dual-energy CT angiography after endovascular aneurysm repair. J Vasc Interv Radiol 2010; 21: pp. 315-321.
26. Chandarana H., Godoy M.C., Vlahos I., et. al.: Abdominal aorta: evaluation with dual-source dual-energy multidetector CT after endovascular repair of aneurysms–initial observations. Radiology 2008; 249: pp. 692-700.