
Rationale and Objectives
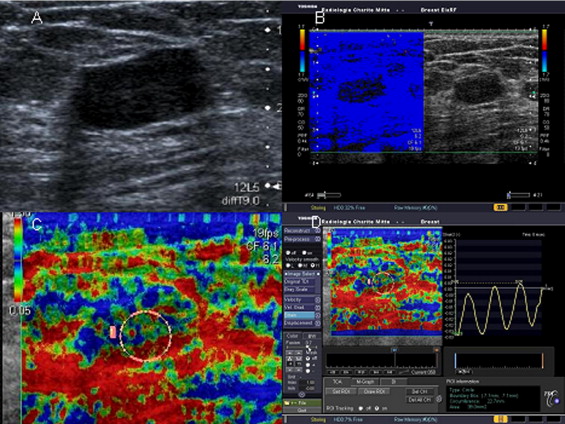
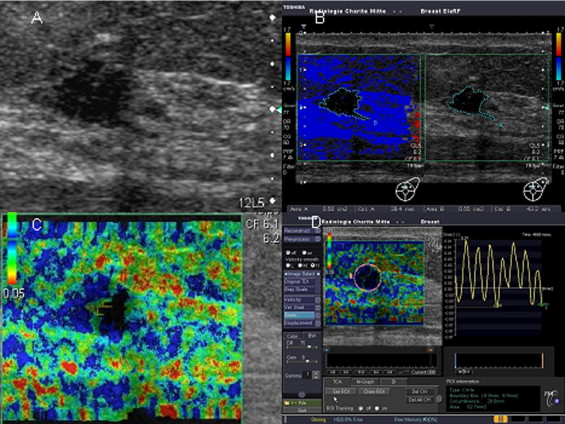
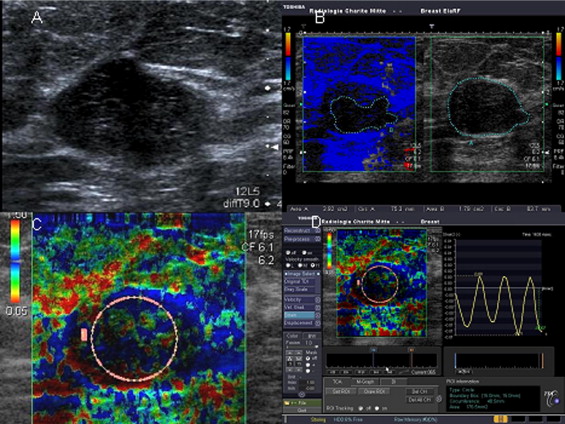
Sonoelastography depicts the intrinsic elastic properties of a tissue which are characterized by the strain applied to achieve tissue deformation and the velocity at which tissue deformation occurs. The present study served to investigate whether the specificity of B-mode ultrasound (US) can be improved by combining B-mode imaging with tissue Doppler imaging (TDI) and offline analysis of tissue strain imaging (TSI).
Materials and Methods
Fifty women, 25 with malignant and 25 with benign focal breast lesions, were examined by US with a linear transducer (9 MHz, Aplio, Toshiba, Otawara, Japan). B-mode US views of the lesions were overlaid with color-coded TDI information and area quotients (AQ = area B-mode view/area TDI) were calculated. TSI views were reconstructed offline from the source data. This was done by placing a region of interest (ROI) in the target lesion and color-encoded display of the information. In addition, tissue elasticity was evaluated using a scale of 1–5 corresponding to the BI-RADS categories. Maximum strain (strain factor, SF) was determined in the ROI. All patients also underwent mammography. Sensitivities and specificities were calculated and statistical analysis was performed using Wilcoxon’s test.
Results
Sensitivity/specificity was 96%/68% for B-mode US, 100%/40% for combined B-mode US and mammography, and 96%/80% for TSI. The AQ of benign and malignant lesions was significantly different (p = .00008) as was the difference in SF (p = .0004). The readers considered TSI a feasible technique.
Conclusion
Evaluation of elasticity based on the quantification of strain factors improves characterization of focal breast lesions, especially the differentiation of BI-RADS 3 and 4 lesions. Surprisingly, significant results in characterizing breast lesions were obtained with the simple technique of TDI, showing a lower tissue displacement in malignant cases.
The search for a diagnostic test that allows reliable differentiation of benign and malignant breast lesions for timely initiation of therapy continues to be a challenge as reflected in the wide range of different modalities that have been proposed. While there have been advances in the individual modalities, the final diagnosis often relies on a combination of mammography, ultrasound, and magnetic resonance imaging, and histological confirmation is obtained before surgery is performed ( ).
The visualization of the pathophysiological changes in tissue properties associated with tumor development was the basis for the development of elasticity measurements, which began in the 1980s ( ). All elastography techniques combine a form of mechanical excitation with measurement of the resulting tissue motion ( ). Reconstruction of the elastic deformability (strain imaging) in real time is known as sonoelastography ( ). The deflections before and after tissue compression are measured semiquantitatively using the shear modulus (Young’s modulus), calculated using a model, and then displayed graphically in the form of an elastogram.
Get Radiology Tree app to read full this article<
Get Radiology Tree app to read full this article<
Get Radiology Tree app to read full this article<
Methods
Get Radiology Tree app to read full this article<
Ultrasound Technique
Get Radiology Tree app to read full this article<
Get Radiology Tree app to read full this article<
Get Radiology Tree app to read full this article<
Get Radiology Tree app to read full this article<
Image Interpretation
Get Radiology Tree app to read full this article<
Get Radiology Tree app to read full this article<
Image Analysis
Get Radiology Tree app to read full this article<
Get Radiology Tree app to read full this article<
Get Radiology Tree app to read full this article<
Get Radiology Tree app to read full this article<
Get Radiology Tree app to read full this article<
AQ=AreaB-mode/AreaTDI AQ
=
Area
B-mode
/
Area
TDI
Get Radiology Tree app to read full this article<
Mammography
Get Radiology Tree app to read full this article<
Histology
Get Radiology Tree app to read full this article<
Statistics
Get Radiology Tree app to read full this article<
Results
Get Radiology Tree app to read full this article<
Table 1
Histological Diagnoses of Benign and Malignant Breast Lesions
Benign Lesions (n = 25) No. Malignant Lesions (n = 25) No. Fibroadenoma 11 Invasive ductal carcinoma 19 Papilloma 3 Invasive lobular carcinoma 5 Fibrosis 5 Ductal carcinoma in situ 1 Fibrocystic mastopathy 5 Phyllodes tumor 1
Get Radiology Tree app to read full this article<
Mammography
Get Radiology Tree app to read full this article<
B-Mode Ultrasound
Get Radiology Tree app to read full this article<
Get Radiology Tree app to read full this article<
Tissue Doppler Imaging
Get Radiology Tree app to read full this article<
Get Radiology Tree app to read full this article<
Get Radiology Tree app to read full this article<
Strain Imaging
Get Radiology Tree app to read full this article<
Get Radiology Tree app to read full this article<
Subjective Evaluation
Get Radiology Tree app to read full this article<
Get Radiology Tree app to read full this article<
Discussion
Get Radiology Tree app to read full this article<
Get Radiology Tree app to read full this article<
Get Radiology Tree app to read full this article<
Get Radiology Tree app to read full this article<
Get Radiology Tree app to read full this article<
Get Radiology Tree app to read full this article<
Get Radiology Tree app to read full this article<
Study Limitations
Get Radiology Tree app to read full this article<
Get Radiology Tree app to read full this article<
References
1. Geller B.M., Vacek P.M., Skelly J., et. al.: The use of additional imaging increased specificity and decreased sensitivity in screening mammography. J Clin Epidemiol 2005; 58: pp. 942-950.
2. Berg W.A., Gutierrez L., NessAiver M.S., et. al.: Diagnostic accuracy of mammography, clinical examination, US, and MR imaging in preoperative assessment of breast cancer. Radiology 2004; 233: pp. 830-849.
3. Kolb T.M., Lichy J., Newhouse J.H.: Comparison of the performance of screening mammography, physical examination, and breast US and evaluation of factors that influence them: An analysis of 27,825 patient evaluations. Radiology 2002; 225: pp. 165-175.
4. Ophir J., Garra B., Kallel F., et. al.: Elastographic imaging. Ultrasound Med Biol 2000; 26: pp. 23-29.
5. Bercoff J., Chaffai S., Tanter M., et. al.: In vivo breast tumor detection using transient elastography. Ultrasound Med Biol 2003; 10: pp. 1387-1396.
6. Hall J.T., Zhu Y., Spalding C.S.: In vivo real-time freehand palpation imaging. Ultrasound Med Biol 2003; 29: pp. 427-435.
7. Pesavento A., Lorenz A., Ermet H.: System for real-time elastography. Elect Lett 1999; 35: pp. 941-942.
8. Cespedes I., Ophir J., Ponnekanti H., Maklad N.: Elastography: Elasticity imaging using ultrasound with application to muscle and breast in vivo. Ultrason Imaging 1993; 15: pp. 73-88.
9. Hiltawsky K.M., Krüger M., Starke C., et. al.: Freehand ultrasound elastography of breast lesions: Clinical results. Ultrasound Med Biol 2001; 27: pp. 1461-1469.
10. Thomas A., Fischer T., Frey H., et. al.: An advanced method of ultrasound–real-time elastography: First results in 108 patients with breast lesions. Ultrasound Obstet Gynecol 2006; 28: pp. 335-340.
11. Thomas A., Kümmel S., Fritzsche F., et. al.: Real-time sonoelastography performed in addition to B-mode ultrasound and mammography: Improved differentiation of breast lesions?. Acad Radiol 2006; 13: pp. 1496-1504.
12. Itoh A., Ueno E., Tohno E., et. al.: Breast disease: Clinical application of US elastography for diagnosis. Radiology 2006; 239: pp. 341-350.
13. Frauscher F., Gradl J., Pallwein L.: Prostate ultrasound: For urologists only?. Cancer Imaging 2005; 23: pp. 76-82.
14. Varghese T., Shi H.: Elastographic imaging of thermal lesions in liver in-vivo using diaphragmatic stimuli. Ultrason Imaging 2004; 26: pp. 18-28.
15. Lyshchik A., Higashi T., Asato R., et. al.: Thyroid gland gland tumor diagnosis at US. Radiology 2005; 237: pp. 202-211.
16. Nikitin N.P., Witte K.K.: Application of tissue Doppler imaging in cardiology. Cardiology 2004; 101: pp. 170-184.
17. Hong A.S., Rosen E.L., Soo M.S., Baker J.A.: BI-RADS for sonography: Positive and negative values of sonographic features. AJR Am J Roentgenol 2005; 184: pp. 1260-1265.
18. American College of Radiology. Available at www.acr.org/s_acr/sec.asp?CID=25288DID=17573 . Accessed January 12, 2007.
19. Filly R.A.: Ultrasound: The stethoscope of the future, alas. Radiology 1988; 167: pp. 400.
20. Frey H.: Realtime-Elastographie. Radiologe 2003; 43: pp. 850-854.
21. Bilgen M., Srinivasan S., Lachman L.B., Ophir J.: Elastography imaging of small animal oncology models: A feasibility study. Ultrasound Med Biol 2003; 29: pp. 1291-1296.
22. Bercoff J., Chaffai S., Tanter M., et. al.: In vivo breast tumor detection using transient elastography. Ultrasound Med Biol 2003; 10: pp. 1387-1396.
23. Liu H.T., Suna L.Z.: Analytic modeling of breast elastography. Med Phys 2003; 30: pp. 2340-2349.
24. Ophir J., Céspedes I., Ponneanti H., et. al.: A quantitative method for imaging the elasticity of biological tissue. Ultrason Imaging 1991; 13: pp. 111-114.
25. Lorenzen J., Wedel A.K., Lisboa B.W., et. al.: Diagnostic mammography and sonography: Concordance of the breast imaging reporting assessments and final clinical outcome. Fortschr Röntgenstr 2005; 177: pp. 1545-1551.
26. Schulz-Wendtland R., Bock K., Aichinger U., et. al.: Ultrasound examination of the breast with 7.5 MHz and 13 MHz-transducers: Scope for improving diagnostic accuracy in complementary breast diagnostics?. Ultraschall Med 2005; 26: pp. 209-215.
27. Matsumura T, Tamano S, Shinomura R, et al. Preliminary evaluation of breast disease diagnosis based on real-time elasticity imaging. Proceedings of the Third International Conference on the Ultrasonic Measurement and Imaging of Tissue Elasticity at Lake Windermere, Cumbria, United Kingdom, 2004; October 17–20: 23.
28. Guiseppetti G.M., Martegani A., Di Cioccio, Baldassarre S.: Elastosonography in the diagnosis of the nodular breast lesions: A preliminary report. Radiol Med 2005; 110: pp. 69-76.
29. Shiina T, Yamakawa M, Itoh A, et al. Computer aided diagnosis of breast cancer based on elasticity images. Proceedings of the Fourth International Conference on the Ultrasonic Measurement and Imaging of Tissue Elasticity at Lake Travis, Texas, October 16–19, 2005: 74.
30. Ciatto S., Houssami N., Apruzzese A., et. al.: Categorizing breast mammographic density: Intra- and interobserver reproducibility of BI-RADS density categories. Breast 2005; 14: pp. 269-275.