
Rationale and Objectives
Spectroscopy signal of a breast lesion may be disrupted by the presence of metal from a biopsy marking clip. This study compares the size of magnetic resonance (MR) susceptibility artifacts and degree of local spectroscopy signal disturbance created by conventional titanium tissue marker clips to that of a novel carbon coated ceramic breast tissue marker clip.
Materials and Methods
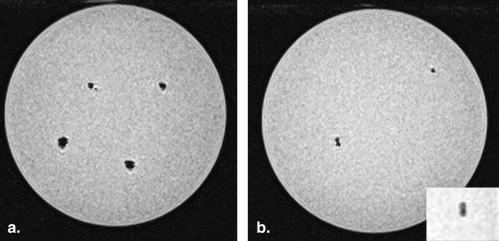
Five breast tissue marker clips were embedded in a gelatin breast phantom. The phantoms were imaged on a 3T MR scanner, and three-dimensional T1-weighted gradient echo images were obtained. The area of the susceptibility artifact was calculated and compared for each clip. Single voxel point resolved spectroscopy spectra (SVS) were acquired for three ceramic clips aligned along the superoinferior, anteroposterior, and left-right axes, respectively. Measurements were repeated for an area of pure gelatin and for one similarly sized titanium clip located arbitrarily in the main field. Water spectra were obtained, and line widths and areas of the water peaks were compared.
Results
All five clips were easily visible on MR imaging. The ceramic marker clip produced less apparent artifact when compared with the metallic clips. Spectral analysis demonstrated local frequency shifts around all clips. Line widths varied from 7 to 92 Hz in the voxels on and around the titanium clip and from 4to 18 Hz around the ceramic clips.
Conclusion
The ceramic breast tissue marker clip produced less susceptibility artifact and less line broadening on 3T MR imaging than conventional titanium clips. This tissue marker may reduce artifact and improve consistency of breast MR spectroscopy.
Breast magnetic resonance (MR) imaging is increasingly used to monitor response to neoadjuvant chemotherapy in patients with locally advanced disease . 1 H MR spectroscopy (MRS) has emerged as a potential adjunct to standard breast MR imaging for evaluation of tumor response. Malignant tissue contains high levels of total choline-containing compounds (tCho), and changes in tCho concentrations, detected by MRS, may be a sensitive predictor of tumor response .
To facilitate eventual wire localization and surgical excision of malignant tissue, a biopsy marking clip is placed in the tumor at the time of initial needle core biopsy. However, the presence of metal in the tissue can cause severe susceptibility artifacts within and around the region of interest. The most commonly used tissue marker clips are composed of pure titanium or titanium alloy, which can locally distort the B 0 field and give rise to spectral artifacts that complicate differentiation of tCho from surrounding peaks .
Get Radiology Tree app to read full this article<
Materials and methods
Get Radiology Tree app to read full this article<
Get Radiology Tree app to read full this article<
A=π*(shortaxis*longaxis)/4 A
=
π
*
(
short
axis
*
long
axis
)
/
4
Get Radiology Tree app to read full this article<
Get Radiology Tree app to read full this article<
Get Radiology Tree app to read full this article<
Get Radiology Tree app to read full this article<
Get Radiology Tree app to read full this article<
Table 1
Maximal Area of Susceptibility Artifact for Each Clip
Clip Area of Deployed Clip (mm 2 ) Area of Susceptibility
Artifact (mm 2 ) Ratio of Clip Area vs. Artifact Area A 9.4 145 15 B 6.3 110 18 C 3.1 44 14 D 4.7 77 16 E 6.3 64 10
Clip A, Tumark Professional, MPM Medical Supply; clip B, Securemark, Hologic Inc, Indianapolis, IN; clip C, CorMark Biopsy Site Marker, Ethicon Endo-surgery, Guaynabo, PR; clip D, UltraClip II Tissue Marker, Inrad, Kentwood, MI; clip E, ImarC, Sanarus Medical, Pleasanton, CA.
Get Radiology Tree app to read full this article<
Get Radiology Tree app to read full this article<
Get Radiology Tree app to read full this article<
Results
Get Radiology Tree app to read full this article<
Get Radiology Tree app to read full this article<
Table 2
SVS Signal Changes—Comparison of Local Signal Disturbance for Carbon (Clip E) vs. Similarly Sized Titanium Clip (Clip B)
Area Ratio
Clip/Pure Gelatin Area Ratio Adjacent to Clip/Pure Gelatin Line Width
Ranges (Hz) Pure gelatin 1.0 1.0 4 Clip E x-axis 0.95 0.99 5–10 Clip E y-axis 0.97 0.99 6–18 Clip E z-axis 0.93 0.96 4–5 Clip B 0.90 0.95 7–92
Clip B, Securemark, Hologic Inc, Indianapolis, IN; clip E, ImarC, Sanarus Medical, Pleasanton, CA.
Get Radiology Tree app to read full this article<
Get Radiology Tree app to read full this article<
Discussion
Get Radiology Tree app to read full this article<
Get Radiology Tree app to read full this article<
Get Radiology Tree app to read full this article<
Get Radiology Tree app to read full this article<
Get Radiology Tree app to read full this article<
Get Radiology Tree app to read full this article<
Get Radiology Tree app to read full this article<
Get Radiology Tree app to read full this article<
References
1. Saslow D., Boetes C., Burke W., et. al.: American Cancer Society guidelines for breast screening with MRI as adjunct to mammography. Cancer J Clin 2007; 57: pp. 75-89.
2. Manton D.J., Chaturvedi A., Hubbard A., et. al.: Neoadjuvant chemotherapy in breast cancer: early response prediction with quantitative MR imaging and spectroscopy. Br J Cancer 2006; 94: pp. 427-435.
3. Kvistad K.A., Bakken I.J., Gribberstad I.S., et. al.: Characterization of neoplastic and normal human breast tissues with in vivo 1 H spectroscopy: initial results. Radiology 2001; 220: pp. 40-46.
4. Jagannathan N.R., Kumar M., Seanu V., et. al.: Evaluation of total choline from in vivo volume localized proton MR spectroscopy to its response to neoadjuvant chemotherapy in locally advanced breast cancer. Br J Cancer 2001; 84: pp. 1016-1022.
5. Haddadin I.S., MacIntosh A., Meisamy S., et. al.: Metabolite quantification and high field MRS in breast cancer. NMR Biomed 2009; 22: pp. 65-76.
6. Matsuura H., Takashi I., Konno H., et. al.: Quantification of susceptibility artifacts produced on high field magnetic resonance images by various biomaterials used for neurosurgical implants. J Neurosurg 2002; 97: pp. 1472-1475.
7. Soher B.J., Young K., Govindaraju V., et. al.: Automated spectral analysis III: Application to in vivo proton MR spectroscopy and spectroscopic imaging. Magn Reson Med 1998; 40: pp. 822-831.
8. Genson C.C., Blane C.E., Helvie M.A., et. al.: Effects on breast MRI of artifacts caused by metallic tissue marker clips. AJR Am J Roentgenol 2007; 188: pp. 372-376.
9. Allkemper T., Schwindt W., Maintz D., et. al.: Sensitivity of T2-weighted FSE sequences towards physiologic iron depositions in normal brains at 1.5 and 3.0 T. Eur Radiol 2004; 14: pp. 1000-1004.
10. Graf H., Lauer U.A., Berger A., et. al.: RF artifacts caused by metallic implants or instruments which get more prominent at 3T: an in vitro study. Magn Reson Imaging 2005; 23: pp. 439-493.