
Purpose
To evaluate the agreement of bone mineral density (BMD) between lumbar (L) and individual thoracic (T) vertebrae and identify a standard thoracic spine level for BMD assessment in cardiac computed tomography (CT) images.
Materials and Methods
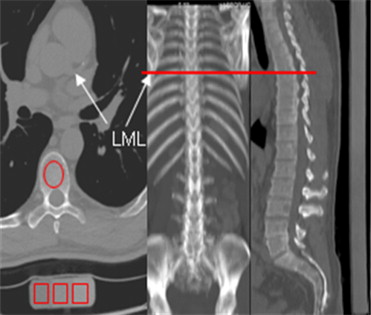
Three hundred subjects who underwent simultaneous chest and abdomen CT scans for clinical indications were included. A calibration phantom that extended from the first thoracic spine (T 1 ) to the fifth lumbar (L 5 ) was employed. Vertebral BMD were measured by QCT 5000 and NVivo systems. The association between three consecutive lumbar (L1–L3) and thoracic BMD (3T, initiation site equivalent to left main coronary caudally) was evaluated.
Results
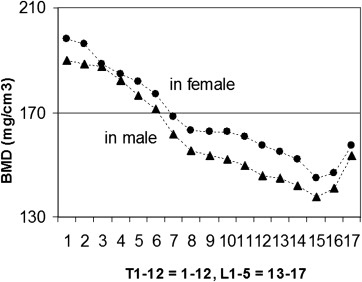
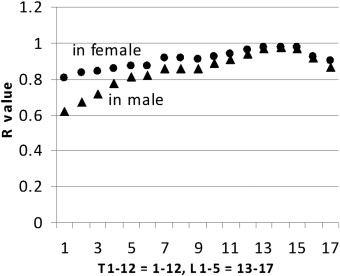
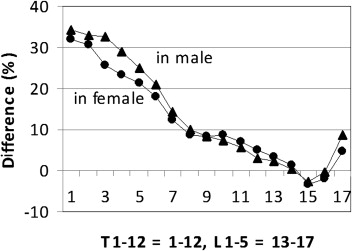
There was a gradual decrease in BMD values from T 1 to L 3, subsequently increasing in L 4 and L 5 in both genders. When stratified by gender, 3T BMD was significantly higher versus L 1-3 BMD (156.9 versus 141.9vmg/cm 3 , P < .001) for women as well as for men (164.8 versus 151.0 mg/cm 3 , P < .001). There is good correlation between 3T and L 1-3 BMD, the Pearson’s correlation coefficients are 0.91 and 0.93 for women and men, respectively. We further analyzed the associations between L 1-3 and any individual spine of T 1 –L 5 and similar relationships were observed ( r value, 0.62–0.98). The intraobserver, interobserver, and interscan variation measurement of thoracic quantitative CT was 2.5 (1.0, 95% CI 0.099–1.004); 2.6 (1.0, 95CI% 0.992–1.007), and 2.8% (1.0,95% 0.0994–1.008), respectively.
Conclusion
The 3T BMD was highly correlated with L 1-3 BMD. Thoracic BMD can be measured during cardiac and lung CT imaging without need for additional participant burden or radiation dose. This highly reproducible methodology is actively being applied to large cohort studies to evaluate the prevalence of osteoporosis and track BMD over time.
Osteoporosis and coronary atherosclerosis are increasingly being recognized as coexisting conditions in an aging population. Computed tomography (CT), as a powerful tool for atherosclerosis diagnosis, obstructive coronary artery disease (CAD) evaluation, and cardiac events detection has seen significant increased utilization over the past 20 years . Quantitative computed tomography (QCT) measured lumbar bone mineral density (BMD) is increasingly used for osteoporosis because of its ability to provide three-dimensional information compared to traditional dual x-ray absorptiometry two-dimensional images . Bone density evaluations have been performed with both phantoms and phantomless studies, and can be obtained whether contrast or noncontrast CT studies are obtained, by use of conversion factors .
Current 64-slice multidetector CT has been shown to be a feasible modality for providing improved cardiac imaging quality with decreased radiation doses (≤1 mSv) while simultaneously providing images of the thoracic spine. These studies provide the opportunity to study BMD during thoracic or cardiac imaging without additional radiation. If high correlation can be found in BMD measures between L 1-3 and thoracic spinal imaging, it will allow thoracic BMD to be a potential screening tool for osteoporosis during acquisitions of other scans at no additional burden (except measurement time) .
Materials and methods
Study Subjects
Get Radiology Tree app to read full this article<
Table 1
Demographic Data Profile of 300 Subjects with Whole Body Scan
Women ( n = 147) Men ( n = 153) Age, y 53 ± 8 57 ± 10 Height (cm) 162.9 ± 8.8 175.7 ± 9.1 Weight (kg) 66.4 ± 13.7 84.8 ± 16.4 Body mass index (kg/m 2 ) 25.0 ± 4.9 27.5 ± 4.9 Ethnicity Caucasian (%) 73 (49.7) 80 (52.3) Hispanic (%) 34 (23.1) 29 (19.0) African American (%) 11 (7.5) 13 (8.5) Asia (%) 24 (16.3) 19 (12.4) Other (%) 5 (3.4) 12 (7.8)
Get Radiology Tree app to read full this article<
Scan Technique
Thoracic and abdominal scanning
Get Radiology Tree app to read full this article<
CAC scanning
Get Radiology Tree app to read full this article<
Get Radiology Tree app to read full this article<
Measurement and Analysis
Get Radiology Tree app to read full this article<
Get Radiology Tree app to read full this article<
Table 2
BMD Value, R Value, and Difference between L 1∼3 and Individual Vertebrae
Sites T1 T4 T7 T10 T12 L3 L5 Women BMD (mg/cm 3 ) 198.1 184.8 168.4 162.8 157.3 145.0 157.1R value 0.81 0.85 0.91 0.92 0.96 0.98 0.90 Difference (%) 32.1 23.3 12.3 8.6 4.9 −3.3 4.8 Men BMD (mg/cm 3 ) 190.0 182.4 161.6 152.1 145.9 137.6 153.6R value 0.62 0.77 0.85 0.89 0.94 0.97 0.86 Difference (%) 34.3 28.9 14.2 7.5 3.1 −2.7 8.6
BMD, bone mineral density.
Get Radiology Tree app to read full this article<
Get Radiology Tree app to read full this article<
Table 3
Mean BMD Value of 3T and L 1∼3 in Women Stratified by Age Group
Age_n_ 3T L 1∼3 Difference_R_ 35–45 19 185.8 ± 38.8 177.4 ± 32.5 11.8 ± 11.1 0.94 45–55 64 172.9 ± 39.1 159.8 ± 37.8 15.0 ± 11.4 0.92 55–65 40 155.0 ± 25.5 140.5 ± 22.8 15.9 ± 13.3 0.87 65–75 21 139.9 ± 30.6 120.0 ± 32.4 20.1 ± 11.8 0.90 Sum 144 156.9 ± 32.9 141.9 ± 33.7 17.1 ± 12.1 0.91
BMD, bone mineral density.
Table 4
Mean BMD Value of 3T and L 1∼3 in Men Stratified by Age Group
Age_n_ 3T L 1∼3 Difference_R_ 35–45 23 169.5 ± 32.0 164.1 ± 34.9 10.1 ± 7.7 0.94 45–55 45 163.9 ± 36.7 149.5 ± 33.7 16.7 ± 11.6 0.94 55–65 47 152.5 ± 26.0 131.8 ± 26.2 21.0 ± 13.1 0.82 65–75 27 144.5 ± 32.5 129.5 ± 33.0 17.1 ± 12.2 0.93 Sum 142 164.8 ± 37.1 151.0 ± 36.7 15.6 ± 12.1 0.93
BMD, bone mineral density.
Get Radiology Tree app to read full this article<
Assessment of Variability
Get Radiology Tree app to read full this article<
Results
Get Radiology Tree app to read full this article<
Get Radiology Tree app to read full this article<
Get Radiology Tree app to read full this article<
Get Radiology Tree app to read full this article<
Get Radiology Tree app to read full this article<
Get Radiology Tree app to read full this article<
Get Radiology Tree app to read full this article<
Discussion
Get Radiology Tree app to read full this article<
Get Radiology Tree app to read full this article<
Get Radiology Tree app to read full this article<
Get Radiology Tree app to read full this article<
Get Radiology Tree app to read full this article<
Get Radiology Tree app to read full this article<
Get Radiology Tree app to read full this article<
Get Radiology Tree app to read full this article<
Acknowledgment
Get Radiology Tree app to read full this article<
Get Radiology Tree app to read full this article<
References
1. Budoff M.J., Achenbach S., Blumenthal R.S., et. al.: Assessment of coronary artery disease by cardiac computed tomography: a scientific statement from the American Heart Association Committee on Cardiovascular Imaging and Intervention, Council on Cardiovascular Radiology and Intervention, and Committee on Cardiac Imaging, Council on Clinical Cardiology. Circulation 2006; 114: pp. 1761-1791.
2. Cann C.E., Genant H.K.: Precise measurement of vertebral mineral content using computed tomography. J Comput Assist Tomogr 1980; 4: pp. 493-500.
3. Laval-Jeantet M., Laval-Jeantet A.M., Lamarque J.L., et. al.: [An experimental study to evaluate mineralization of vertebral bone by computerized tomography (author’s transl)]. J Radiol 1979; 60: pp. 87-93.
4. Damilakis J., Adams J.E., Guglielmi G., et. al.: Radiation exposure in X-ray-based imaging techniques used in osteoporosis. Eur Radiol 2010; 20: pp. 2707-2714.
5. Kalender W.A.: Effective dose values in bone mineral measurements by photon absorptiometry and computed tomography. Osteoporos Int 1992; 2: pp. 82-87.
6. Mueller D.K., Kutscherenko A., Bartel H., et. al.: Phantom-less QCT BMD system as screening tool for osteoporosis without additional radiation. Eur J Radiol 2010; 79: pp. 375-381.
7. Budoff M.J., Hamirani Y.S., Gao Y.L., et. al.: Measurement of thoracic bone mineral density with quantitative CT. Radiology 2010; 257: pp. 434-440.
8. Bauer J.S., Henning T.D., Müeller D., et. al.: Volumetric quantitative CT of the spine and hip derived from contrast-enhanced MDCT: conversion factors. AJR Am J Roentgenol 2007; 188: pp. 1294-1301.
9. Lenchik L., Shi R., Register T.C., et. al.: Measurement of trabecular bone mineral density in the thoracic spine using cardiac gated quantitative computed tomography. J Comput Assist Tomogr 2004; 28: pp. 134-139.
10. Wong M., Papa A., Lang T., et. al.: Validation of thoracic quantitative computed tomography as a method to measure bone mineral density. Calcif Tissue Int 2005; 76: pp. 7-10.
11. Lee C.I., Forman H.P.: What we can and cannot see coming. Radiology 2010; 257: pp. 313-314.
12. Grampp S., Jergas M., Lang P., et. al.: Quantitative CT assessment of the lumbar spine and radius in patients with osteoporosis. AJR Am J Roentgenol 1996; 167: pp. 133-140.
13. Riggs B.L., Melton L.J., Robb R.A., et. al.: A population-based assessment of rates of bone loss at multiple skeletal sites: evidence for substantial trabecular bone loss in young adult women and men. J Bone Miner Res 2008; 23: pp. 205-214.
14. Bouxsein M.L., Melton L.J., Riggs B.L., et. al.: Age- and sex-specific differences in the factor of risk for vertebral fracture: a population-based study using QCT. J Bone Miner Res 2006; 21: pp. 1475-1482.
15. Jergas M., Breitenseher M., Gluer C.C., et. al.: Estimates of volumetric bone density from projectional measurements improve the discriminatory capability of dual X-ray absorptiometry. J Bone Miner Res 1995; 10: pp. 1101-1110.
16. Reinbold W.D., Genant H.K., Reiser U.J., et. al.: Bone mineral content in early-postmenopausal and postmenopausal osteoporotic women: comparison of measurement methods. Radiology 1986; 160: pp. 469-478.
17. Steiger P., Block J.E., Steiger S., et. al.: Spinal bone mineral density measured with quantitative CT: effect of region of interest, vertebral level, and technique. Radiology 1990; 175: pp. 537-543.
18. Lang T.F., Li J., Harris S.T., et. al.: Assessment of vertebral bone mineral density using volumetric quantitative CT. J Comput Assist Tomogr 1999; 23: pp. 130-137.
19. Sabatier J.P., Guaydier-Souquieres G.: Noninvasive methods of bone-mass measurement. Clin Rheumatol 1989; 8: pp. 41-45.
20. Sigurdsson G., Aspelund T., Chang M., et. al.: Increasing sex difference in bone strength in old age: The Age, Gene/Environment Susceptibility-Reykjavik study (AGES-REYKJAVIK). Bone 2006; 39: pp. 644-651.
21. Cheng X.G., Yang D.Z., Zhou Q., et. al.: Age-related bone mineral density, bone loss rate, prevalence of osteoporosis, and reference database of women at multiple centers in China. J Clin Densitom 2007; 10: pp. 276-284.
22. Block J.E., Smith R., Glueer C.C., et. al.: Models of spinal trabecular bone loss as determined by quantitative computed tomography. J Bone Miner Res 1989; 4: pp. 249-257.
23. Gopal A., Mao S.S., Karlsberg D., et. al.: Radiation reduction with prospective ECG-triggering acquisition using 64-multidetector computed tomographic angiography. Int J Cardiovasc Imaging 2009; 25: pp. 405-416.