
Rationale and Objectives
To develop a method for processing and visualization of trabecular bone networks on the basis of magnetic resonance (MR) images acquired in the limited spatial resolution regime of in vivo imaging at which trabecular thickness is comparable to voxel size.
Materials and Methods
A sequence of processing steps for analyzing the topologic structure of trabecular bone networks is presented and evaluated using three types of datasets: images of synthetic structures with various levels of superimposed Gaussian noise, micro-computed tomographic images of human trabecular bone downsampled to in vivo resolution, and in vivo micro-MR images from a prior longitudinal study investigating the structural implications of testosterone treatment of hypogonadal men. The simulated images were analyzed at a voxel size of 150 μm 3 , the clinical MR image data had been acquired with 137 × 137 × 410 μm 3 voxel size. The technique is a modification to the virtual bone biopsy processing chain that involves a sinc convolution step immediately preceding binarization, and employs the Manzanera-Bernard thinning algorithm for obtaining the three-dimensional skeleton before topologic classification. The detectability of plate and rod bone elements was also analyzed theoretically.
Results
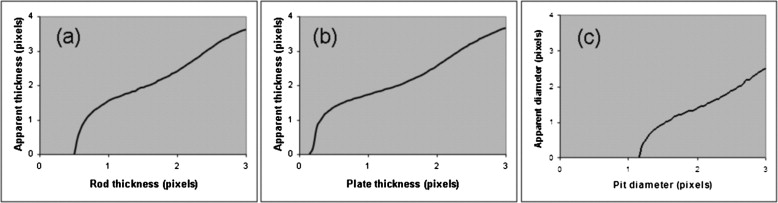
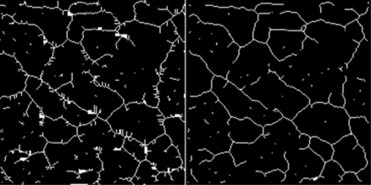
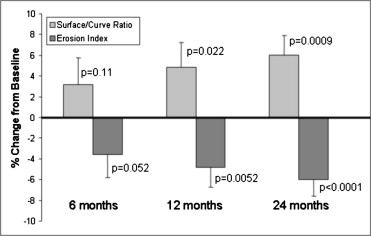
As compared with previously published techniques, the approach produced a more accurate bone skeleton in the micro-computed tomographic and simulation experiments, with clear improvement in preservation of rod and plate elements. Simulations suggest that rods are detectable down to a diameter of approximately 50% of the MR image voxel length, whereas plates can be detected at thicknesses of 20% or more of voxel length. For in vivo studies, it was shown that the method could recover the treatment response in terms of the ensuing topologic changes in patients undergoing antiresorptive treatment.
Conclusions
The algorithm for processing of in vivo micro-MR images of trabecular bone is superior to prior approaches in preserving the topology of the network in the presence of noise.
The recognition of the role of architecture as a determinant of bone strength, second in importance to density ( ), has given substantial impetus toward the development of image-based methods for quantification of the three-dimensional (3D) structure of trabecular bone. Because trabecular bone remodels several times faster than cortical bone, it also responds faster to hormonal changes, such as loss of estrogen after menopause ( ), or intervention with pharmacologic agents ( ) or cyclical loading ( ). Trabecular bone architecture is also altered in a characteristic manner in osteoarthritis ( ). A number of programs, including the proclamation of the National Bone and Joint Decade by the US government, have fostered the development of capabilities for in vivo assessment of trabecular bone architecture in recent years.
Both micro–computed tomography (μ-CT) and micro–magnetic resonance imaging (μ-MRI) have demonstrated their potential as modalities to provide quantitative information on the bone’s microarchitecture in specimen studies at a resolution of tens of micrometers or better ( ). In recent years, both modalities have evolved to the stage allowing in vivo imaging of the trabecular microarchitecture at peripheral skeletal locations such as the distal radius, tibia, or calcaneus at voxel sizes on the order of 80–200 μm ( ).
Get Radiology Tree app to read full this article<
Get Radiology Tree app to read full this article<
Get Radiology Tree app to read full this article<
Get Radiology Tree app to read full this article<
Materials and methods
Get Radiology Tree app to read full this article<
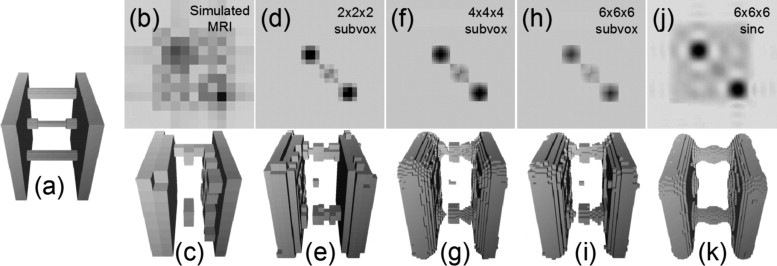
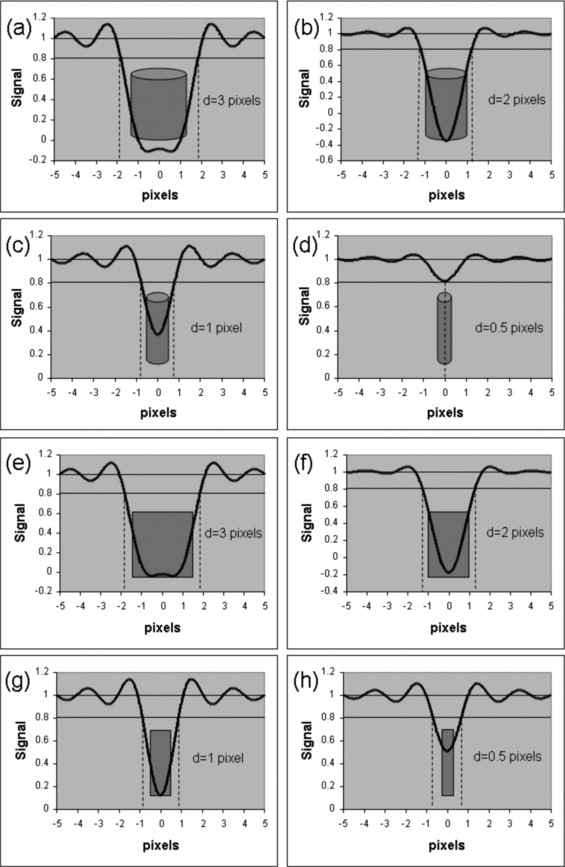
Partial Volume Effects and Sinc Interpolation
Get Radiology Tree app to read full this article<
Get Radiology Tree app to read full this article<
Get Radiology Tree app to read full this article<
Get Radiology Tree app to read full this article<
Get Radiology Tree app to read full this article<
Get Radiology Tree app to read full this article<
Virtual Bone Biopsy Processing Chain
Get Radiology Tree app to read full this article<
Synthetic Plate and Rod Simulations
Get Radiology Tree app to read full this article<
Get Radiology Tree app to read full this article<
MRI Simulations Based on High-Resolution μ-CT Data
Get Radiology Tree app to read full this article<
In Vivo Analysis
Get Radiology Tree app to read full this article<
Results
Get Radiology Tree app to read full this article<

Get Radiology Tree app to read full this article<
Get Radiology Tree app to read full this article<
Get Radiology Tree app to read full this article<
Get Radiology Tree app to read full this article<
Get Radiology Tree app to read full this article<

Get Radiology Tree app to read full this article<
Get Radiology Tree app to read full this article<
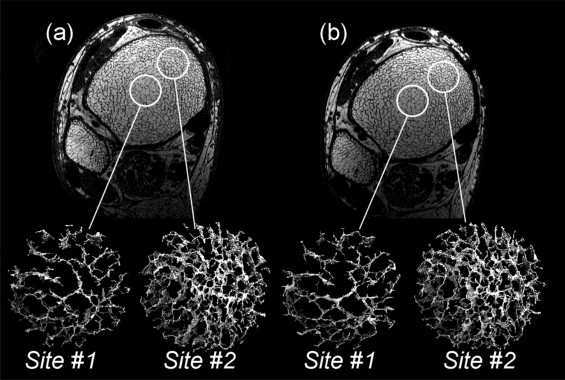
Table 1
Topologic Classification Parameters for Cores Shown in Fig 7 Demonstrating Reproducibility from Baseline to Follow-up
Site #1 Site #2 Baseline Follow-up Baseline Follow-up Skeleton density 1.71% 1.74% 2.99% 3.14% Plate density 1.48% 1.52% 2.62% 2.79% Rod density 0.19% 0.18% 0.28% 0.26% Junction density 0.04% 0.04% 0.09% 0.09%
Get Radiology Tree app to read full this article<
Get Radiology Tree app to read full this article<
Get Radiology Tree app to read full this article<
Discussion
Get Radiology Tree app to read full this article<
Get Radiology Tree app to read full this article<
Get Radiology Tree app to read full this article<
Get Radiology Tree app to read full this article<
Get Radiology Tree app to read full this article<
Get Radiology Tree app to read full this article<
Get Radiology Tree app to read full this article<
Get Radiology Tree app to read full this article<
Conclusions
Get Radiology Tree app to read full this article<
Get Radiology Tree app to read full this article<
Acknowledgment
Get Radiology Tree app to read full this article<
Get Radiology Tree app to read full this article<
References
1. Legrand E., Chappard D., Pascaretti C., et. al.: Trabecular bone microarchitecture, bone mineral density and vertebral fractures in male osteoporosis. J Bone Miner Res 2000; 15: pp. 13-19.
2. Kleerekoper M., Villanueva A.R., Stanciu J., et. al.: The role of three-dimensional trabecular microstructure in the pathogenesis of vertebral compression fractures. Calcified Tissue Int 1985; 37: pp. 594-597.
3. Recker R.R.: Architecture and vertebral fracture. Calcif Tissue Int 1993; 53: pp. S139-S142.
4. Genant H.K., Cann C.E., Ettinger B., et. al.: Quantitative computed tomography of vertebral spongiosa: a sensitive method for detecting early bone loss after oophorectomy. Ann Intern Med 1982; 97: pp. 699-705.
5. Black D.M., Greenspan S.L., Ensrud K.E., et. al.: The effects of parathyroid hormone and alendronate alone or in combination in postmenopausal osteoporosis. N Engl J Med 2003; 349: pp. 1207-1215.
6. Rubin C., Turner A.S., Muller R., et. al.: Quantity and quality of trabecular bone in the femur are enhanced by a strongly anabolic, noninvasive mechanical intervention. J Bone Miner Res 2002; 17: pp. 349-357.
7. Martel-Pelletier J., Lajeunesse D., Reboul P., et. al.: The role of subchondral bone in osteoarthritis.Sharma L.Beenbaum F.Osteoarthritis: a companion to rheumatology.2007.MosbyPhiladelphia:pp. 15-32.
8. Wehrli F.W., Ford J.C., Chung H.W., et. al.: Potential role of nuclear magnetic resonance for the evaluation of trabecular bone quality. Calcif Tissue Int 1993; 53: pp. S162-S169.
9. Rüegsegger P., Koller B., Muller R.: A microtomographic system for the nondestructive evaluation of bone architecture. Calcif Tissue Int 1996; 58: pp. 24-29.
10. Hildebrand T., Laib A., Muller R., et. al.: Direct three-dimensional morphometric analysis of human cancellous bone: microstructural data from spine, femur, iliac crest, and calcaneus. J Bone Miner Res 1999; 14: pp. 1167-1174.
11. Gordon C.L., Webber C.E., Adachi J.D., et. al.: In vivo assessment of trabecular bone structure at the distal radius from high-resolution computed tomography images. Phys Med Biol 1996; 41: pp. 495-508.
12. Gordon C.L., Webber C.E., Christoforou N., et. al.: In vivo assessment of trabecular bone structure at the distal radius from high-resolution magnetic resonance images. Med Phys 1997; 24: pp. 585-593.
13. Majumdar S., Genant H.K., Grampp S., et. al.: Correlation of trabecular bone structure with age, bone, mineral density, and osteoporotic status: in vivo studies in the distal radius using high-resolution magnetic resonance imaging. J Bone Mineral Res 1997; 12: pp. 111-118.
14. Song H.K., Wehrli F.W.: In vivo micro-imaging using alternating navigator echoes with applications to cancellous bone structural analysis. Magn Res Med 1999; 41: pp. 947-953.
15. Wehrli F.W., Saha P.K., Gomberg B.R., et. al.: Noninvasive assessment of bone architecture by magnetic resonance micro-imaging-based virtual bone biopsy. Proc IEEE 2003; 91: pp. 1520-1542.
16. Lin W., Ladinsky G.A., Wehrli F., Song H.K.: Image metric-based correction (autofocusing) of motion artifacts in high-resolution trabecular bone imaging. J Magn Reson Imaging 2007; 26: pp. 191-197.
17. Saha P., Wehrli F.: Measurement of trabecular bone thickness in the limited resolution regime of in vivo MRI by fuzzy distance transform. IEEE Trans Med Imaging 2004; 23: pp. 53-62.
18. Saha P.K., Gomberg B.R., Wehrli F.W.: Three-dimensional digital topological characterization of cancellous bone architecture. Int J Imaging Sys Technol 2000; 11: pp. 81-90.
19. Pothuaud L., Porion P., Lespessailles E., et. al.: A new method for three-dimensional skeleton graph analysis of porous media: application to trabecular bone microarchitecture. J Microsc 2000; 199: pp. 149-161.
20. Cowin S.C.: Wolff’s law of trabecular architecture at remodeling equilibrium. J Biomech Engineering 1986; 108: pp. 83-88.
21. Hildebrand T., Rüegsegger P.: Quantification of bone microarchitecture with the structure model index. Comp Methods Biomech Biomed Engineering 1997; 1: pp. 15-23.
22. Vasilic B., Wehrli F.W.: Semi-automated algorithm for segmentation of the trabecular-bone region in micro-MR images of the distal radius and tibia.Proc ISMRM 13th Annual Meeting.2005.ISMRMMiami, FL:pp. 1992.
23. Magland J.F., Vasilic B., Wehrli F.W.: Fully automated region of interest segmentation in the virtual bone biopsy.ISMRM 15th Annual Meeting.2007.ISMRMBerlin, Germany:pp. 2629.
24. Vasilic B., Popescu A.M., Bunker B., et. al.: Semi-automatic method for 3D registration of trabecular bone images in serial studies.ISMRM, 12th Scientific Meeting.2004.ISMRMKyoto, Japan:pp. 2209.
25. Magland J., Vasilic B., Lin W., et. al.: Automatic 3D registration of tabecular bone images using a collection of regional 2D registrations.ISMRM 14th Scientific Meeting.2006.ISMRMSeattle, WA:pp. 219.
26. Vasilic B., Wehrli F.W.: A novel local thresholding algorithm for trabecular bone volume fraction mapping in the limited spatial resolution regime of in-vivo MRI. IEEE Trans Med Imaging 2005; 24: pp. 1574-1585.
27. Hwang S.N., Wehrli F.W.: Estimating voxel volume fractions of trabecular bone on the basis of magnetic resonance images acquired in vivo. Int J Imaging Syst Technol 1999; 10: pp. 186-198.
28. Hwang S.N., Wehrli F.W.: Subvoxel processing: a method for reducing partial volume blurring with application to in vivo MR images of trabecular bone. Magn Res Med 2002; 47: pp. 948-957.
29. Wehrli F.W., Gomberg B.R., Saha P.K., et. al.: Digital topological analysis of in vivo magnetic resonance microimages of trabecular bone reveals structural implications of osteoporosis. J Bone Miner Res 2001; 16: pp. 1520-1531.
30. Benito M., Vasilic B., Wehrli F.W., et. al.: Effect of testosterone replacement on bone architecture in hypogonadal men. J Bone Miner Res 2005; 20: pp. 1785-1791.
31. Manzanera A., Bernard T.M., Preteux P., et. al.: N-dimensional skeletonization: a unified mathematical framework. J Electron Imaging 2002; 11: pp. 25-37.
32. Wehrli F.W.: Structural and functional assessment of trabecular and cortical bone by micro magnetic resonance imaging. J Magn Reson Imaging 2007; pp. 390-409.
33. Kramer D., Li A., Simovsky I., Hawryszko C., et. al.: Applications of voxel shifting in magnetic resonance imaging. Invest Radiol 1990; 25: pp. 1305-1310.
34. Du Y.P., Parker D.L., Davis W.L., et. al.: Reduction of partial-volume artifacts with zero-filled interpolation in three-dimensional MR angiography. J Magn Reson Imaging 1994; 4: pp. 733-741.
35. Hylton N.M., Simovsky I., Li A.J., et. al.: Impact of section doubling on MR angiography. Radiology 1992; 185: pp. 899-902.
36. Benito M., Gomberg B., Wehrli F.W., et. al.: Deterioration of trabecular architecture in hypogonadal men. J Clin Endocrinol Metab 2003; 88: pp. 1497-1502.
37. Ma J., Wehrli F.W., Song H.K.: Fast 3D large-angle spin-echo imaging (3D FLASE). Magn Reson Med 1996; 35: pp. 903-910.
38. Magland J., Jones C., Wald M., et. al.: Spin-echo micro-MRI of trabecular bone using an improved 3D FLASE sequence.Proc ISMRM, 15th Annual Meeting.2007.ISMRMBerlin, Germany:pp. 382.
39. Wehrli F.W., Ladinsky G.A., Jones C., et. al.: In vivo magnetic resonance detects rapid remodeling changes in the topology of the trabecular bone network after menopause and the protective effect of estradiol. J Bone Miner Res 2008; 23: pp. 730-740.
40. Borah B., Dufresne T.E., Chmielewski P.A., et. al.: Risedronate preserves bone architecture in postmenopausal women with osteoporosis as measured by three-dimensional microcomputed tomography. Bone 2004; 34: pp. 736-746.
41. Ito M., Ikeda K., Nishiguchi M., et. al.: Multi-detector row CT Imaging of vertebral microstructure for evaluation of fracture risk. J Bone Miner Res 2005; 20: pp. 1828-1836.
42. Ladinsky G.A., Vasilic B., Popescu A.M., et. al.: Trabecular structure quantified with the MRI-based virtual bone biopsy in postmenopausal women contributes to vertebral deformity burden independent of areal vertebral BMD. J Bone Miner Res 2008; 23: pp. 64-74.
43. Aaron J.E., Johnson D.R., Paxton S., et. al.: Secondary osteoporosis and the microanatomy of trabecular bone. Clin Rheumatol 1989; 8: pp. 84-88.
44. Parfitt A.M., Mathews C.H.E., Villanueva A.R., et. al.: Relationships between surface, volume, and thickness of iliac trabecular bone in aging and in osteoporosis. J Clin Invest 1983; 72: pp. 1396-1409.
45. Boutroy S., Bouxsein M.L., Munoz F., et. al.: In vivo assessment of trabecular bone microarchitecture by high-resolution peripheral quantitative computed tomography. J Clin Endocrinol Metab 2005; 90: pp. 6805-6815.