
Rationale and Objectives
This study aims to assess the impact of off-campus facility expansion by a large academic health system on patient travel times for screening mammography.
Materials and Methods
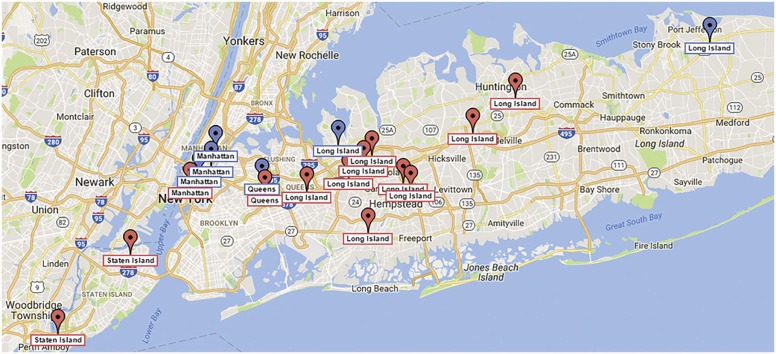
Screening mammograms performed from 2013 to 2015 and associated patient demographics were identified using the NYU Langone Medical Center Enterprise Data Warehouse. During this time, the system’s number of mammography facilities increased from 6 to 19, reflecting expansion beyond Manhattan throughout the New York metropolitan region. Geocoding software was used to estimate driving times from patients’ homes to imaging facilities.
Results
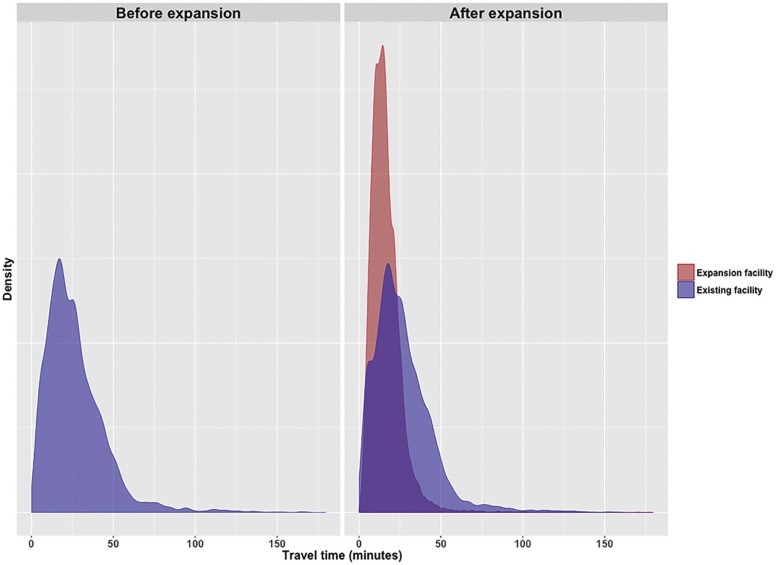
For 147,566 screening mammograms, the mean estimated patient travel time was 19.9 ± 15.2 minutes. With facility expansion, travel times declined significantly ( P < 0.001) from 26.8 ± 18.9 to 18.5 ± 13.3 minutes (non-Manhattan residents: from 31.4 ± 20.3 to 18.7 ± 13.6). This decline occurred consistently across subgroups of patient age, race, ethnicity, payer status, and rurality, leading to decreased variation in travel times between such subgroups. However, travel times to pre-expansion facilities remained stable (initial: 26.8 ± 18.9 minutes, final: 26.7 ± 18.6 minutes). Among women undergoing mammography before and after expansion, travel times were shorter for the postexpansion mammogram in only 6.3%, but this rate varied significantly (all P < 0.05) by certain demographic factors (higher in younger and non-Hispanic patients) and was as high as 18.2%–18.9% of patients residing in regions with the most active expansion.
Conclusions
Health system mammography facility geographic expansion can improve average patient travel burden and reduce travel time variation among sociodemographic populations. Nonetheless, existing patients strongly tend to return to established facilities despite potentially shorter travel time locations, suggesting strong site loyalty. Variation in travel times likely relates to various factors other than facility proximity.
Introduction
Screening mammography is associated with reduced breast cancer mortality in randomized controlled trials among women aged 40–74 years . Despite intense efforts by numerous stakeholders to promote breast cancer screening, screening rates in the United States remain suboptimal, ranging from 51.4% to 72.8% in one study . Reasons for inadequate screening have been the focus of extensive prior investigation and are complex and multifactorial . Nonetheless, screening rates vary by a range of patient-level factors, including race and ethnicity , education , income level , health-care insurance , and place of residence . Awareness of such variation has relevance for targeted interventions intended to improve screening compliance, particularly among vulnerable populations.
One factor potentially impacting screening mammography utilization that has received considerable attention is the time for patients to travel to an imaging facility . The perceived burden associated with such travel relates not only to the availability of mammography facilities within a given region but also to the expense and time required for travel , logistical barriers such as the need for a robust transportation system to travel greater differences , and psychosocial, cultural, or other personal characteristics influencing patients’ willingness to travel . Of note, the travel burden for screening mammography has the potential to more strongly impact certain vulnerable groups . Thus, the greater travel burden faced by some populations may contribute to and exacerbate previously noted disparities in screening compliance.
Get Radiology Tree app to read full this article<
Get Radiology Tree app to read full this article<
Materials and Methods
Get Radiology Tree app to read full this article<
Get Radiology Tree app to read full this article<
Get Radiology Tree app to read full this article<
Get Radiology Tree app to read full this article<
Get Radiology Tree app to read full this article<
Get Radiology Tree app to read full this article<
Results
Get Radiology Tree app to read full this article<
Table 1
Travel Times (Minutes) for Screening Mammography, Overall and Among Patient Subgroups and Time Periods
Cohort All Periods January–June 2013 July–December 2013 January–June 2014 July–December 2014 January–June 2015 July–December 2015n 147,566 7.225 12,300 16,235 26,242 29,370 56,194 All subjects 19.9 ± 15.2 26.8 ± 18.9 23.6 ± 18.1 21.0 ± 16.4 19.6 ± 15.2 19.0 ± 14.5 18.5 ± 13.3 Age (y) ≤39 20.9 ± 14.8 27.7 ± 18.1 25.0 ± 17.5 22.6 ± 15.2 20.5 ± 14.7 19.5 ± 13.2 18.8 ± 13.1 40–49 20.5 ± 14.8 27.2 ± 18.6 24.3 ± 17.6 22.2 ± 16.6 19.9 ± 14.5 19.4 ± 13.8 18.9 ± 12.7 50–59 20.1 ± 15.1 27.1 ± 18.0 24.0 ± 17.8 20.9 ± 15.6 19.9 ± 15.3 19.1 ± 14.6 18.8 ± 13.7 60–69 20.0 ± 16.1 27.3 ± 20.2 24.0 ± 19.5 21.0 ± 18.0 19.8 ± 16.3 19.2 ± 15.7 18.5 ± 13.8 70–79 18.6 ± 14.7 25.7 ± 20.9 21.3 ± 17.6 19.3 ± 15.8 18.2 ± 14.6 18.0 ± 14.4 17.6 ± 12.9 ≥80 17.0 ± 12.4 21.2 ± 14.1 19.0 ± 15.7 17.5 ± 12.5 16.7 ± 13.0 16.3 ± 11.9 16.2 ± 11.1Differential 6.5 6.0 5.1 3.8 3.2 2.7 Race Asian 23.0 ± 15.5 29.4 ± 17.4 26.4 ± 16.2 24.8 ± 16.0 22.5 ± 14.2 21.8 ± 14.9 20.1 ± 14.6 African American 24.7 ± 16.6 34.5 ± 16.9 29.3 ± 18.6 27.3 ± 17.0 25.3 ± 18.2 23.9 ± 15.1 21.7 ± 14.9 White 20.6 ± 16.3 28.0 ± 20.4 25.5 ± 20.1 22.9 ± 18.5 20.0 ± 16.0 19.8 ± 16.0 18.8 ± 13.7 Other/unknown 17.5 ± 12.5 21.9 ± 15.6 19.0 ± 14.0 17.5 ± 12.8 17.3 ± 12.8 16.7 ± 11.6 17.1 ± 11.9Differential 12.6 10.3 9.8 8 7.2 4.6 Ethnicity Hispanic 24.7 ± 16.5 30.0 ± 19.2 23.2 ± 15.3 25.9 ± 17.3 24.2 ± 16.0 23.8 ± 16.5 23.7 ± 15.3 Non-Hispanic 27.0 ± 19.4 29.5 ± 20.0 27.6 ± 20.0 27.1 ± 19.9 26.9 ± 18.9 26.1 ± 19.2 25.6 ± 18.5 Other/unknown 17.1 ± 12.2 18.2 ± 11.9 18.0 ± 13.9 17.6 ± 13.1 16.7 ± 12.5 16.9 ± 12.0 17.2 ± 11.7Differential 11.8 9.6 9.5 10.2 9.2 8.4 Payer status Self-pay 21.4 ± 16.5 23.9 ± 13.1 20.9 ± 11.5 17.7 ± 10.3 19.4 ± 13.3 24.6 ± 23.1 20.8 ± 13.9 Medicare 19.6 ± 16.3 25.2 ± 20.5 22.0 ± 18.6 20.4 ± 17.9 19.5 ± 16.9 19.0 ± 16.3 18.4 ± 14.3 Medicaid 15.6 ± 12.0 17.9 ± 13.3 19.4 ± 17.0 16.2 ± 15.0 16.6 ± 13.7 14.0 ± 8.8 14.9 ± 9.4 Private insurance 19.5 ± 14.9 27.1 ± 18.9 24.5 ± 18.9 21.3 ± 16.3 18.7 ± 14.2 18.9 ± 14.3 18.2 ± 13.4 Managed care 20.2 ± 14.9 27.2 ± 18.4 23.8 ± 17.8 21.1 ± 16.1 20.1 ± 15.3 19.0 ± 14.0 18.6 ± 13.0 Other/unknown 21.3 ± 19.8 38.7 ± 44.7 24.1 ± 28.2 22.3 ± 14.2 20.2 ± 14.7 21.3 ± 21.8 19.6 ± 17.1Differential 20.8 5.1 6.1 3.6 10.6 5.9 Rurality of residence Urban 18.0 ± 10.8 23.9 ± 13.2 20.8 ± 12.6 18.8 ± 11.7 17.6 ± 10.8 17.2 ± 10.4 17.0 ± 9.5 Rural 39.3 ± 31.0 44.4 ± 32.8 47.2 ± 33.4 46.9 ± 32.3 46.7 ± 31.5 41.0 ± 30.6 31.6 ± 27.8 Other/unknown 22.7 ± 20.6 36.6 ± 35.6 17.8 ± 11.9 27.0 ± 28.0 21.7 ± 15.4 21.6 ± 20.0 21.0 ± 17.0Differential 20.5 29.4 28.1 29.1 23.8 14.6 Place of residence Manhattan 15.9 ± 08.0 16.2 ± 8.2 16.0 ± 7.6 15.6 ± 8.2 15.7 ± 7.6 15.7 ± 8.3 16.3 ± 8.0 Other 20.5 ± 15.8 31.4 ± 20.3 25.9 ± 19.7 22.2 ± 17.4 20.2 ± 16.0 19.4 ± 15.1 18.7 ± 13.6Differential 15.2 9.9 6.6 4.5 3.7 2.4 Performing facility Pre-expansion site 26.5 ± 18.7 26.8 ± 18.9 26.6 ± 19.1 26.3 ± 18.8 26.7 ± 18.3 26.2 ± 18.3 26.7 ± 18.6 Expansion site 16.0 ± 10.9 - 15.8 ± 12.3 15.3 ± 10.6 15.3 ± 11.0 15.6 ± 10.7 16.5 ± 10.8Differential - 10.8 11.0 11.4 10.6 10.2
Get Radiology Tree app to read full this article<
Get Radiology Tree app to read full this article<
Get Radiology Tree app to read full this article<
Get Radiology Tree app to read full this article<
Table 2
Percent of Patients Undergoing a Screening Mammogram at a Manhattan Facility During the First Study Period Who Switched to a Closer Facility for a Screening Mammogram During the Final Study Period Following the Medical System’s Geographic Expansion Into the Greater Metropolitan Area, Stratified by Patient Characteristics
Cohort Percent Switching to a Closer Facility (%) All 6.3 Age (y) ≤39 23.8 40–49 7.6 50–59 4.2 60–69 6.5 70–79 5.8 ≥80 0.0 Race Asian 7.4 African American 3.0 White 6.5 Other/unknown 6.8 Ethnicity Hispanic 3.6 Non-Hispanic 6.2 Other/unknown 16.7 Payer status Self-pay 0.0 Medicare 5.4 Medicaid \* Private insurance 5.8 Managed care 6.7 Other/unknown \* Patient residence Urban 6.8 Rural 3.1 Other/unknown 0.0
Get Radiology Tree app to read full this article<
Table 3
Percent of Patients Undergoing a Screening Mammogram at a Manhattan Facility During the First Study Period Who Switched to a Closer Facility for a Screening Mammogram During the Final Study Period Following the Medical System’s Geographic Expansion into the Greater Metropolitan Area, Stratified by the Patients’ Place of Residence
Place of Residence Number of Mammography Facilities Rate of Patients Switching to a Closer Facility (%) First Period Final Period Manhattan 3 4 4.7 Brooklyn 0 0 7.1 Bronx 0 0 2.6 Queens 1 2 9.1 Staten Island 0 2 18.2 Long Island 2 11 18.9 Westchester and Rockland counties 0 0 0.0 New Jersey 0 0 3.9 Other 0 0 4.2
Get Radiology Tree app to read full this article<
Discussion
Get Radiology Tree app to read full this article<
Get Radiology Tree app to read full this article<
Get Radiology Tree app to read full this article<
Get Radiology Tree app to read full this article<
Get Radiology Tree app to read full this article<
Get Radiology Tree app to read full this article<
Get Radiology Tree app to read full this article<
Get Radiology Tree app to read full this article<
References
1. Humphrey L.L., Helfand M., Chan B.K., et. al.: Breast cancer screening: a summary of the evidence for the U.S. Preventive Services Task Force. Ann Intern Med 2002; 137: pp. 347-360.
2. DeSantis C., Siegel R., Bandi P., et. al.: Breast cancer statistics, 2011. CA Cancer J Clin 2011; 61: pp. 409-418.
3. Schueler K.M., Chu P.W., Smith-Bindman R.: Factors associated with mammography utilization: a systematic quantitative review of the literature. J Womens Health (Larchmt) 2008; 17: pp. 1477-1498.
4. Alexandraki I., Mooradian A.D.: Barriers related to mammography use for breast cancer screening among minority women. J Natl Med Assoc 2010; 102: pp. 206-218.
5. Jones A.R., Caplan L.S., Davis M.K.: Racial/ethnic differences in the self-reported use of screening mammography. J Community Health 2003; 28: pp. 303-316.
6. Breen N., Wagener D.K., Brown M.L., et. al.: Progress in cancer screening over a decade: results of cancer screening from the 1987, 1992, and 1998 National Health Interview Surveys. J Natl Cancer Inst 2001; 93: pp. 1704-1713.
7. McLafferty S., Wang F.: Rural reversal? Rural-urban disparities in late-stage cancer risk in Illinois. Cancer 2009; 115: pp. 2755-2764.
8. Onega T., Lee C.I., Benkeser D., et. al.: Travel burden to breast MRI and utilization: are risk and sociodemographics related?. J Am Coll Radiol 2016; 13: pp. 611-619.
9. Onega T., Hubbard R., Hill D., et. al.: Geographic access to breast imaging for US women. J Am Coll Radiol 2014; 11: pp. 874-882.
10. Onega T., Cook A., Kirlin B., et. al.: The influence of travel time on breast cancer characteristics, receipt of primary therapy, and surveillance mammography. Breast Cancer Res Treat 2011; 129: pp. 269-275.
11. Henry K.A., Boscoe F.P., Johnson C.J., et. al.: Breast cancer stage at diagnosis: is travel time important?. J Community Health 2011; 36: pp. 933-942.
12. Celaya M.O., Berke E.M., Onega T.L., et. al.: Breast cancer stage at diagnosis and geographic access to mammography screening (New Hampshire, 1998–2004). Rural Remote Health 2010; 10: pp. 1361.
13. Alford-Teaster J., Lange J.M., Hubbard R.A., et. al.: Is the closest facility the one actually used? An assessment of travel time estimation based on mammography facilities. Int J Health Geogr 2016; 15: pp. 8.
14. Wang F., Luo L., McLafferty S.: Healthcare access, socioeconomic factors and late-stage cancer diagnosis: an exploratory spatial analysis and public policy implication. Int J Public Pol 2010; 5: pp. 237-258.
15. United States Census Bureau : County classification lookup table. Available at: http://www2.census.gov/geo/docs/reference/ua/County_Rural_Lookup.xlsx Accessed December 11, 2016
16. Fleishon H.B., Itri J.N., Boland G.W., et. al.: Academic medical centers and community hospitals integration: trends and strategies. J Am Coll Radiol 2017; 14: pp. 45-51.
17. Onitilo A.A., Liang H., Stankowski R.V., et. al.: Geographical and seasonal barriers to mammography services and breast cancer stage at diagnosis. Rural Remote Health 2014; 14: pp. 2738.
18. National Institutes of Health : National Cancer Institute. NCI-Designated Cancer Centers; Available at: https://www.cancer.gov/research/nci-role/cancer-centers Accessed December 21, 2016
19. Ellenbogen P.H.: Imaging 3.0: what is it?. J Am Coll Radiol 2013; 10: pp. 229.
20. Onega T., Duell E.J., Shi X., et. al.: Geographic access to cancer care in the U.S. Cancer 2008; 112: pp. 909-918.
21. Berke E.M., Shi X.: Computing travel time when the exact address is unknown: a comparison of point and polygon ZIP code approximation methods. Int J Health Geogr 2009; 8: pp. 23.
22. Elkin E.B., Ishill N.M., Snow J.G., et. al.: Geographic access and the use of screening mammography. Med Care 2010; 48: pp. 349-356.
23. Peipins L.A., Miller J., Richards T.B., et. al.: Characteristics of US counties with no mammography capacity. J Community Health 2012; 37: pp. 1239-1248.
24. Kempe K.L., Larson R.S., Shetterley S., et. al.: Breast cancer screening in an insured population: whom are we missing?. Perm J 2013; 17: pp. 38-44.
25. Huang B., Dignan M., Han D., et. al.: Does distance matter? Distance to mammography facilities and stage at diagnosis of breast cancer in Kentucky. J Rural Health 2009; 25: pp. 366-371.
26. Lian M., Struthers J., Schootman M.: Comparing GIS-based measures in access to mammography and their validity in predicting neighborhood risk of late-stage breast cancer. PLoS ONE 2012; 7: e43000