
Rationale and Objectives
Fluoroscopy-guided lumbar puncture (FGLP) is an operator-dependent procedure that can contribute to lifetime cumulative radiation dose. Benchmark fluoroscopic times (FTs) have been published for ranges of body mass index (BMI), but trends in FT in FGLPs performed by neuroradiology trainees during their training have not been studied. The purpose of this study was to investigate the trends in FTs in FGLPs performed by neuroradiology fellows in an academic year.
Materials and Methods
We retrospectively reviewed FGLPs performed at our institution from July 2013 to June 2015 and determined the FT average and standard deviation of residents and non-neuroradiology fellows, neuroradiology fellows, and neuroradiology attendings. We used the Kruskal-Wallis test to evaluate group differences in FT in operator groups and academic quarters and by patient age, BMI, and needle length. Linear and Poisson regression analyses were performed to directly examine the relationship between the number of FGLPs performed and FTs.
Results
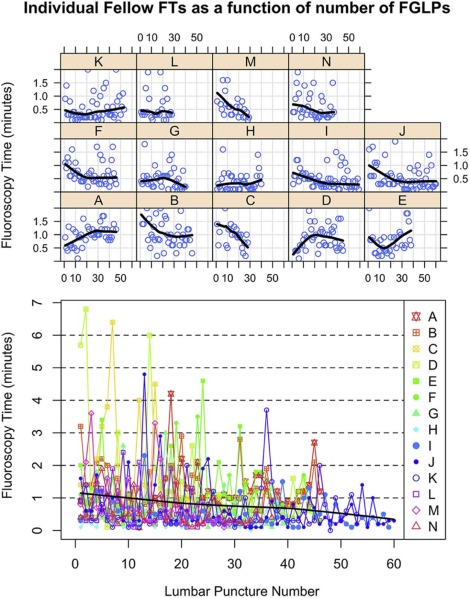
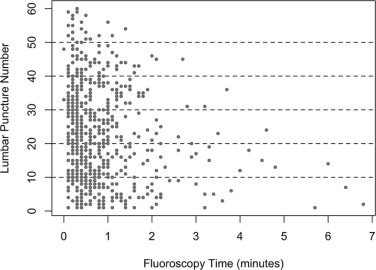
A total of 776 patients had successful FGLPs; 594 cases (77%) were performed by neuroradiology fellows ( n = 14). The average FT and variance for neuroradiology fellows significantly decreased over the year ( P = 0.004 and P < 0.001) with an estimated decrease of 0.01 minute of FT per FGLP. BMI, long needle length, and age ≥65 years old significantly affected the average FT ( P = 0.03, P < 0.001, and P < 0.001) and FT decreased in all of these subgroups in the academic year.
Conclusions
FT in FGLP cases performed by neuroradiology fellows decreases during the year. Our data can be utilized by radiology training programs and practices as a benchmark to monitor individual operator FT.
Introduction
Lumbar puncture (LP) is typically performed using anatomic landmarks ; however, in some patients these methods are unsuccessful and image guidance is required, perhaps due to large body habitus or significant lumbar spondylosis. Fluoroscopy-guided lumbar puncture (FGLP) is an effective alternative to bedside LP as it can visualize the bony structures and guide the operator to accurately place the needle in the spinal canal in real time .
The main disadvantage of FGLP is the use of ionizing radiation. Medical ionizing radiation exposure has increased in the general population over the years and has led to major improvements in the diagnosis and treatment of human diseases . Although these benefits are clear, their inappropriate use can lead to unnecessary or unintended radiation doses, potentially increasing the long-term risk of cancer that may be influenced by cumulative radiation exposure. Diagnostic fluoroscopic studies are typically low-exposure techniques ; however, FGLPs are operator dependent and do contribute to lifetime cumulative dose, such that the American College of Radiology recommends monitoring of fluoroscopic time (FT, an indirect marker for radiation dose) and comparison to benchmark figures .
Get Radiology Tree app to read full this article<
Materials and Methods
Institutional Review Board Approval and HIPAA (Health Insurance Portability and Accountability Act) Compliant
Get Radiology Tree app to read full this article<
Patient Population
Get Radiology Tree app to read full this article<
Grouping of FGLP Cases by Months and Dates, BMI, Age, and Needle Length for Neuroradiology Fellows
Chronological Categorization of FT
Get Radiology Tree app to read full this article<
BMI, Age, and Needle Length
Get Radiology Tree app to read full this article<
Grouping of FGLP Cases by Quarters of the Year and Year of Training for Diagnostic Radiology Residents
Get Radiology Tree app to read full this article<
Procedure Technique
Get Radiology Tree app to read full this article<
Instruction and Training of FGLP
Get Radiology Tree app to read full this article<
Get Radiology Tree app to read full this article<
Get Radiology Tree app to read full this article<
Data Collection
Get Radiology Tree app to read full this article<
Data Analysis
Get Radiology Tree app to read full this article<
Results
Patient Population, Indication for LP, and FGLP Approach
Get Radiology Tree app to read full this article<
TABLE 1
Average Age and BMI of Patients Who Underwent FGLP Over Two Academic Years (July 1, 2013–June 30, 2015) with FT
Level Total Number of Cases (Percent of Total) Mean Cases or Number of Persons ± SD (Range) Mean Age (y) ± SD Mean BMI ± SD Mean FT (min) ± SD § Neuroradiology fellows ( n = 14) 594(77) 42.4 ± 10.4(28–60) 47.5 ± 18.9 \* 29.6 ± 7.3 \* 0.84 ± 0.86 Attendings ( n = 12) 63(8) 5.25 ± 5.66(1–21) 48.3 ± 19.9 29.4 ± 8.9 † 0.49 ± 0.47 Residents and non-neuroradiology fellows ( n = 33) 119(15) 3.6 ± 2.5(1–9) 45.5 ± 17.1 29.4 ± 7.6 ‡ 0.75 ± 0.52
BMI, body mass index; FGLP, fluoroscopy-guided lumbar puncture; FT, fluoroscopic time; SD, standard deviation.
Total FGLP cases performed = 776.
The following information was not available:
Get Radiology Tree app to read full this article<
Get Radiology Tree app to read full this article<
Get Radiology Tree app to read full this article<
Get Radiology Tree app to read full this article<
Get Radiology Tree app to read full this article<
Get Radiology Tree app to read full this article<
FT for FGLP Cases Performed by All Operators (Attendings, Residents, and Fellows) During Two Academic Years
Get Radiology Tree app to read full this article<
FT for FGLP Cases Performed by Neuroradiology Fellows
Get Radiology Tree app to read full this article<
Get Radiology Tree app to read full this article<
Get Radiology Tree app to read full this article<
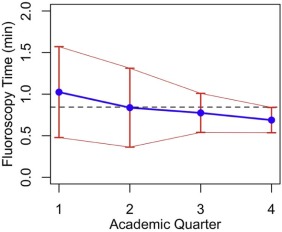
TABLE 2
Aggregated FGLP Cases for Neuroradiology Fellows Over Two Academic Years (July 2013–June 2014 and July 2014–June 2015) Categorized by Quarters of the Year, N = 594
Quarter of the Year Total Number of Cases Mean FT (min) and SD \* Age (Mean and SD) BMI (Mean and SD) 1 (July–September) 182 1.02 ± 1.05 50.6 ± 20 29.4 ± 6.5 2 (October–December) 149 0.84 ± 0.97 45.3 ± 17.6 29.7 ± 6.6 3 (January–March) 124 0.77 ± 0.69 46.1 ± 18 30.7 ± 8.5 4 (April–June) 139 0.69 ± 0.55 46.9 ± 19.3 28.9 ± 7.5 Total of 8 quarters (July 2013–June 2015) 594 0.84 ± 0.86 47.5 ± 18.9 29.6 ± 7.3
BMI, body mass index; FGLP, fluoroscopy-guided lumbar puncture; FT, fluoroscopic time; SD, standard deviation.
Get Radiology Tree app to read full this article<
Get Radiology Tree app to read full this article<
FT and BMI in FGLP Cases by Neuroradiology Fellows
Get Radiology Tree app to read full this article<
TABLE 3
Combined FGLP Cases by Neuroradiology Fellows Performed Over Two Academic Years (July 2013–June 2014 and July 2014–June 2015) Categorized by Quarters of the Year and by BMI
Quarter of the Year Normal (BMI 18.5–24.9) FT (min) ± SD Overweight (BMI 25–29.9) FT (min) ± SD Obese (BMI 30–39.9) FT (min) ± SD Extremely Obese (BMI > 40) FT (min) ± SD 1 (July–September) 0.74 ± 0.78( n = 49) 1.30 ± 1.29( n = 47) 0.96 ± 0.84( n = 63) 1.64 ± 1.8( n = 9) 2 (October–December) 0.57 ± 0.46( n = 29) 0.81 ± 1.14( n = 43) 0.89 ± 0.91( n = 50) 1.19 ± 1.3( n = 9) 3(January–March) 0.79 ± 0.72( n = 37) 0.67 ± 0.47( n = 28) 0.75 ± 0.78( n = 40) 1.0 ± 0.69( n = 16) 4(April–June) 0.55 ± 0.43( n = 39) 0.70 ± 0.50( n = 42) 0.86 ± 0.67( n = 46) 0.55 ± 0.43( n = 12) Total of 8 quarters (July 2013–June 2015) 0.67 ± 0.64( n = 154) 0.90 ± 1.0( n = 160) 0.87 ± 0.81( n = 199) 1.05 ± 1.1( n = 46) Boddu et al. FGLP FT average benchmarks 0.48 0.61 0.63 0.86
BMI, body mass index; FGLP, fluoroscopy-guided lumbar puncture; FT, fluoroscopic time; SD, standard deviation.
Benchmark FT based on BMI from a prior study is provided for comparison. Underweight patients(BMI < 18.5), average FT = 0.54 ± 0.96 ( n = 12); underweight average FT from Boddu et al.’s study was 0.77.
Get Radiology Tree app to read full this article<
FT in Patients ≥65 Years Old Undergoing FGLP Cases by Neuroradiology Fellows
Get Radiology Tree app to read full this article<
TABLE 4
Combined FGLP Cases on Patients ≥65 Years Old (A) and Patients Requiring a 5-Inch-Long Needle (B) Performed by Neuroradiology Fellows Over Two Academic Years (July 2013–June 2014 and July 2014–June 2015) and Categorized by Quarters of the Year
Quarter of the Year Average FT and SD \* A 1 (July–September) 1.36 ± 1.38( n = 61) 2 (October–December) 1.34 ± 1.47( n = 25) 3 (January–March) 0.79 ± 0.86( n = 28) 4 (April–June) 0.86 ± 0.62( n = 40) Total of 8 quarters (July 2013–June 2015) 1.12 ± 1.17( n = 154)
B 1 (July–September) 1.2 ± 0.97( n = 12) 2 (October–December) 1.62 ± 1.41( n = 19) 3 (January–March) 1.15 ± 1.15( n = 13) 4 (April–June) 0.81 ± 0.55( n = 19) Total of 8 quarters (July 2013–June 2015) 1.2 ± 1.10( n = 63)
BMI, body mass index; FGLP, fluoroscopy-guided lumbar puncture; FT, fluoroscopic time; SD, standard deviation.
Get Radiology Tree app to read full this article<
Get Radiology Tree app to read full this article<
FT in Patients Who Required a 5-Inch Needle for FGLP Cases Performed by Neuroradiology Fellows
Get Radiology Tree app to read full this article<
Discussion
Get Radiology Tree app to read full this article<
Get Radiology Tree app to read full this article<
Get Radiology Tree app to read full this article<
Get Radiology Tree app to read full this article<
Get Radiology Tree app to read full this article<
Get Radiology Tree app to read full this article<
Get Radiology Tree app to read full this article<
Get Radiology Tree app to read full this article<
Get Radiology Tree app to read full this article<
Conclusion
Get Radiology Tree app to read full this article<
References
1. Boon J.M., Abrahams P.H., Meiring J.H., et. al.: Lumbar puncture: anatomical review of a clinical skill. Clin Anat 2004; 17: pp. 544-553.
2. Cauley K.A.: Fluoroscopically guided lumbar puncture. AJR Am J Roentgenol 2015; 205: pp. W442-W450.
3. Ron E.: Cancer risks from medical radiation. Health Phys 2003; 85: pp. 47-59.
4. Mahesh M.: Fluoroscopy: patient radiation exposure issues. Radiographics 2001; 21: pp. 1033-1045.
5. Amis E.S., Butler P.F., Applegate K.E., et. al.: American College of Radiology white paper on radiation dose in medicine. J Am Coll Radiol 2007; 4: pp. 272-284.
6. Amis E.S., Butler P.F.: American College of Radiology: ACR white paper on radiation dose in medicine—three years later. J Am Coll Radiol 2010; 7: pp. 865-870.
7. Boddu S.R., Corey A., Peterson R., et. al.: Fluoroscopic-guided lumbar puncture: fluoroscopic time and implications of body mass index: a baseline study. AJNR Am J Neuroradiol 2014; 35: pp. 1475-1480.
8. Brook A.D., Burns J., Dauer E., et. al.: Comparison of CT and fluoroscopic guidance for lumbar puncture in an obese population with prior failed unguided attempt. J Neurointerv Surg 2014; 6: pp. 324-328.
9. Faulkner A.R., Bourgeois A.C., Bradley Y.C., et. al.: Simulation-based educational curriculum for fluoroscopically guided lumbar puncture improves operator confidence and reduces patient dose. Acad Radiol 2015; 22: pp. 668-673.
10. The Joint Commission : Sentinel Event Alert. Issue 47: radiation risks of diagnostic imaging. Available at http://www.jointcommission.org/sea_issue_47/ Accessed February 20, 2016
11. Accreditation Council for Graduate Medical Education : ACGME Program requirements for graduate medical education in diagnostic radiology. Available at http://www.acgme.org/acgmeweb/Portals/0/PFAssets/2013-PR-FAQ-PIF/420_diagnostic_radiology_07012013.pdf Accessed February 20, 2016
12. Accreditation Council for Graduate Medical Education : ACGME Program requirements for graduate medical education in neuroradiology. Available at http://www.acgme.org/acgmeweb/Portals/0/PFAssets/2013-PR-FAQ-PIF/423_neuroradiology_diag_rad_07012013_1-YR.pdf Accessed February 20, 2016
13. The diagnostic radiology milestone project. Available at https://www.acgme.org/acgmeweb/Portals/0/PDFs/Milestones/DiagnosticRadiologyMilestones.pdf Accessed February 20, 2016
14. Kroll H., Duszak R., Nsiah E., et. al.: Trends in lumbar puncture over 2 decades: a dramatic shift to radiology. AJR Am J Roentgenol 2015; 204: pp. 15-19.
15. National Heart, Lung, and Blood Institute : How are overweight and obesity diagnosed?. Available at http://www.nhlbi.nih.gov/health/health-topics/topics/obe/diagnosis.html Accessed February 20, 2016
16. Kieffer S., Mukundan S., Rollins N.: ACR–ASNR–SPR practice guideline for the performance of myelography and cisternography. Available at http://www.acr.org//media/f4c49aa1834d46a081f5f0ff20e1e26b.pdf Accessed February 20, 2016
17. R Core Team : R: a language and environment for statistical computing.2012.R Foundation for Statistical ComputingVienna, Austria
18. Finucane M.M., Stevens G.A., Cowan M.J., et. al., Global Burden of Metabolic Risk Factors of Chronic Diseases Collaborating Group (Body Mass Index): National, regional, and global trends in body-mass index since 1980: systematic analysis of health examination surveys and epidemiological studies with 960 country-years and 9⋅1 million participants. Lancet 2011; 377: pp. 557-567.
19. Fryar C., Carroll M., Ogden C.: Prevalence of overweight, obesity, and extreme obesity among adults: United States, trends 1960–62 through 2009–2010. Available at http://www.cdc.gov/nchs/data/hestat/obesity_adult_09_10/obesity_adult_09_10.htm Accessed February 20, 2016
20. Hicks G.E., Morone N., Weiner D.K.: Degenerative lumbar disc and facet disease in older adults: prevalence and clinical correlates. Spine 2009; 34: pp. 1301-1306.
21. Sfoungaristos S., Lorber A., Gofrit O.N., et. al.: Surgical experience gained during an endourology fellowship program may affect fluoroscopy time during ureterorenoscopy. Urolithiasis 2015; 43: pp. 369-374.
22. Stuart S., Mayo J.R., Ling A., et. al.: Retrospective study of the impact of fellowship training on two quality and safety measures in uterine artery embolization. J Am Coll Radiol 2014; 11: pp. 471-476.
23. Lim R., Khawaja R.D., Nimkin K., et. al.: Relationship between radiologist training level and fluoroscopy time for voiding cystourethrography. AJR Am J Roentgenol 2013; 200: pp. 645-651.
24. Like M., Solovieva S., Lamminen A.: Disc degeneration of the lumbar spine in relation to overweight. Int J Obes 2005; 29: pp. 903-908.
25. Nayate A.P., Nasrallah I.M., Schmitt J.E., et. al.: Using body mass index to predict needle length in fluoroscopy-guided lumbar punctures. AJNR Am J Neuroradiol 2016; 37: pp. 572-578.
26. Cushman D., Mattie R., Curtis B., et. al.: The effect of body mass index on fluoroscopic time and radiation dose during lumbar transforaminal epidural steroid injections. Spine J 2016; 16: pp. 876-883. http://dx.doi.org/10.1016/j.spinee.2016.03.041