
Rationale and Objectives
The study aimed to evaluate the feasibility and advantages of a combined high temporal and high spatial resolution protocol for dynamic contrast-enhanced magnetic resonance imaging of the breast.
Materials and Methods
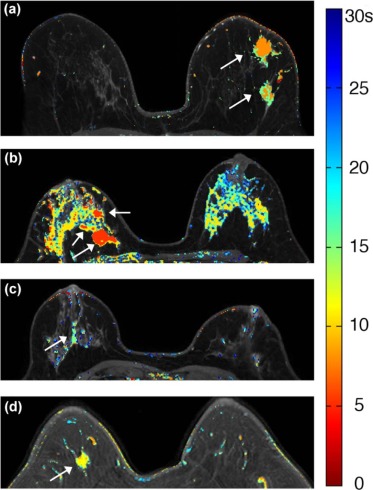
Twenty-three patients with enhancing lesions were imaged at 3T. The acquisition protocol consisted of a series of bilateral, fat-suppressed “ultrafast” acquisitions, with 6.9- to 9.9-second temporal resolution for the first minute following contrast injection, followed by four high spatial resolution acquisitions with 60- to 79.5-second temporal resolution. All images were acquired with standard uniform Fourier sampling. A filtering method was developed to reduce noise and detect significant enhancement in the high temporal resolution images. Time of arrival (TOA) was defined as the time at which each voxel first satisfied all the filter conditions, relative to the time of initial arterial enhancement.
Results
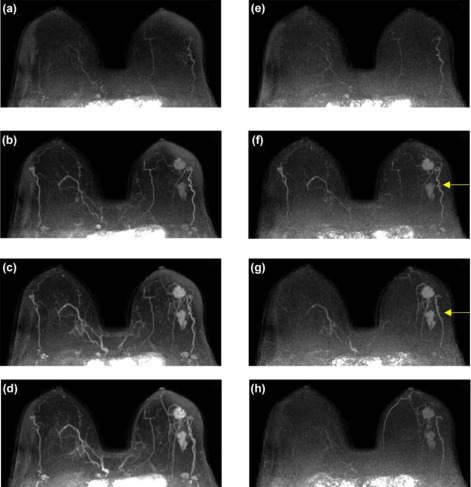
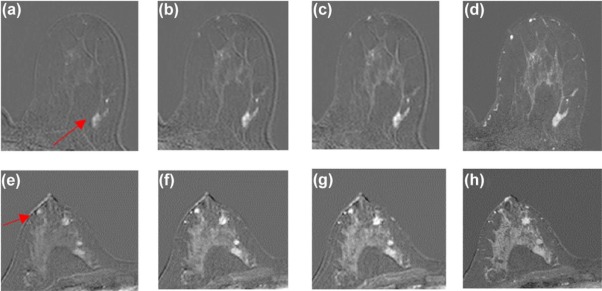
Ultrafast images improved visualization of the vasculature feeding and draining lesions. A small percentage of the entire field of view (<6%) enhanced significantly in the 30 seconds following contrast injection. Lesion conspicuity was highest in early ultrafast images, especially in cases with marked parenchymal enhancement. Although the sample size was relatively small, the average TOA for malignant lesions was significantly shorter than the TOA for benign lesions. Significant differences were also measured in other parameters descriptive of early contrast media uptake kinetics ( P < 0.05).
Conclusions
Ultrafast imaging in the first minute of dynamic contrast-enhanced magnetic resonance imaging of the breast has the potential to add valuable information on early contrast dynamics. Ultrafast imaging could allow radiologists to confidently identify lesions in the presence of marked background parenchymal enhancement.
Introduction
Dynamic contrast-enhanced magnetic resonance imaging (DCE-MRI) of the breast is a valuable tool for the detection and diagnosis of breast cancer . The kinetics of contrast media uptake and washout yield important markers for malignancy . Typically, malignant tumors exhibit fast uptake of contrast media followed by washout in the delayed phase . Standard clinical contrast-enhanced scans are generally performed with high spatial resolution to enable morphologic evaluation of lesions and detect small cancers . The high spatial resolution required, combined with the large fields of view necessary to acquire bilateral images, leads to low temporal resolution, typically in the range of 60–75 seconds. As a result, important kinetic information is obscured.
Acquiring DCE-MRI with high temporal resolution is important, as it allows accurate classification of contrast media dynamics in suspicious lesions, and thus has the potential to aid discrimination between malignant and benign lesions. In addition, high temporal resolution allows accurate measurement of the arterial input function for each patient, a critical step in quantitative pharmacokinetic analysis . However, the early events in contrast media uptake in normal breast and breast lesions have not been well characterized; thus, it is difficult to know what temporal resolution is optimal for breast MRI.
Get Radiology Tree app to read full this article<
Get Radiology Tree app to read full this article<
Get Radiology Tree app to read full this article<
Materials and Methods
Patient Recruitment
Get Radiology Tree app to read full this article<
MRI Acquisitions
Get Radiology Tree app to read full this article<
Table 1
Acquisition Parameters for Ultrafast and High Spatial Resolution Sequences
Parameters Ultrafast High Spatial Resolution TR/TE (ms) 3.2/1.6 4.8/2.4 Acquisition voxel size (mm 3 ) 1.5 × 1.5 × 3.0 0.8 × 0.8 × 1.6 SENSE acceleration factor (RL) 4 2.5 SENSE acceleration factor (FH) 2 2 Half scan (partial Fourier) factor 0.75 (ky); 0.85 (kz) 0.85 (ky); 1 (kz) Temporal resolution range (s) 6.9–9.9 60–79.5 Number of slices 100–120 187–225 Flip angle 10° Field of view (mm) 300–370 Fat suppression method SPAIR (TR: 155 ms; inversion delay: 80 ms)
TR, repetition time; TE, echo time; SENSE, sensitivity encoding; RL, right-left; FH, foot-head; SPAIR, spectral attenuated inversion recovery.
Get Radiology Tree app to read full this article<
Data Analysis
Get Radiology Tree app to read full this article<
Get Radiology Tree app to read full this article<
Get Radiology Tree app to read full this article<
PSE(t)=A(1−exp(−αt)) P
S
E
(
t
)
=
A
(
1
−
exp
(
−
α
t
)
)
where A is the upper limit of percent enhancement, and α is the uptake rate (sec −1 ). A truncated EMM was used to evaluate the potential diagnostic value of early kinetic data as measured with the proposed protocol. From the EMM parameters, three secondary parameters were calculated: initial area under the contrast enhancement versus time curve (iAUC) , time to 90% of maximum enhancement (T90), and initial slope (defined as the product of the uptake rate and the upper limit of enhancement). T90 was used as a surrogate for time-to-peak enhancement.
Get Radiology Tree app to read full this article<
Get Radiology Tree app to read full this article<
Get Radiology Tree app to read full this article<
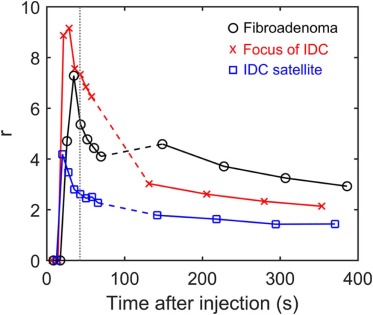
r(t)=(S(t)−S0)lesion(S(t)−S0)parenchyma r
(
t
)
=
(
S
(
t
)
−
S
0
)
lesion
(
S
(
t
)
−
S
0
)
parenchyma
Get Radiology Tree app to read full this article<
Get Radiology Tree app to read full this article<
Results
Get Radiology Tree app to read full this article<
Get Radiology Tree app to read full this article<
Get Radiology Tree app to read full this article<
Get Radiology Tree app to read full this article<
Get Radiology Tree app to read full this article<
Get Radiology Tree app to read full this article<
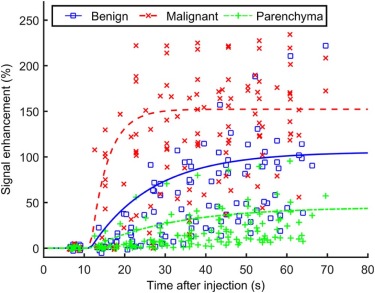
Table 2
Average Values (and Standard Deviations) of Kinetic Parameters Derived From the EMM Fits for Both Benign and Malignant Lesions and the Malignant to Benign Ratio for the Mean Value of Each Parameter
Parameters Malignant Benign Ratio (M:B) A (%) 152 ± 48 106 ± 60 1.4:1 α (%/s) \* 23 ± 35 6.5 ± 3.3 3.6:1 Initial slope \* 0.42 ± 0.73 0.07 ± 0.05 6.3:1 iAUC (30 s) \* 33.3 ± 14.3 15.6 ± 10.1 2.5:1 TOA (s) \* 6.9 ± 4.6 15.5 ± 13.6 0.4:1 T90 (s) \* 27.3 ± 13.9 90.5 ± 139.8 0.3:1
EMM, empirical mathematical model; iAUC, initial area under the contrast enhancement versus time curve; T90, time to 90% of maximum enhancement; TOA, time of arrival.
Get Radiology Tree app to read full this article<
Get Radiology Tree app to read full this article<
Get Radiology Tree app to read full this article<
Get Radiology Tree app to read full this article<
Discussion
Get Radiology Tree app to read full this article<
Get Radiology Tree app to read full this article<
Get Radiology Tree app to read full this article<
Get Radiology Tree app to read full this article<
Get Radiology Tree app to read full this article<
Get Radiology Tree app to read full this article<
Get Radiology Tree app to read full this article<
Get Radiology Tree app to read full this article<
Get Radiology Tree app to read full this article<
Get Radiology Tree app to read full this article<
Get Radiology Tree app to read full this article<
Get Radiology Tree app to read full this article<
Get Radiology Tree app to read full this article<
Acknowledgments
Get Radiology Tree app to read full this article<
References
1. Turnbull L.W.: Dynamic contrast-enhanced MRI in the diagnosis and management of breast cancer. NMR Biomed 2009; 22: pp. 28-39.
2. Kuhl C.K., Mielcareck P., Klaschik S., et. al.: Dynamic breast MR imaging: are signal intensity time course data useful for differential diagnosis of enhancing lesions? Radiology1999.pp. 101-110. Vol. 211; 1999
3. Yankeelov T., Gore J.: Dynamic contrast enhanced magnetic resonance imaging in oncology: theory, data acquisition, analysis, and examples. Curr Med Imaging Rev 2009; 3: pp. 91-107.
4. Kuhl C.K., Schild H.H., Morakkabati N.: Dynamic bilateral contrast-enhanced MR imaging of the breast: trade-off between spatial and temporal resolution. Radiology 2005; 236: pp. 789-800.
5. Tofts P.S.: Modeling tracer kinetics in dynamic Gd-DTPA MR imaging. J Magn Reson Imaging 1997; pp. 91-101.
6. Tofts P.S., Brix G., Buckley D.L., et. al.: Estimating kinetic parameters from dynamic contrast-enhanced T1-weighted MRI of a diffusable tracer: standardized quantities and symbols. J Magn Reson Imaging 1999; 10: pp. 223-232.
7. Henderson E., Rutt B.K., Lee T.Y.: Temporal sampling requirements for the tracer kinetics modeling of breast disease. Magn Reson Imaging 1998; 16: pp. 1057-1073.
8. Planey C.R., Welch E.B., Xu L., et. al.: Temporal sampling requirements for reference region modeling of DCE-MRI data in human breast cancer. J Magn Reson Imaging 2009; 30: pp. 121-134.
9. Jansen S.A., Fan X., Medved M., et. al.: Characterizing early contrast uptake of ductal carcinoma in situ with high temporal resolution dynamic contrast-enhanced MRI of the breast: a pilot study. Phys Med Biol 2010; 55: pp. N473-N485.
10. Pinker K., Grabner G., Bogner W., et. al.: A combined high temporal and high spatial resolution 3 Tesla MR imaging protocol for the assessment of breast lesions: initial results. Invest Radiol 2009; 44: pp. 553-558.
11. Fan X., Medved M., River J.N., et. al.: New model for analysis of dynamic contrast-enhanced MRI data distinguishes metastatic from nonmetastatic transplanted rodent prostate tumors. Magn Reson Med 2004; 51: pp. 487-494.
12. Fan X., Medved M., Karczmar G.S., et. al.: Diagnosis of suspicious breast lesions using an empirical mathematical model for dynamic contrast-enhanced MRI. Magn Reson Imaging 2007; 25: pp. 593-603.
13. Jansen S.A., Fan X., Karczmar G.S., et. al.: Differentiation between benign and malignant breast lesions detected by bilateral dynamic contrast-enhanced MRI: a sensitivity and specificity study. Magn Reson Med 2008; 59: pp. 747-754.
14. Evelhoch J.L.: Key factors in the acquisition of contrast kinetic data for oncology. J Magn Reson Imaging 1999; 10: pp. 254-259.
15. DeMartini W.B., Liu F., Peacock S., et. al.: Background parenchymal enhancement on breast MRI: impact on diagnostic performance. AJR Am J Roentgenol 2012; 198: pp. 373-380.
16. Delille J.P., Slanetz P.J., Yeh E.D., et. al.: Physiologic changes in breast magnetic resonance imaging during the menstrual cycle: perfusion imaging, signal enhancement, and influence of the T1 relaxation time of breast tissue. Breast J 2005; 11: pp. 236-241.
17. Amarosa A.R., McKellop J., Klautau Leite A.P., et. al.: Evaluation of the kinetic properties of background parenchymal enhancement throughout the phases of the menstrual cycle. Radiology 2013; 268: pp. 356-365.
18. El Khouli R.H., Macura K.J., Kamel I.R., et. al.: 3-T dynamic contrast-enhanced MRI of the breast: pharmacokinetic parameters versus conventional kinetic curve analysis. AJR Am J Roentgenol 2011; 197: pp. 1498-1505.
19. Mann R.M., Mus R.D., van Zelst J., et. al.: A novel approach to contrast-enhanced breast magnetic resonance imaging for screening. Invest Radiol 2014; 49: pp. 579-585.
20. Platel B., Mus R., Welte T., et. al.: Automated characterization of breast lesions imaged with an ultrafast DCE-MR protocol. IEEE Trans Med Imaging 2014; 33: pp. 225-232.
21. Kuhl C.K., Schrading S., Strobel K., et. al.: Abbreviated breast magnetic resonance imaging (MRI): first postcontrast subtracted images and maximum-intensity projection—a novel approach to breast cancer screening with MRI. J Clin Oncol 2014; 32: pp. 2304-2310.
22. Petkova M., Gauvrit J.-Y., Trystram D., et. al.: Three-dimensional dynamic time-resolved contrast-enhanced MRA using parallel imaging and a variable rate k-space sampling strategy in intracranial arteriovenous malformations. J Magn Reson Imaging 2009; 29: pp. 7-12.
23. Willinek W.A., Hadizadeh D.R., von Falkenhausen M., et. al.: 4D time-resolved MR angiography with keyhole (4D-TRAK): more than 60 times accelerated MRA using a combination of CENTRA, keyhole, and SENSE at 3.0T. J Magn Reson Imaging 2008; 27: pp. 1455-1460.
24. Lim R.P., Shapiro M., Wang E.Y., et. al.: 3D time-resolved MR angiography (MRA) of the carotid arteries with time-resolved imaging with stochastic trajectories: comparison with 3D contrast-enhanced bolus-chase MRA and 3D time-of-flight MRA. AJNR Am J Neuroradiol 2008; 29: pp. 1847-1854.
25. Song T., Laine A.F., Chen Q., et. al.: Optimal k-space sampling for dynamic contrast-enhanced MRI with an application to MR renography. Magn Reson Med 2009; 61: pp. 1242-1248.
26. Han S., Paulsen J.L., Zhu G., et. al.: Temporal/spatial resolution improvement of in vivo DCE-MRI with compressed sensing-optimized FLASH. Magn Reson Imaging 2012; 30: pp. 741-752.
27. Tudorica L.A., Oh K.Y., Roy N., et. al.: A feasible high spatiotemporal resolution breast DCE-MRI protocol for clinical settings. Magn Reson Imaging 2012; 30: pp. 1257-1267.
28. Kershaw L.E., Cheng H.-L.M.: A general dual-bolus approach for quantitative DCE-MRI. Magn Reson Imaging 2011; 29: pp. 160-166.
29. Ramsay E., Causer P., Hill K., et. al.: Adaptive bilateral breast MRI using projection reconstruction time-resolved imaging of contrast kinetics. J Magn Reson Imaging 2006; 24: pp. 617-624.
30. Wang H., Miao Y., Zhou K., et. al.: Feasibility of high temporal resolution breast DCE-MRI using compressed sensing theory. Med Phys 2010; 37: pp. 4971-4981.
31. Chan R.W., Ramsay E.A., Cheung E.Y., et. al.: The influence of radial undersampling schemes on compressed sensing reconstruction in breast MRI. Magn Reson Med 2012; 67: pp. 363-377.
32. Smith D.S., Welch E.B., Li X., et. al.: Quantitative effects of using compressed sensing in dynamic contrast enhanced MRI. Phys Med Biol 2011; 56: pp. 4933-4946.
33. Chen L., Schabel M.C., DiBella E.V.R.: Reconstruction of dynamic contrast enhanced magnetic resonance imaging of the breast with temporal constraints. Magn Reson Imaging 2010; 28: pp. 637-645.
34. Medved M., Karczmar G., Yang C., et. al.: Semiquantitative analysis of dynamic contrast enhanced MRI in cancer patients: variability and changes in tumor tissue over time. J Magn Reson Imaging 2004; 20: pp. 122-128.
35. Patlak C.S., Blasberg R.G., Fenstermacher J.D.: Graphical evaluation of blood-to-brain transfer constants from multiple-time uptake data. J Cereb Blood Flow Metab 1983; 3: pp. 1-7.
36. Sourbron S.P., Buckley D.L.: On the scope and interpretation of the Tofts models for DCE-MRI. Magn Reson Med 2011; 66: pp. 735-745.
37. Bassett L.W., Dhaliwal S.G., Eradat J., et. al.: National trends and practices in breast MRI. AJR Am J Roentgenol 2008; 191: pp. 332-339.