
Rationale and Objectives
Improvements in the diagnosis of early breast cancers depend on a physician’s ability to obtain the information necessary to distinguish nonpalpable malignant and benign tumors.Viscoelastic features that describe mechanical properties of tissues may help to distinguish these types of lesions.
Materials and Methods
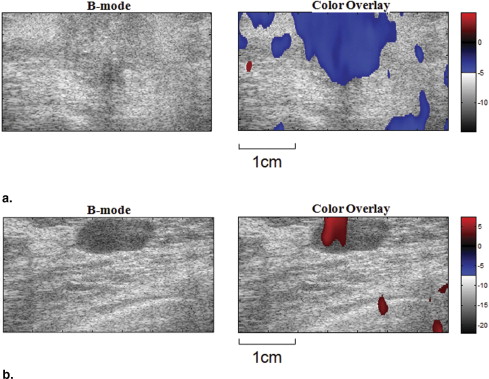
Twenty-one patients with nonpalpable, pathology-confirmed Breast Imaging Reporting and Data System (BIRADS) 4 or 5 breast lesions (10 benign, 11 malignant) detected by mammography were studied. Viscoelastic parameters were extracted from a time sequence of ultrasonic strain images, and differences in the parameters between malignant and benign tumors were compared. Parametric data were color coded and superimposed on sonograms.
Results
The strain retardance time parameter, T 1 , provided the best discrimination between malignant and benign tumors ( P < .01). T 1 measures the time required for tissues to fully deform (strain) once compressed; therefore, it describes the time-varying viscous response of tissue to a small deforming force. Compared to the surrounding background tissues, malignant lesions have smaller average T 1 values, whereas benign lesions have higher T 1 values. This tissue-specific contrast correlates with known changes in the extracellular matrix of breast stroma.
Conclusion
Characterization of nonpalpable breast lesions is improved by the addition of viscoelastic strain imaging parameters. The differentiation of malignant and benign BI-RADS 4 or 5 tumors is especially evident with the use of the retardation time estimates, T 1 .
Breast cancer is the fifth most common cause of cancer death worldwide, and the most frequently diagnosed cancer in women ( ). In the United States during 2007, it was expected that approximately 178,480 women would develop invasive breast cancer and an estimated 40,910 patients would die from this disease. The combined efforts of early detection and improved treatment have steadily decreased the death rate in women from breast cancer since 1990. The earliest cancer signs are detectable by medical imaging often before symptoms appear. Diagnosis is currently based on information obtained from the clinical examination, anatomic imaging, and biopsy. Although histopathology is the gold standard for diagnosis, the biopsy procedure is invasive, expensive, and carries some risk. Therefore, additional noninvasive diagnostic imaging methods to increase specificity and reduce the need for biopsy would be beneficial.
Recent discoveries in molecular biology have triggered interest in developing new and potentially more specific imaging methods for breast cancer diagnosis ( ). These include techniques for: 1) direct imaging of signaling molecules and/or receptors mediating malignant progression, and 2) indirect imaging of intrinsic tissue properties (eg, biochemical, mechanical) that describe the tumor microenvironment controlling signaling pathways. We use the latter method to detect local changes in soft tissue. The alteration in elasticity properties is in part a result of inflammation that usually occurs during the early stages of disease development. The extracellular matrix (ECM) of breast stroma, which provides the solid consistency of parenchymal tissues, plays an active role in cancerous tumor growth ( ). Hence, breast stroma is a potentially valuable source of endogenous disease-specific contrast.
Get Radiology Tree app to read full this article<
Get Radiology Tree app to read full this article<
Get Radiology Tree app to read full this article<
Materials and methods
Patient Selection
Get Radiology Tree app to read full this article<
Get Radiology Tree app to read full this article<
Lesion Diagnoses
Get Radiology Tree app to read full this article<
Get Radiology Tree app to read full this article<
Get Radiology Tree app to read full this article<
Get Radiology Tree app to read full this article<
Get Radiology Tree app to read full this article<
Get Radiology Tree app to read full this article<
Imaging Techniques
Get Radiology Tree app to read full this article<
Get Radiology Tree app to read full this article<
Curve Fitting
Get Radiology Tree app to read full this article<
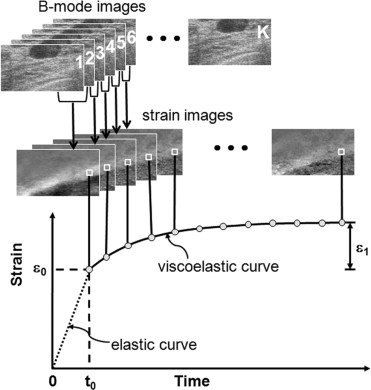
Get Radiology Tree app to read full this article<
Get Radiology Tree app to read full this article<
ε(t)=ε0+ε1(1−exp(−t/T1)). ε
(
t
)
=
ε
0
+
ε
1
(
1
−
exp
(
−
t
/
T
1
)
)
.
Get Radiology Tree app to read full this article<
Get Radiology Tree app to read full this article<
Get Radiology Tree app to read full this article<
Pixel Selection and Averaging
Get Radiology Tree app to read full this article<

Get Radiology Tree app to read full this article<
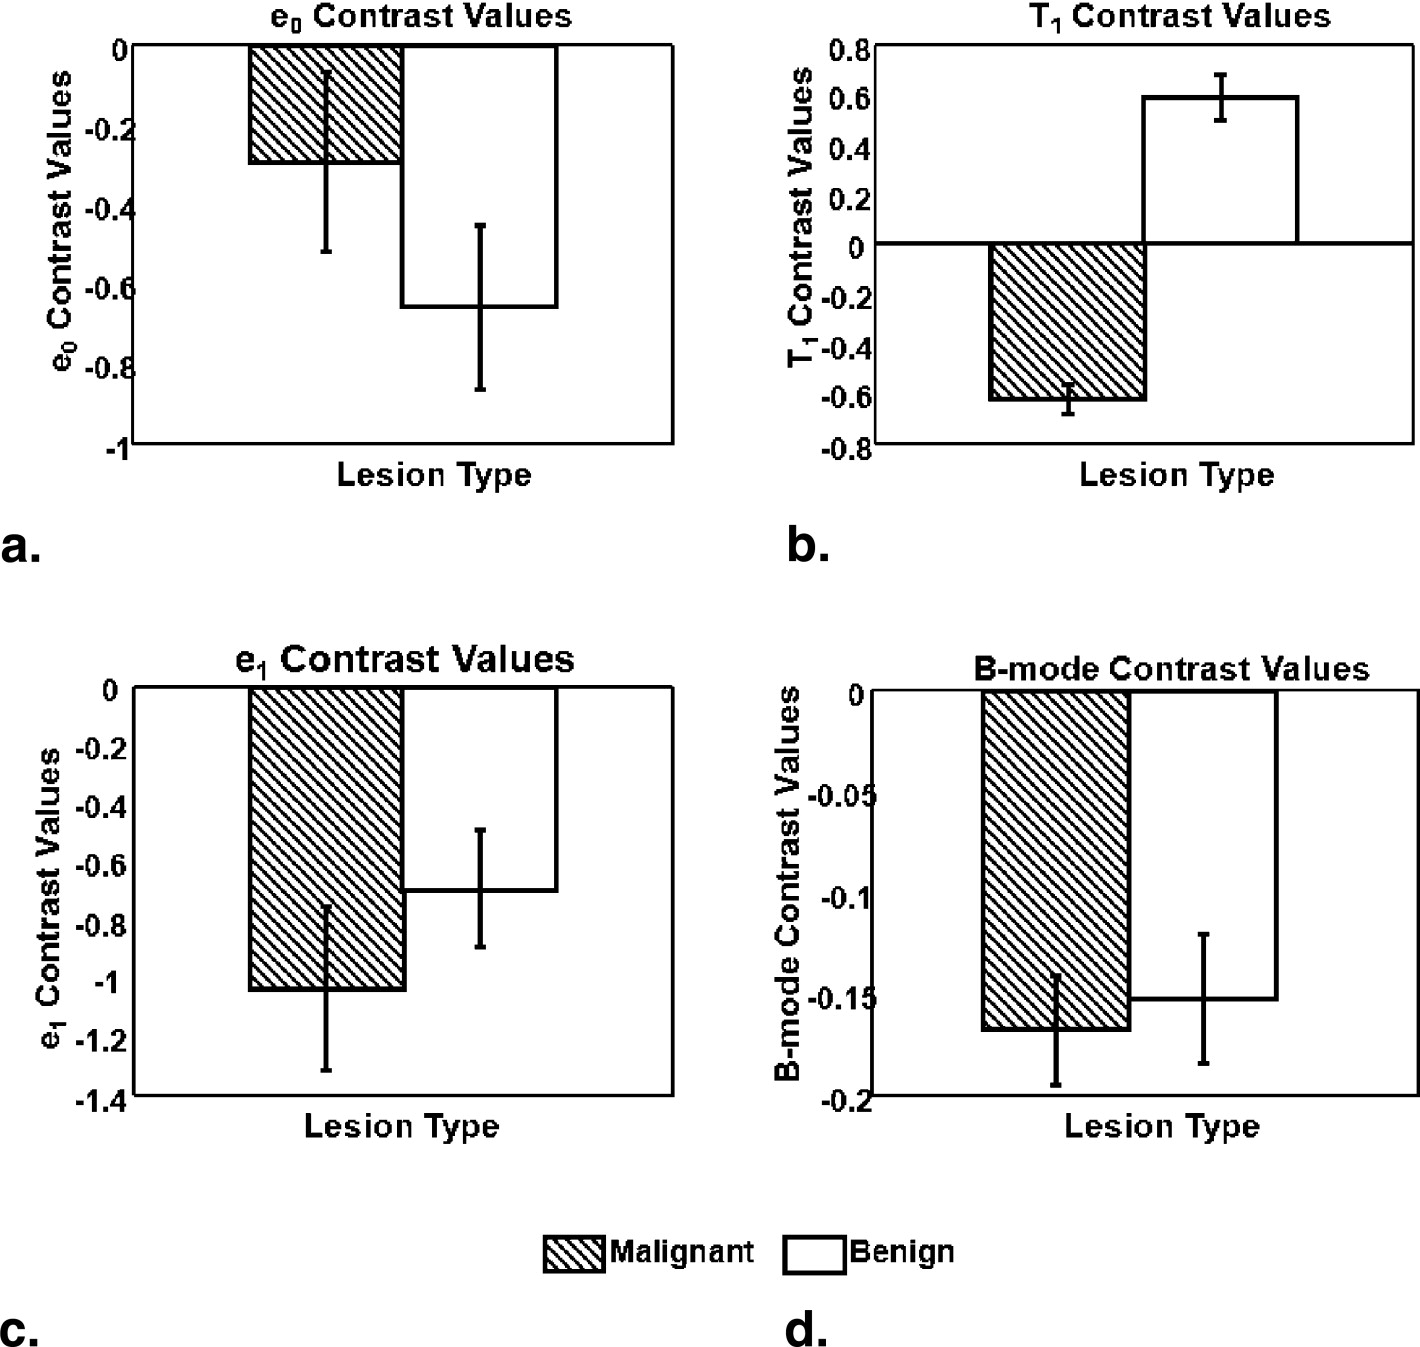
Parametric Contrast
Get Radiology Tree app to read full this article<
C=Xlesion−Xbackground(Xlesion+Xbackground)/2=DifferenceAverage, C
=
X
l
e
s
i
o
n
−
X
b
a
c
k
g
r
o
u
n
d
(
X
l
e
s
i
o
n
+
X
b
a
c
k
g
r
o
u
n
d
)
/
2
=
D
i
f
f
e
r
e
n
c
e
A
v
e
r
a
g
e
,
where X__lesion and X__background represents any of the four previously described parameters from the lesion and background tissue areas of a patient scan.
Get Radiology Tree app to read full this article<
Results
Statistical Analysis
Get Radiology Tree app to read full this article<
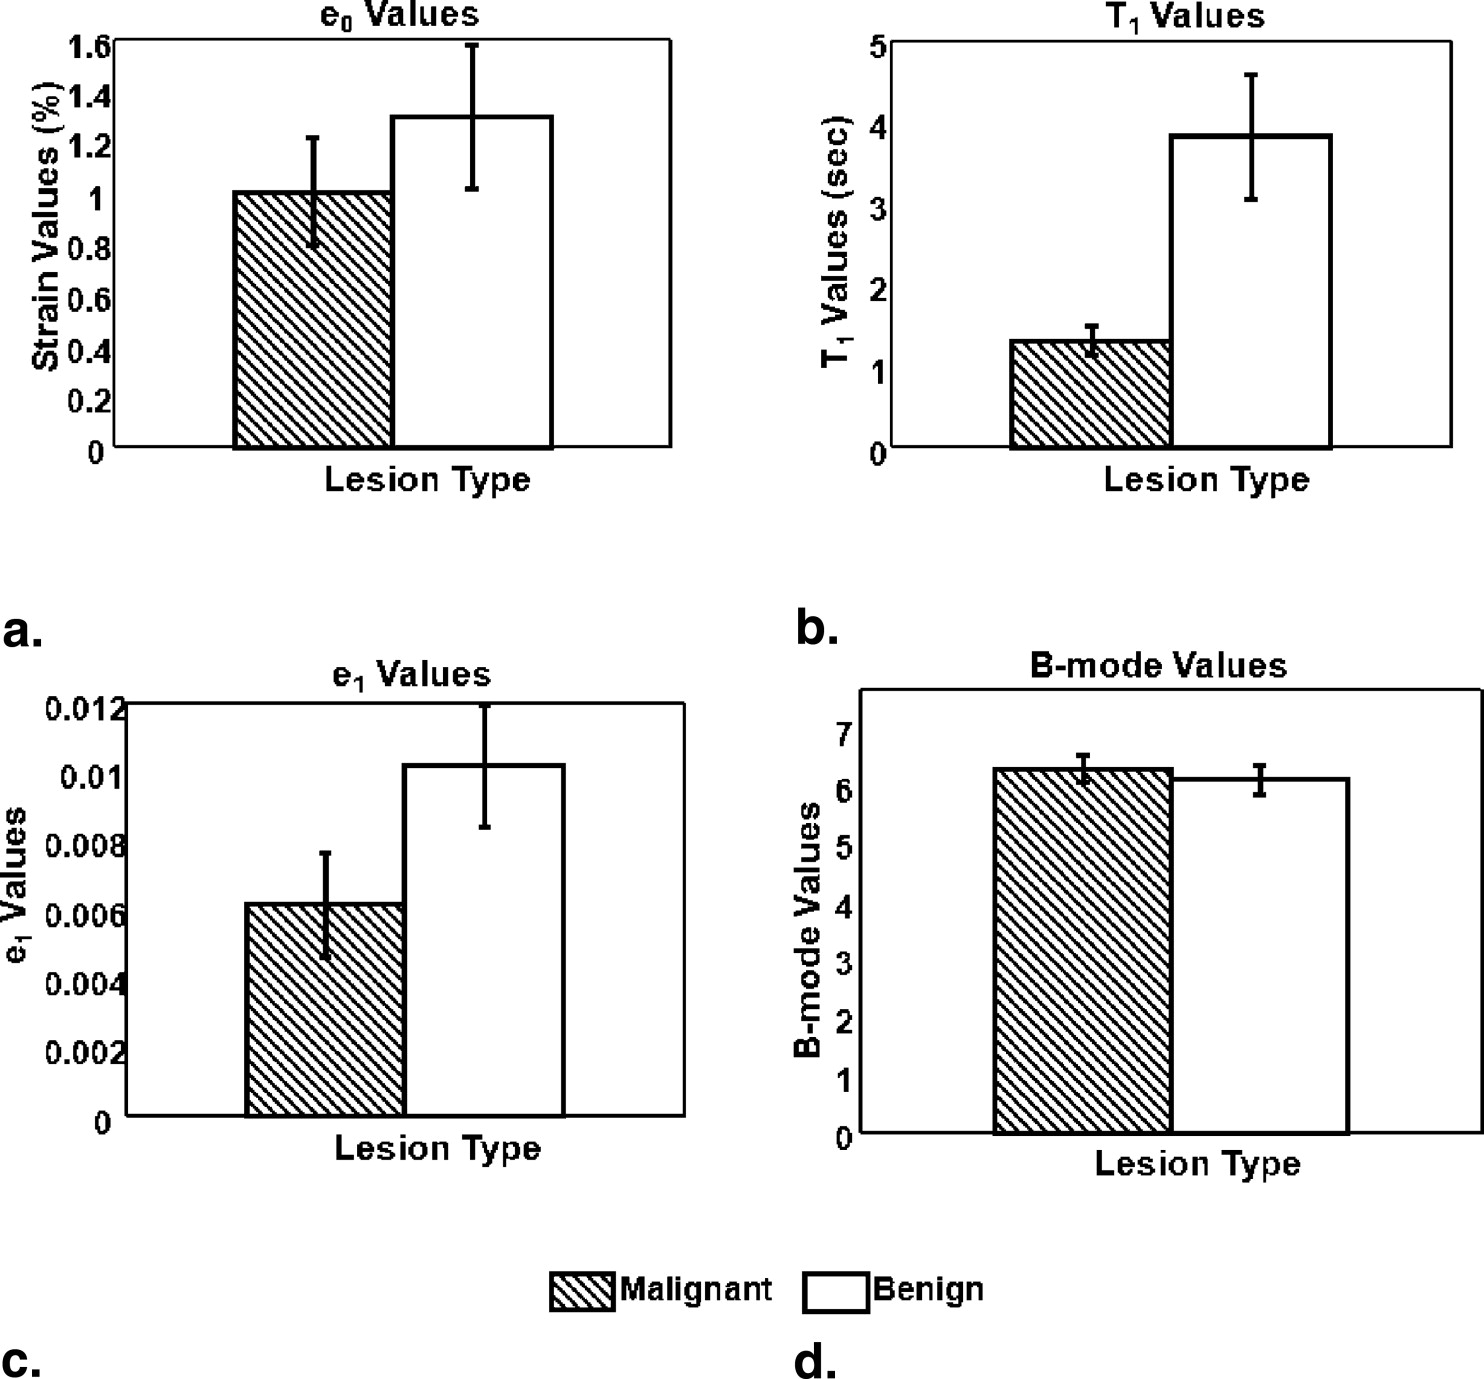
Table 1
t -Test Results from Viscoelastic Parameters
Parameter_P_ Values (95% significance)ε 0 .4213T 1 .0098ε 1 .0986 B-mode .5830
Get Radiology Tree app to read full this article<
Get Radiology Tree app to read full this article<
Contrast Histograms and Scatterplot
Get Radiology Tree app to read full this article<
Get Radiology Tree app to read full this article<
Get Radiology Tree app to read full this article<
Get Radiology Tree app to read full this article<
Get Radiology Tree app to read full this article<
Get Radiology Tree app to read full this article<
Get Radiology Tree app to read full this article<
Discussion
Get Radiology Tree app to read full this article<
Get Radiology Tree app to read full this article<
Get Radiology Tree app to read full this article<
Get Radiology Tree app to read full this article<
Get Radiology Tree app to read full this article<
Get Radiology Tree app to read full this article<
Get Radiology Tree app to read full this article<
Acknowledgments
Get Radiology Tree app to read full this article<
Get Radiology Tree app to read full this article<
Get Radiology Tree app to read full this article<
Get Radiology Tree app to read full this article<
References
1. American Cancer Society (2007): Cancer Facts & Figures 2007.2007.American Cancer SocietyAtlanta, GA
2. Insana M.F., Wickline S.A.: Multimodality biomolecular imaging. Proc IEEE 2008; 96: pp. 378-381.
3. Moinfar F., Man Y.G., Arnould L., Bratthauer G.L., Ratscheck M., Tavassoli F.A.: Concurrent and independent genetic alterations in the stromal and epithelial cells of mammary carcinoma: implications for tumorigenesis. Can Res 2000; 60: pp. 2562-2566.
4. Greenleaf J.F., Fatemi M., Insana M.: Selected methods for imaging elastic properties of biological tissues.Martin YarmushAnnual Review of Biomedical Engineering.2003.Annual ReviewsPalo Alto, CA:pp. 57-78.
5. Lerner R., Parker K.: Sonoelasticity imaging. Acoustic Imag 1988; 17: pp. 317-327.
6. Sinkus R., Tanter M., Xydeas T., Catheline S., Bercoff J., Fink M.: Viscoelastic shear properties of in vivo breast lesions measured by MR elastography. Magn Reson Imaging 2005; 23: pp. 159-165.
7. Fatemi M., Greenleaf J.: Ultrasound stimulated vibro-acoustic spectrography. Science 1998; 280: pp. 82-85.
8. Sharma A., Soo M., Trahey G., Nightingale K.: Acoustic radiation force impulse imaging of in vivo breast masses. Proc IEEE Ultrason Symp 2004; pp. 728-731.
9. Sridhar M., Insana M.F.: Ultrasonic measurements of breast viscoelasticity. Med Phys 2007; 34: pp. 4757-4767.
10. Thomas A., Kümmel S., Fritzsche F., Warm M., Ebert B., Hamm B., Fischer T.: Real-time sonoelastography performed in addition to B-mode ultrasound and mammography: improved differentiation of breast lesions. Acad Radiol 2006; 13: pp. 1496-1504.
11. Thomas A., Warm M., Hoopmann M., Diekmann F., Fischer T.: Tissue Doppler and strain imaging for evaluating tissue elasticity of breast lesions. Acad Radiol 2007; 14: pp. 522-529.
12. Zhi H., Ou B., Luo B.M., Feng X., Wen Y.L., Yang H.Y.: Comparison of ultrasound elastography, mammography, and sonography in the diagnosis of solid breast lesions. J Ultrasound Med 2007; 26: pp. 807-815.
13. Itoh A., Ueno E., Tohno E., Kamma H., Takahashi H., Shiina T., Yamakawa M., Matsumura T.: Breast disease: clinical application of US elastography for diagnosis. Radiology 2006; 239: pp. 341-350.
14. Rosen P.P.: Rosen’s breast pathology.2001.Lippincott Williams & WilkinsPhiladelphia, PA
15. Garra B.S., Cespedes E.I., Ophir J., Spratt S.R., Zuurbier R.A., Magnant C.M., Pennanen M.F.: Elastography of breast lesions: initial clinical results. Radiology 1997; 202: pp. 79-86.
16. Insana M.F., Pellot-Barakat C., Sridhar M., Lindfors K.: Viscoelastic imaging of breast tumor microenvironment with ultrasound. J Mammary Gland Biol & Neoplasia 2004; 9: pp. 393-404.
17. Du H., Liu J., Barakat C., Insana M.F.: Optimizing multicompression approaches to breast elasticity imaging. IEEE Trans Ultrason Ferroelec Freq Control 2006; 53: pp. 90-99.
18. Pellot-Barakat C., Frouin F., Insana M.F.: Ultrasound elastography based on multiscale estimations of regularized displacement fields. IEEE Trans Med Imaging 2004; 23: pp. 153-163.
19. Sridhar M., Liu J., Insana M.F.: Viscoelasticity imaging using ultrasound: parameters and error analysis. Phys Med Biol 2007; 52: pp. 2425-2443.
20. Losa G., Alini M.: Sulphated proteoglycans in the extracellular matrix of human breast tissues with infiltrating carcinoma. Int J Cancer 1993; 54: pp. 552-557.