
Rationale and Objectives
To evaluate the efficacy of variable contrast injection durations and scanning delay determined by test injection analysis of computed tomography angiography (CTA) of peripheral arteries.
Materials and Methods
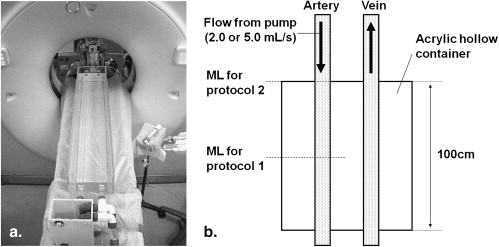
We used a flow phantom that simulates the hemodynamics in a lower extremity artery. We set the flow rate at the pump to 2.0 or 5.0 L/minute. In protocol 1, we adopted a variable contrast injection duration based on the peak enhancement time of the test injection monitoring at the central level of the scan range. In protocol 2, we adopted a fixed contrast injection duration. The scanning delay was determined with a conventional bolus-tracking technique monitoring at the top of the scan range. Mean arterial attenuation and difference between the maximum and minimum attenuation values were calculated. To verify the phantom study results, clinical study, including 16 patients was performed under protocol 1.
Results
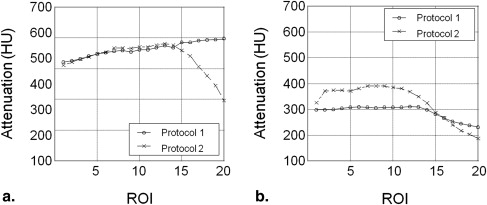
The mean attenuation values under protocols 1 and 2 were comparable (563.6 Hounsfield units [HU] and 535.0 HU, respectively) at a pump flow rate of 2.0 L/minute; at 5.0 L/minute, they were 289.4 HU and 328.8 HU. The difference between the maximum and minimum attenuation values was smaller under protocol 1 than protocol 2 (76.8 HU vs. 184.9 HU) at a pump flow of 2.0 L/minute and also smaller under protocol 1 than protocol 2 (79.7 HU vs. 203.8 HU) at 5.0 L/minute. In clinical study, the mean attenuation value was 332.6 ± 51.9 HU, and the difference between the maximum and minimum attenuation values was 55.1 ± 24.4 HU.
Conclusion
The object-specific injection duration based on test injection at the central level of the scan range provides sufficient and constant vascular enhancement at CTA.
Computed tomography angiography (CTA) is an accurate modality to assess the presence and extent of peripheral arterial disease (PAD) . With CTA of peripheral arteries, it is important to evaluate not only arterial stenosis, but also the runoff vessels. Coexisting cardiovascular disorders and blood flow obstruction or aneurysms may delay opacification of peripheral arterial trees . Moreover, the actual flow speed of the injected contrast material through the peripheral arteries is highly variable in patients with PAD . Because high-speed multidetector computed tomography (MDCT) scanning can outpace the flow of the contrast bolus, resulting in inadequate vascular enhancement of peripheral arteries, the contrast injection method should take into account the arterial transit speed.
To achieve satisfactory enhancement of a wide range of aortoiliac and lower extremity arteries, adequate enhancement must be maintained for a certain period depending on the computed tomography (CT) data acquisition time. Time-to-peak arterial enhancement is theoretically equal to the contrast injection duration for a given arterial arrival time when the injection duration is longer than the arterial peak time of the test bolus . Therefore, we applied time-to-peak arterial enhancement of the test injection to the injection duration at CTA to achieve sufficient and constant vascular enhancement. Moreover, we set the monitoring level of the test injection at the central level of the scan range to avoid outpacing the scanning.
Get Radiology Tree app to read full this article<
Materials and methods
Get Radiology Tree app to read full this article<
Phantom Study
Phantom configuration
Get Radiology Tree app to read full this article<
Get Radiology Tree app to read full this article<
CTA protocols
Get Radiology Tree app to read full this article<
Get Radiology Tree app to read full this article<
Tdelay=Tarrive+Tpeak−1/2Tacquisition, T
delay
=
T
arrive
+
T
peak
−
1
/
2
T
acquisition
,
where T arrive and T peak are the arterial arrival time and the time-to-peak enhancement of the test injection, respectively, and T acquisition is the data acquisition time for CTA. The monitoring level of the test injection was set in the central level of the scan range. We subtracted 1/2 T acquisition from T arrive + T peak for the determination of the delay time. The schematic for protocol 1 is presented in Figure 2 . In protocol 2, we adopted a fixed contrast injection duration (20 seconds) because a fixed injection duration provides constant arterial enhancement regardless of patient weight and injection rate and it is widely used in clinical practice . The scanning delay was determined with a real-time bolus tracking system. The monitoring level was set in the top of the scan range based on the previous clinical studies ( Fig 1 ). The trigger threshold was set at 200 Hounsfield units (HU) for the arterial ROI.

Get Radiology Tree app to read full this article<
Data analysis
Get Radiology Tree app to read full this article<
Patient Study
Get Radiology Tree app to read full this article<
Get Radiology Tree app to read full this article<
Results
Phantom Study
Get Radiology Tree app to read full this article<
Get Radiology Tree app to read full this article<
![Figure 4, Bland-Altman plots illustrating the relationship between differences and averages of protocols 1 and 2 at the pump flow rate of 2.0 L/minute (a) and 5.0 L/minute (b) . The solid line indicates the mean difference between the two protocols. The dashed lines show the 95% limits of agreement interval (mean ± 1.96 standard deviation [SD]). P1, protocol 1; P2, protocol 2; HU, Hounsfield units.](https://storage.googleapis.com/dl.dentistrykey.com/clinical/UniformVascularEnhancementofLowerExtremityArteryonCTAngiographyUsingTestInjectionMonitoringattheCentralLeveloftheScanRange/3_1s20S1076633210001856.jpg)
Get Radiology Tree app to read full this article<
Patient Study
Get Radiology Tree app to read full this article<
Table 1
Attenuation Values from the Abdominal Aorta to the Lower-extremity Artery in our Patient Study ( n = 16)
Arterial Segment Mean (HU) Range (HU) Abdominal aorta 313.9 (54.8) 249–436 Aortic bifurcation 329.1 (48.9) 281–433 Femoral artery 347.9 (49.5) 291–448 Popliteal artery 354.9 (68.3) 235–467 Posterior tibial artery 318.6 (60.5) 204–441 Average 32.6 (51.9) 274–430
HU, Hounsfield units.
Numbers in parentheses indicate standard deviation.
Get Radiology Tree app to read full this article<
Get Radiology Tree app to read full this article<
Discussion
Get Radiology Tree app to read full this article<
Get Radiology Tree app to read full this article<
Get Radiology Tree app to read full this article<
Get Radiology Tree app to read full this article<
Get Radiology Tree app to read full this article<
Get Radiology Tree app to read full this article<
References
1. Met R., Bipat S., Legemate D.A., et. al.: Diagnostic performance of computed tomography angiography in peripheral arterial disease: a systematic review and meta-analysis. JAMA 2009; 301: pp. 415-424.
2. Edwards A.J., Wells I.P., Roobottom C.A.: Multidetector row CT angiography of the lower limb arteries: a prospective comparison of volume-rendered techniques and intra-arterial digital subtraction angiography. Clin Radiol 2005; 60: pp. 85-95.
3. Willmann J.K., Baumert B., Schertler T., et. al.: Aortoiliac and lower extremity arteries assessed with 16-detector row CT angiography: prospective comparison with digital subtraction angiography. Radiology 2005; 236: pp. 1083-1093.
4. Fleischmann D., Rubin G.D.: Quantification of intravenously administered contrast medium transit through the peripheral arteries: implications for CT angiography. Radiology 2005; 236: pp. 1076-1082.
5. Nakaya Y., Kim T., Hori M., et. al.: 64-slice multidetector row computed tomographic angiography of aortoiliac and lower extremity arteries: efficacy of test injection using a monitoring scan at knee level. J Comput Assist Tomogr 2009; 33: pp. 20-25.
6. Bae K.T., Heiken J.P., Brink J.A.: Aortic and hepatic peak enhancement at CT: effect of contrast medium injection rate—pharmacokinetic analysis and experimental porcine model. Radiology 1998; 206: pp. 455-464.
7. Bae K.T.: Peak contrast enhancement in CT and MR angiography: when does it occur and why? Pharmacokinetic study in a porcine model. Radiology 2003; 227: pp. 809-816.
8. Awai K., Hatcho A., Nakayama Y., et. al.: Simulation of aortic peak enhancement on MDCT using a contrast material flow phantom: feasibility study. AJR Am J Roentgenol 2006; 186: pp. 379-385.
9. Awai K., Hiraishi K., Hori S.: Effect of contrast material injection duration and rate on aortic peak time and peak enhancement at dynamic CT involving injection protocol with dose tailored to patient weight. Radiology 2004; 230: pp. 142-150.
10. Fleischmann D., Hallett R.L., Rubin G.D.: CT angiography of peripheral arterial disease. J Vasc Interv Radiol 2006; 17: pp. 3-26.
11. Paraskevas K.I., Giannoukas A.D., Mikhailidis D.P.: Renal function impairment in peripheral arterial disease: an important parameter that should not be neglected. Ann Vasc Surg 2009; 23: pp. 690-699.