
Rationale and Objectives
Renal medullary hypoxia is frequently implicated in renal dysfunction, and urinary oxygen tension (PO 2 ) in the renal pelvis can be used as a surrogate for the adjacent renal medullary oxygenation. We sought to assess the feasibility of magnetic resonance (MR) quantification of urinary PO 2 in humans.
Materials and Methods
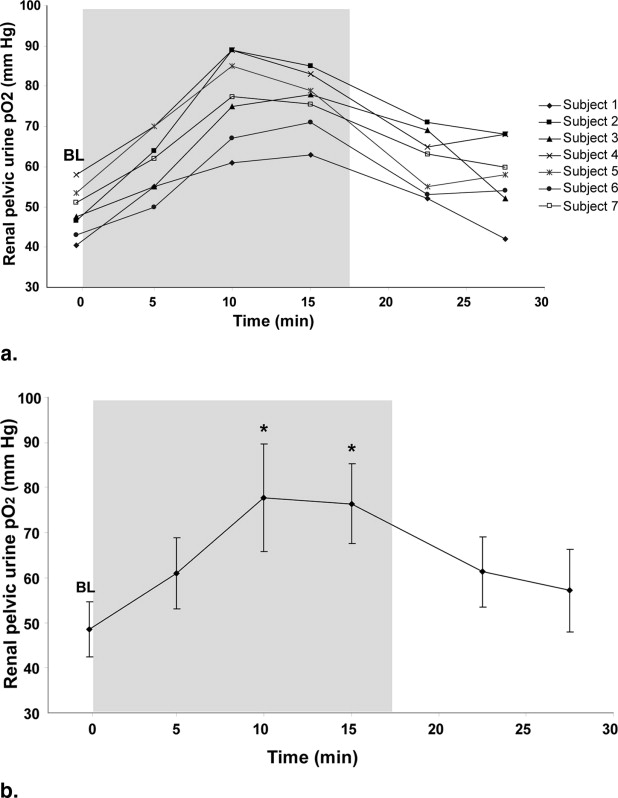
The longitudinal relaxivity (R1) of fluids is linearly related to PO 2 , allowing MR quantification of urinary PO 2 . We imaged urine phantoms with a range of PO 2 using a real-time saturation recovery T2-prepped single-shot fast spin-echo sequence to calibrate urine R1 values to PO 2 . Following institutional review board approval, we imaged the urinary bladders of seven healthy subjects while they were breathing room air and the renal pelvis of nine healthy subjects while they were breathing room air or 100% oxygen via facemask. The renal pelvic urine PO 2 was compared before, during, and after 100% oxygen breathing.
Results
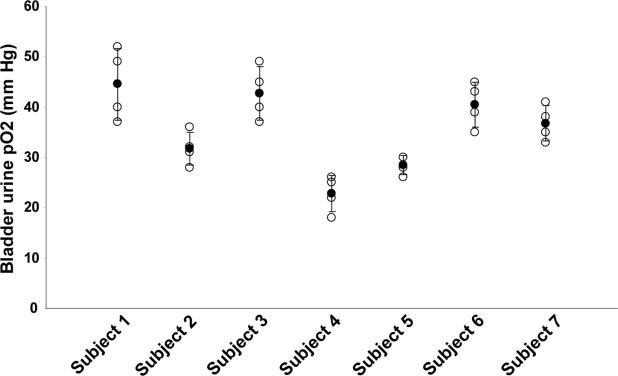
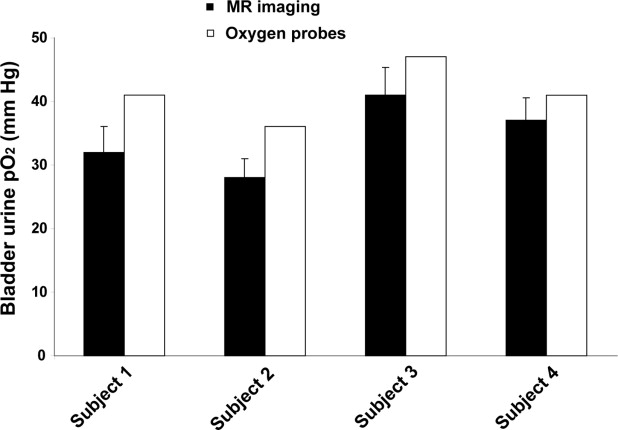
Our phantom study confirmed that urine R1 is linearly related to PO 2 : PO 2 (mm Hg) = (R1 − 0.2253 s −1 )/(2.61 e −4 s −1 /mm Hg). The mean bladder urine PO 2 ranged from 23 to 45 mm Hg among the seven subjects. Successful MR measurements of renal pelvic urine PO 2 were obtained in seven of nine healthy subjects. Following 100% O 2 breathing, the renal pelvic urine PO 2 showed a significant mean increase of 29 mm Hg ( P < .05).
Conclusions
We show that MR quantification of urinary PO 2 is feasible. Noninvasive renal pelvic urine PO 2 determinations could serve as a valuable indirect measure for renal medullary oxygenation, allowing for clinical investigations of the role of renal medullary hypoxia in renal disease.
The oxygen tension in the renal medulla is among the lowest in the human body due to low medullary perfusion and the large amount of oxygen required for sodium reabsorption and urinary concentration ( ). This low oxygen environment places the medulla at risk for ischemic injury, which is associated with numerous common renal diseases, including acute tubular necrosis, diabetic nephropathy, and drug- or contrast-induced nephropathy ( ). Previous studies have shown that measurements of urine oxygen tension (PO 2 ) in the renal pelvis is a sensitive surrogate measure of the oxygenation of the immediately adjacent renal medulla ( ). As urine flows through the tubules of the medullary thick ascending limb into the renal pelvis, the urine PO 2 equilibrates with the medullary PO 2 , which in turn reflects medullary perfusion and oxygen consumption ( ).
Urine PO 2 can change in response to a variety of physiologic and pathologic stimuli. For example, when healthy subjects breathe supplemental oxygen, their urine PO 2 increases, likely due to the increased dissolved oxygen in the blood supplying the medulla ( ). In patients with renal failure and loss of urine-concentrating ability, the urine PO 2 increases and this change is believed to reflect the reduced medullary metabolic function in such patients ( ). Urine PO 2 has also been shown to decrease progressively down the ureter into the bladder due to equilibration with the ureteral wall ( ). Therefore, the renal pelvic urine PO 2 most accurately reflects the renal medullary PO 2 ( ).
Get Radiology Tree app to read full this article<
Get Radiology Tree app to read full this article<
Materials and methods
Get Radiology Tree app to read full this article<
MR Imaging
Get Radiology Tree app to read full this article<

Get Radiology Tree app to read full this article<
Phantom Studies
Get Radiology Tree app to read full this article<
Human Studies
Get Radiology Tree app to read full this article<
Bladder urine
Get Radiology Tree app to read full this article<
Renal pelvic urine
Get Radiology Tree app to read full this article<
Image Analysis
Get Radiology Tree app to read full this article<
Statistical Analysis
Get Radiology Tree app to read full this article<
Results
Get Radiology Tree app to read full this article<
![Figure 2, Plot of longitudinal relaxivity (R1) (1/s) for urine samples at body temperature (37° C) and 1.5 T. The slope (ΔR1/Δ PO 2 ) and intercept [R1(PO 2 = 0)] were used to calibrate the in vivo urine measurements.](https://storage.googleapis.com/dl.dentistrykey.com/clinical/UrinaryOxygenTensionMeasurementinHumansUsingMagneticResonanceImaging/1_1s20S1076633208002523.jpg)
Get Radiology Tree app to read full this article<
Get Radiology Tree app to read full this article<
Get Radiology Tree app to read full this article<
Get Radiology Tree app to read full this article<

Get Radiology Tree app to read full this article<
Discussion
Get Radiology Tree app to read full this article<
Get Radiology Tree app to read full this article<
Get Radiology Tree app to read full this article<
Get Radiology Tree app to read full this article<
Get Radiology Tree app to read full this article<
Get Radiology Tree app to read full this article<
Get Radiology Tree app to read full this article<
References
1. Chou S.Y., Porush J.G., Faubert P.F.: Renal medullary circulation: Hormonal control. Kidney Int 1990; 37: pp. 1-13.
2. Brezis M., Rosen S.: Hypoxia of the renal medulla—Its implications for disease. N Engl J Med 1995; 332: pp. 647-655.
3. Heyman S.N., Reichman J., Brezis M.: Pathophysiology of radiocontrast nephropathy: A role for medullary hypoxia. Invest Radiol 1999; 34: pp. 685-691.
4. Leonhardt K.O., Landes R.R.: Oxygen tension of the urine and renal structures: Preliminary report of clinical findings. N Engl J Med 1963; 269: pp. 115-121.
5. Rennie D.W., Reeves R.B., Pappenheimer J.R.: Oxygen pressure in urine and its relation to intrarenal blood flow. Am J Physiol 1958; 195: pp. 120-132.
6. Stafford-Smith M., Grocott H.P.: Renal medullary hypoxia during experimental cardiopulmonary bypass: A pilot study. Perfusion 2005; 20: pp. 53-58.
7. Landes R.R., Leonhardt K.O., Duruman N.: A clinical study of the oxygen tension of the urine and renal structures. J Urol 1964; 92: pp. 171-178.
8. Levy M.N., Imperial E.S.: Oxygen shunting in renal cortical and medullary capillaries. Am J Physiol 1961; 200: pp. 159-162.
9. Leonhardt K.O., Landes R.R., McCauley R.T.: Anatomy and physiology of intrarenal oxygen tension: Preliminary study of the effects of anesthetics. Anesthesiology 1965; 26: pp. 648-658.
10. Giannakopoulos X., Evangelou A., Kalfakakou V., Grammeniatis E., Papandropoulos I., Charalambopoulos K.: Human bladder urine oxygen content: implications for urinary tract diseases. Int Urol Nephrol 1997; 29: pp. 393-401.
11. Leonhardt K.O., Landes R.R.: Urinary oxygen pressure in renal parenchymal and vascular disease: Effects of breathing oxygen. JAMA 1965; 194: pp. 345-350.
12. Tolley P.M., Purcell A., Bolsin S.N.: Effect of i.v. furosemide on pelvic urinary oxygen tension in humans. Br J Anaesth 1999; 83: pp. 328-329.
13. Chiarotti G., Cristiani G., Giulotto L.: Proton relaxation in pure liquids and in liquids containing paramagnetic gases in solution. Nuovo Cimento 1955; 1: pp. 863-872.
14. Hopkins A.L., Yeung H.N., Bratton C.B.: Multiple field strength in vivo T1 and T2 for cerebrospinal fluid protons. Magn Reson Med 1986; 3: pp. 303-311.
15. Deliganis A.V., Fisher D.J., Lam A.M., Maravilla K.R.: Cerebrospinal fluid signal intensity increase on FLAIR MR images in patients under general anesthesia: The role of supplemental O2. Radiology 2001; 218: pp. 152-156.
16. Zaharchuk G., Busse R.F., Rosenthal G., Manley G.T., Glenn O.A., Dillon W.P.: Noninvasive oxygen partial pressure measurement of human body fluids in vivo using magnetic resonance imaging. Acad Radiol 2006; 13: pp. 1016-1024.
17. Brittain J.H., Hu B.S., Wright G.A., Meyer C.H., Macovski A., Nishimura D.G.: Coronary angiography with magnetization-prepared T2 contrast. Magn Reson Med 1995; 33: pp. 689-696.
18. Trick G.L., Edwards P., Desai U., Berkowitz B.A.: Early supernormal retinal oxygenation response in patients with diabetes. Invest Ophthalmol Vis Sci 2006; 47: pp. 1612-1619.
19. Morelli A., Rocco M., Conti G., et. al.: Monitoring renal oxygen supply in critically-ill patients using urinary oxygen tension. Anesth Analg 2003; 97: pp. 1764-1768.
20. Kainuma M., Yamada M., Miyake T.: Continuous urine oxygen tension monitoring in patients undergoing cardiac surgery. J Cardiothorac Vasc Anesth 1996; 10: pp. 603-608.
21. Prasad P.V., Edelman R.R., Epstein F.H.: Noninvasive evaluation of intrarenal oxygenation with BOLD MRI. Circulation 1996; 94: pp. 3271-3275.
22. Prasad P.V., Epstein F.H.: Changes in renal medullary P o 2 during water diuresis as evaluated by blood oxygenation level-dependent magnetic resonance imaging: effects of aging and cyclooxygenase inhibition. Kidney Int 1999; 55: pp. 294-298.
23. Sadowski E.A., Fain S.B., Alford S.K., et. al.: Assessment of acute renal transplant rejection with blood oxygen level-dependent MR imaging: initial experience. Radiology 2005; 236: pp. 911-919.