
Rationale and Objectives
The increasing use of computed tomography (CT) has been accompanied by rising concerns over potential radiation-related health risks, especially cancer, and a need to minimize such risks.
Materials and Methods
We conducted 2186 low-dose helical chest CT scans among 1235 nuclear weapons workers at elevated risk of lung cancer, setting the CT scanner tube current at 30 mAs for all participants with BMI <35 kg/m 2 and permitting technologists to raise mAs levels for participants with BMI ≥35 kg/m 2 . Dose-length product (DLP) was recorded from the CT scanner, permitting calculation of effective dose. Phantom-based estimates of effective dose were also made. A chest radiologist recorded acceptability of image quality.
Results
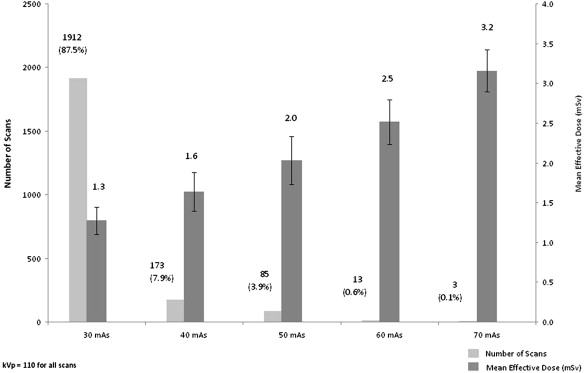
The study population was significantly overweight: 79% exceeded a body mass index (BMI) >25 kg/m 2 and 37.1% exceeded a BMI ≥30 kg/m 2 . Nearly 90% of CT scans were performed using a tube current setting of 30 mAs and had a mean DLP-based effective dose of 1.3 mSv. The phantom-based estimate of effective dose was lower at 1.1 mSv. Among participants with a BMI ≥35 kg/m 2 , 92% were scanned at 40 or 50 mAs, which was associated with a DLP-based effective dose of 1.6 and 2.0 mSv, respectively. Image quality was satisfactory in 99.8% of scans.
Conclusion
Application of simple BMI-based guidelines and DLP tracking of low-dose helical chest CT scans in a lung cancer screening program minimizes radiation dose, even in a largely overweight population.
The use of computed tomography (CT) has increased sharply in the past two decades . Rapid technological advancements in CT scanner technology have led to shorter acquisition times, more user-friendly handling, and the ability to reconstruct high quality three-dimensional images of internal body structures.
Concomitantly, rising concern over potential radiation-related cancer risk has made the frequency and circumstances of CT scanner use the focus of a larger public health debate . Recent studies have described incidents of grossly excessive and variable radiation exposure associated with the use of diagnostic CT scans . Other studies have provided estimates of excess cancer deaths after CT scans .
Get Radiology Tree app to read full this article<
Get Radiology Tree app to read full this article<
Methods
Get Radiology Tree app to read full this article<
Get Radiology Tree app to read full this article<
Get Radiology Tree app to read full this article<
Get Radiology Tree app to read full this article<
Get Radiology Tree app to read full this article<
Get Radiology Tree app to read full this article<
Results
Get Radiology Tree app to read full this article<
Table 1
Age, Weight, Body Mass Index, Dose Length Product, and Effective Dose Associated with Low-dose CT Scans (May 15, 2009–March 31, 2010)
Female ( n = 423) Male ( n = 1763) All ( n = 2186) Mean age (y) 62.7 65.2 64.7 Mean weight (lb) 168.5 203.9 197.0 Mean and range of body mass index (kg/m 2 ) 28.7 (16.1–50.1) 28.9 (16.2–55.2) 28.9 (16.1–55.2) Mean and range of dose-length product (mGy-cm) 89.3 (60–173) 97.3 (56–247) 95.7 (56–247) Mean effective dose (mSv) 1.2 1.4 1.3
Get Radiology Tree app to read full this article<
Get Radiology Tree app to read full this article<
Get Radiology Tree app to read full this article<
Table 2
Computed Tomography Scanner Tube Current Levels Used According to Participant BMI
BMI (kg/m 2 ) Tube Current (mAs) Number of Scans per BMI Category 30 40 50 60 70 <30 1374 (99.9%) 1 (0.1%) 0 0 0 1375 30–34.9 533 (99.6%) 2 (0.4%) 0 0 0 535 ≥35 5 (1.8%) 170 (61.6%) 85 (30.8%) 13 (4.7%) 3 (1.1%) 276 Number (%) of scans at each mAs 1912 (87.5%) 173 (7.9%) 85 (3.9%) 13 (0.6%) 3 (0.1%) 2186 (100%)
BMI, body mass index.
Get Radiology Tree app to read full this article<
Get Radiology Tree app to read full this article<
Get Radiology Tree app to read full this article<
Get Radiology Tree app to read full this article<
Get Radiology Tree app to read full this article<
Get Radiology Tree app to read full this article<
Discussion
Get Radiology Tree app to read full this article<
Get Radiology Tree app to read full this article<
Get Radiology Tree app to read full this article<
Get Radiology Tree app to read full this article<
Get Radiology Tree app to read full this article<
Get Radiology Tree app to read full this article<
Get Radiology Tree app to read full this article<
Get Radiology Tree app to read full this article<
Get Radiology Tree app to read full this article<
Get Radiology Tree app to read full this article<
Get Radiology Tree app to read full this article<
Conclusion
Get Radiology Tree app to read full this article<
Get Radiology Tree app to read full this article<
Acknowledgments
Get Radiology Tree app to read full this article<
Get Radiology Tree app to read full this article<
References
1. IAEA: Dose reduction in CT while maintaining diagnostic confidence: a feasibility/demonstration study.2009.International Atomic Energy AgencyVienna, Austria
2. Mahesh M.: Medical radiation exposure with focus on CT. Rev Environ Health 2010; 25: pp. 69-74.
3. Furlow B.: Radiation dose in computed tomography. Radiol Technol 2010; 81: pp. 437-450.
4. Brenner D.J., Hall E.J.: Computed tomography—an increasing source of radiation exposure. N Engl J Med 2007; 357: pp. 2277-2284.
5. Berrington de Gonzalez A.: Projected cancer risks from computed tomographic scans performed in the United States in 2007. Arch Intern Med 2009; 169: pp. 2071-2077.
6. Huppmann M., William J., Marcia J.: Radiation risks from exposure to chest computed tomography. Semin Ultrasound CT MRI 2010; 31: pp. 14-28.
7. Koller C.J., Eatough J.P., Bettridge A.: Variations in radiation dose between the same model of multislice CT scanner at different hospitals. Br J Radiol 2003; 76: pp. 798-802.
8. Aldrich J.E., Bilawich A.M., Mayo J.R.: Radiation doses to patients receiving computed tomography examinations in British Columbia. Can Assoc Radiol J 2006; 57: pp. 79-85.
9. Kuehn B.M.: FDA warning: CT scans exceeded proper doses. JAMA 2010; 303: pp. 124.
10. Golding S.J.: Radiation exposure in CT: what is the professionally responsible approach?. Radiology 2010; 255: pp. 683-686.
11. Sone S., Takashima S., Li F., et. al.: Mass screening for lung cancer with mobile spiral computed tomography scanner. Lancet 1998; 351: pp. 1242-1245.
12. Henschke C.I., McCauley D.I., Yankelevitz D.F., et. al.: Early Lung Cancer Action Project: overall design and findings from baseline screening. Lancet 1999; 354: pp. 99-105.
13. Smith-Bindman R., Lipson J., Marcus R., et. al.: Radiation dose associated with common computed tomography examinations and the associated lifetime attributable risk of cancer. Arch Intern Med 2009; 169: pp. 2078-2086.
14. Aberle D.R., Berg C.D., Black W.C., et. al.: National Lung Screening Trial Research Team. The National Lung Screening Trial: overview and study design. Radiology 2011; 258: pp. 243-253.
15. Brenner D.J.: Radiation risks potentially associated with low-dose CT screening of adult smokers for lung cancer. Radiology 2004; 231: pp. 440-445.
16. Buls N., de Mey J., Covens P., et. al.: Health screening with CT: prospective assessment of radiation dose and associated detriment. JBR-BTR 2005; 88: pp. 12-16.
17. Markowitz S.B., Miller A., Miller J., et. al.: Ability of low-dose helical CT to distinguish between benign and malignant noncalcified lung nodules. Chest 2007; 131: pp. 1028-1034.
18. Henschke C. International Early Lung Cancer Action Program: enrollment and screening protocol. http://www.ielcap.org/professionals/docs/ielcap.pdf . Accessed July 1, 2010.
19. AAPM - American Association of Physicists in Medicine. The measurement, reporting and management of radiation dose in CT. Report No. 96 of AAPM Task Group 23, 2008. http://www.aapm.org/pubs/reports/RPT_96.pdf .
20. Shrimpton P. Assessment of patient dose in CT. European guidelines for multislice computed tomography funded by the European Commission 2004: contract number FIGMCT2000-20078-CTTIP. Luxembourg, Luxembourg: European Commission, 2004: Appendix C.
21. NHLBI Obesity Task Force: Clinical guidelines on the identification, evaluation, and treatment of overweight and obesity in adults: the evidence report. Obes Res 1998; 6: pp. 51S-209S.
22. Cagnon C.H., Cody D.D., McNitt-Gray M.F., et. al.: Description and implementation of a quality control program in an imaging-based clinical trial. Acad Radiol 2006; 13: pp. 1431-1441.
23. Seeram E., Brennan P.C.: Diagnostic reference levels in radiology. Radiol Technol 2006; 77: pp. 373-384.
24. American College of Radiology. Computed Tomography (CT) Accreditation Phantom Instructions for Dosimetry http://www.acr.org/accreditation/computed/qc_forms/Phantom_Testing_Instruction_Final.aspx . Accessed December 2010.
25. Fayngersh V., Passero M.: Estimating radiation risk from computed tomography scanning. Lung 2009; 187: pp. 143-148.
26. Mahnken A.H., Wildberger J.E., Simon J., et. al.: Detection of coronary calcifications: feasibility of dose reduction with a body weight-adapted examination protocol. AJR Am J Roentgenol 2003; 181: pp. 533-538.
27. Menke J.: Comparison of different body size parameters for individual dose adaptation in body CT of adults. Radiology 2005; 236: pp. 565-571.
28. Das M., Mahnken A.H., Muhlenbruch G., et. al.: Individually adapted examination protocols for reduction of radiation exposure for 16-MDCT chest examinations. AJR Am J Roentgenol 2005; 184: pp. 1437-1443.
29. Yoshimura N., Sabir A., Kubo T., et. al.: Correlation between image noise and body weight in coronary CTA with 16-row MDCT. Acad Radiol 2006; 13: pp. 324-328.
30. Bae K.T., Seeck B.A., Hildebolt C.F., et. al.: Contrast enhancement in cardiovascular MDCT: effect of body weight, height, body surface area, body mass index, and obesity. AJR Am J Roentgenol 2008; 190: pp. 777-784.
31. European Commission: European guidelines on quality criteria for computed tomography, EUR 16262EN.2000.Office for Official Publications of the European CommunitiesLuxembourg http://www.drs.dk/guidelines/ct/quality/htmlindex.htm Accessed December 15, 2010
32. Gierada D.S., Garg K., Nath H., et. al.: CT quality assurance in the lung screening study component of the National Lung Screening Trial: implications for multicenter imaging trials. AJR Am J Roentgenol 2009; 193: pp. 419-424.
33. US Food and Drug Administration. White paper: initiative to reduce unnecessary radiation exposure from medical imaging. http://www.fda.gov/Radiation-EmittingProducts/RadiationSafety/RadiationDoseReduction/ucm199994.htm . Published February 16, 2010. Accessed February 2010.
34. The National Lung Screening Trial Research Team: Reduced lung-cancer mortality with low-dose computed tomographic screening. N Engl J Med 2011; 365: pp. 395-406.