
Rationale and Objectives
Decision support systems have the capacity to improve diagnostic performance and reduce physician errors. The purpose of this study was to evaluate the use of classification and regression trees (CART) with bootstrap aggregation as a decision support system in the baseline plus furosemide (F + 20) diuresis renography protocol to determine when obstruction can be excluded without the furosemide acquisition and to identify the key parameters for making this determination.
Materials and Methods
Patients with suspected ureteral obstruction were randomly assigned to a training set (80 patients, 157 kidneys) and a validation set (64 patients, 124 kidneys). Forty quantitative parameters (curve parameters, MAG3 clearance and voiding indices) were generated from each baseline Tc-99m mercaptoacetyltriglycine (MAG3) scan. Three expert readers independently evaluated each kidney regarding the need for furosemide and resolved differences by majority vote. CART with bootstrap aggregation was applied to the training set to generate prediction algorithms which were tested in the validation set.
Results
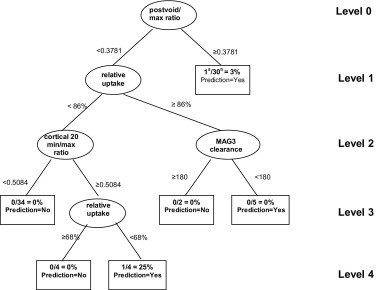
The algorithm agreed with the expert decision on the necessity of furosemide in 90% (111 of 124 kidneys), with misclassification rates of 10.0% and 10.9% for the left and right kidneys, respectively. The most important discriminators were the postvoid-to-maximum count ratio, the cortical 20-minute-to-maximum count ratio, and the postvoid-to-1-to-2-minute count ratio.
Conclusion
CART can identify the key parameters for discriminating between nonobstruction and possible obstruction, has the potential to serve as a decision support tool to avoid unnecessary furosemide imaging, and can be applied to more complex imaging problems.
Decision support systems have the capacity to improve diagnostic performance and reduce physician errors. In particular, decision trees present an attractive way of summarizing expert knowledge for convenient use by nonexperts. Decision trees provide a simple flowchart prescription of a short series of yes/no questions that result in a decision relevant to the scientific question of interest. These ideas have been in use in the social sciences since the 1960s and 1970s ( ). The statistical use of these concepts was developed in 1984 by Breiman et al. ( ), who named the method “classification and regression trees,” now more commonly known by its acronym CART. Although this procedure has wide applicability, it is known to be sensitive to small changes in the data. Recently, a modified version of CART called “bootstrap aggregation” (or “bagging”) was developed; this new approach has been reported to stabilize the variability of the standard CART procedure ( ).
In the evaluation of suspected ureteral obstruction, a recent international consensus panel recommended baseline radionuclide imaging with Tc-99m mercaptoacetyltriglycine (MAG3) followed by furosemide administration and an additional 15 minutes of imaging ( ). The authors of the consensus report noted that baseline imaging might be sufficient to exclude obstruction in experienced hands ( ), and some investigators have recommended specific strategies to determine when the furosemide acquisition can be omitted ( ). This approach avoids unnecessary imaging, minimizes patient inconvenience, and reduces costs by saving technologist, camera, computer, and physician time. Nevertheless, selective elimination of the furosemide acquisition was not the general recommendation of the consensus report because physicians performing low volume studies may not have had the training or experience to make this determination with confidence. The purpose of this study was to evaluate the use of CART as a decision support system to determine when furosemide is required to exclude obstruction and to identify the most important kidney parameters for making this determination.
Materials and methods
Study Populations
Get Radiology Tree app to read full this article<
Acquisition Protocol and Data Collection
Get Radiology Tree app to read full this article<
Get Radiology Tree app to read full this article<
Expert Panel Review
Get Radiology Tree app to read full this article<
Standard CART Procedure
Get Radiology Tree app to read full this article<
Get Radiology Tree app to read full this article<
Get Radiology Tree app to read full this article<
CART With Bagging
Get Radiology Tree app to read full this article<
Results
Get Radiology Tree app to read full this article<
Get Radiology Tree app to read full this article<
Table 1
Distribution of misclassification rates for the validation samples
Kidney n Original tree Bootstrapped trees ( k = 1001) Bagging Mean Median SD Min Max Right 64 15.62 15.87 15.63 6.98 4.69 35.94 10.94 Left 60 8.33 11.53 10.00 3.05 6.67 30.00 10.00
n = number of kidneys
k = number of bootstrapped trees
Get Radiology Tree app to read full this article<
Get Radiology Tree app to read full this article<
Get Radiology Tree app to read full this article<
Get Radiology Tree app to read full this article<
Table 2
Number (percent) of bootstrapped trees on the training set containing one or more levels
Level Right kidney Left kidney 1 37 (3.7%) 92 (9.2%) 2 257 (25.7%) 416 (41.6%) 3 448 (44.8%) 377 (37.7%) 4 232 (23.1%) 105 (10.5%) 5 27 (2.7%) 10 (1.0%) 6 0 (0.0%) 1 (0.1%)
Table 3
Most frequent kidney parameters in the training set on level 1
Kidney parameter Frequency Right kidney Left kidney Cortical 20 min/max ratio 32.1% 3.6% Postvoid/max ratio 29.1% 83.0% Postvoid/1-2 min ratio 13.3% 6.3% 19-20 min/max ratio 10.8% 1.0%
Get Radiology Tree app to read full this article<
Discussion
Get Radiology Tree app to read full this article<
Get Radiology Tree app to read full this article<
Get Radiology Tree app to read full this article<
Get Radiology Tree app to read full this article<
Get Radiology Tree app to read full this article<
Conclusion
Get Radiology Tree app to read full this article<
Get Radiology Tree app to read full this article<
References
1. Morgan J.N., Sonquist J.A.: Problems in the analysis of survey data and a proposal. J Am Stat Assoc 1963; 58: pp. 415-434.
2. Morgan J.N., Messenger R.C.: THAID: A Sequential Search Program for the Analysis of Nominal Scale Dependent Variables. Survey Research Center, Institute for Social Research, University of Michigan 1973;
3. Breiman L., Friedman J., Olshen R., Stone C.: 1984.WadsworthBelmont, CA
4. Hastie T., Tibshirani R., Friedman J.: The Elements of Statistical Learning:Data Mining, Inference, and Prediction.2001.SpringerNew York:pp. 246-250.
5. O’Reilly P., Aurell M., Britton K., Kletter K., Rosenthal L., Testa T.: Consensus on diuresis renography for investigating the dilated upper urinary tract. J Nucl Med 1996; 37: pp. 1872-1876.
6. Kuyvenhoven J., Piepsz A., Ham H.: When could the administration of furosemide be avoided?. Clin Nucl Med 2003; 28: pp. 732-737.
7. Taylor A., Corrigan P.L., Galt J., et. al.: Measuring technetium-99m-MAG3 clearance with an improved camera-based method. J Nucl Med 1995; 36: pp. 1689-1695.
8. Taylor A., Manatunga A., Morton K., et. al.: Multicenter trial validation of a camera based method to measure Tc-99m mercaptoacetyltriglycine (MAG3) clearance. Radiology 1997; 204: pp. 47-54.
9. Efron B., Tibshirani R.: 1993.Chapman and HallLondon
10. Comprehensive R Archive Network (CRAN). Available at http://www.r-project.org
11. Venables WN, Ripley BD. Modern Applied Statistics With S-Plus, 3rd ed. New York: Springer Verlag, 200, pp 303-310.
12. Maindonald J., Braun J.: 2003.Cambridge University PressCambridge Chapter 10
13. Piepsz A., Kuyvenhoven J.D., Tondeur M., Ham H.: Normalized residual activity: Usual values and robustness of the method. J Nucl Med 2002; 43: pp. 33-38.
14. Thrall J.H., Ziessman H.A.: 1995.Mosby-Year BookSt Louis p 302
15. Diggle P.J., Heagerty P., Liang K.Y., Zegar S.L.: 2nd ed2002.Oxford University PressOxford