
Successful research results from the combination of multiple elements, including an appropriate research question, study design, research method, statistical analysis, and interpretation of results. One element of research that is easy to overlook is proper data collection and preparation for analysis. If data collection or preparation is inadequately planned or executed, the data may not be analyzable by a statistician without significant effort spent on data cleaning. Even worse, the data may contain problems that can be resolved only through time-consuming revision or repeat data collection. In this review, we present some practical guidelines and best practices for preparing data that can reduce the work of subsequent analysis.
Introduction
onducting successful research involves the formulation of a clear research question, selection of an appropriate study design, selection of proper data collection methods and tools, data collection, data preparation, data analysis, and, finally, thoughtful interpretation of the results . Many books, courses, and articles offer information on study design and statistical analysis , but typically these resources provide little advice about data collection and preparation, which is the actual work that occurs between design and analysis. Without adequate planning for data collection and preparation, a project’s data can easily become overwhelming to the point of obscuring the path to proper analysis. Even worse, the data may develop problems that require time-consuming revision or repeat collection.
Clinical research projects of even minimal complexity can still produce data that require statistical analysis beyond calculating simple means, standard deviations, and t tests. More advanced analysis usually requires involvement of a statistician and dedicated statistical software, such as R (R Foundation for Statistical Computing, Vienna, Austria), Stata (StataCorp, College Station, Texas), SAS (SAS Institute, Cary, North Carolina), and SPSS (IBM Corporation, Armonk, New York). It is most efficient to present data in a form that is directly analyzable by the statistician and an appropriate statistical software package. In times of limited availability, it may be difficult to find a statistician with time to correct a data set’s formatting problems in addition to performing the actual analysis.
In this article, we present some best practices for data collection and preparation by researchers. These practices and pieces of advice are derived from our personal experience in advising many colleagues on statistical analysis for their research projects. In our experience, we have noted common problems and difficulties associated with data collection and preparation. In some cases, these problems have required costly additional time and/or resources to resolve. Fortunately, such problems can usually be prevented by observing some relatively simple practices. We focus on primary data collection by the researcher, but the techniques can be applied to secondary data analysis where the data were collected by someone else or extracted from another source such as an electronic medical record system.
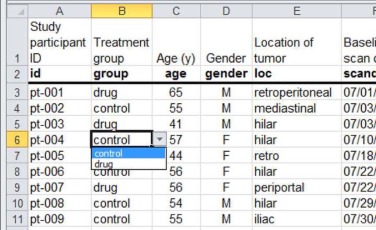
We also draw from what we have learned from teaching several refresher courses on this topic at the annual meeting of the Radiological Society of North America. Since spreadsheets are the most common form in which data are presented to a statistician, we will present some valuable tips for their use. We will draw examples from one particular spreadsheet application, Excel (Microsoft Corporation, Redmond, Washington) because it is the most widely used application of its type and is nearly identical across multiple versions of both the Windows and Macintosh operating systems. However, most of our suggestions are applicable to any spreadsheet program, including open-source applications such as OpenOffice and Google Sheets. Although there are countless books and web resources detailing every feature of Excel, we will concentrate on a few specific essential features that make data collection easier for the clinical radiology researcher.
Preparing to Collect Data
Because of intellectual excitement or time pressures, research projects are often started by delving directly into data collection. But before making the first spreadsheet, there are several important steps that should be taken to avoid unnecessary work and subsequent delays. The first and arguably most important step in data collection is formulating the research question. All research involves answering one or more questions, and these questions should be stated explicitly and prospectively . Defining the research question first is the best way to make sure all pertinent data are collected and that time is not wasted by collecting unnecessary information. One way to ensure that all pertinent data are collected is to identify all the important parameters that may affect the intervention or outcome being studied. Sources of clinical data are often difficult to access even once, so having to go back to collect a missed data element may be impossible. Modern computing technology places no practical limit on the number of data elements that can be collected, so relevance to the research question, not simply availability, should be the determinant of whether a data element should be collected. One must also remember that a statistically significant result still has a small probability of occurring by chance alone. A clear research question and purposeful data collection help to reduce the problem of a statistically significant result being interpreted as occurring only by chance.
Get Radiology Tree app to read full this article<
Get Radiology Tree app to read full this article<
Get Radiology Tree app to read full this article<
Get Radiology Tree app to read full this article<
Get Radiology Tree app to read full this article<
Data Collection Tools
Get Radiology Tree app to read full this article<
Get Radiology Tree app to read full this article<
Get Radiology Tree app to read full this article<
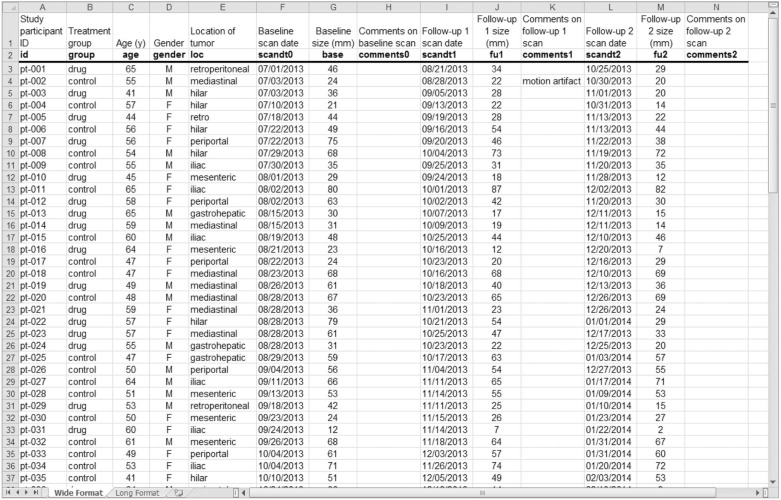
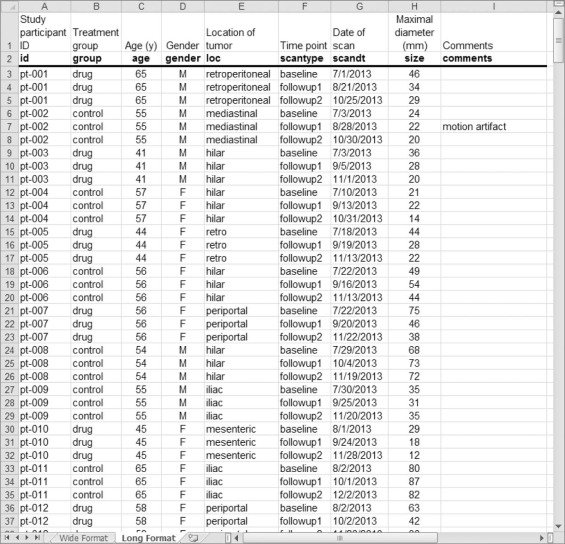
Data Preparation: Proper Spreadsheet Formatting
Get Radiology Tree app to read full this article<
Table 1
Spreadsheet Best Practices and Formatting Tips for Data Collection and Preparation
Get Radiology Tree app to read full this article<
ID, identification, PHI, protected health information.
Get Radiology Tree app to read full this article<
Structure
Get Radiology Tree app to read full this article<
Get Radiology Tree app to read full this article<
Get Radiology Tree app to read full this article<
Labeling
Get Radiology Tree app to read full this article<
Get Radiology Tree app to read full this article<
Consistency
Get Radiology Tree app to read full this article<
Get Radiology Tree app to read full this article<
Numerical data
Get Radiology Tree app to read full this article<
Spreadsheet Functions to Aid Data Preparation
Get Radiology Tree app to read full this article<
Table 2
Summary of Key Features for Data Collection and Preparation Using Microsoft Excel \*
Get Radiology Tree app to read full this article<
Get Radiology Tree app to read full this article<
Get Radiology Tree app to read full this article<
Get Radiology Tree app to read full this article<
Get Radiology Tree app to read full this article<
Get Radiology Tree app to read full this article<
Get Radiology Tree app to read full this article<
Get Radiology Tree app to read full this article<
Get Radiology Tree app to read full this article<
Get Radiology Tree app to read full this article<
Get Radiology Tree app to read full this article<
Get Radiology Tree app to read full this article<
Get Radiology Tree app to read full this article<
Get Radiology Tree app to read full this article<
Freeze panes
Get Radiology Tree app to read full this article<
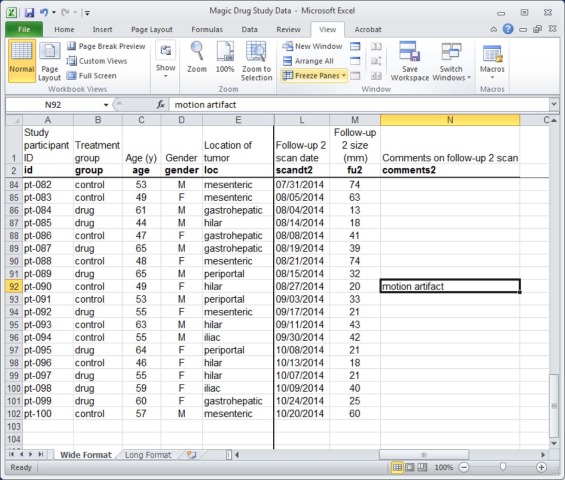
Get Radiology Tree app to read full this article<
Hide and unhide
Get Radiology Tree app to read full this article<
Filter
Get Radiology Tree app to read full this article<
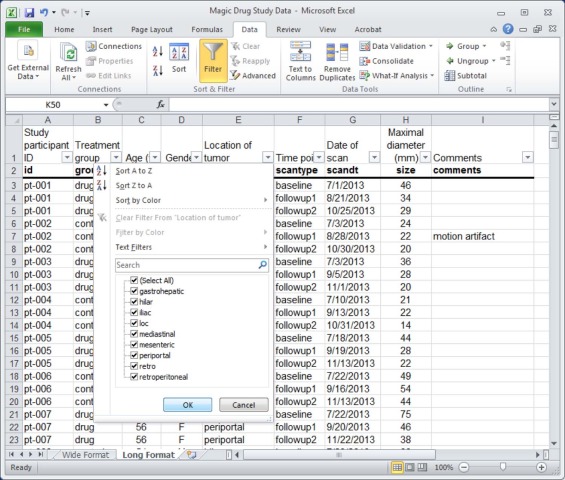
Get Radiology Tree app to read full this article<
Find/Replace
Get Radiology Tree app to read full this article<
Validation
Get Radiology Tree app to read full this article<
Get Radiology Tree app to read full this article<
Discussion
Get Radiology Tree app to read full this article<
Get Radiology Tree app to read full this article<
Acknowledgment
Get Radiology Tree app to read full this article<
Get Radiology Tree app to read full this article<
References
1. Crewson P.E., Applegate K.E.: Data collection in radiology research. AJR Am J Roentgenol 2001; 177: pp. 755-761.
2. Hulley S., Newman T., Cumming S.: Getting started: the anatomy and physiology of clinical research.Hulley S.Cummings S.Browner W. et. al.Designing clinical research.2013.Lippincott Williams & WilkinsPhiladelphia:pp. 2-11.
3. Beam C., Blackmore C., Karlik S., et. al.: Fundamentals of clinical research for radiologists: editors’ introduction to the series. AJR Am J Roentgenol 2001; 176: pp. 323-325.
4. Eng J.: Getting started in radiology research: asking the right question and identifying an appropriate study population. Academic Radiology 2004; 11: pp. 149-154.
5. Parfrey P., Ravani P.: On framing the research question and choosing the appropriate research design. Methods Mol Biol (Clifton, NJ) 2009; 473: pp. 1-17.
6. Bodemer N., Ruggeri A.: Finding a good research question, in theory. Science 2012; 335: pp. 1439.
7. Fetzer D.T., West O.C.: The HIPAA privacy rule and protected health information: implications in research involving DICOM image databases. Acad Radiol 2008; 15: pp. 390-395.
8. Wilcox A.B., Gallagher K.D., Boden-Albala B., et. al.: Research data collection methods: from paper to tablet computers. Med Care 2012; 50: pp. S68-S73.
9. Wahi M.M., Parks D.V., Skeate R.C., et. al.: Reducing errors from the electronic transcription of data collected on paper forms: a research data case study. J Am Med Inform Assoc 2008; 15: pp. 386-389.
10. Pavlovic I., Kern T., Miklavcic D.: Comparison of paper-based and electronic data collection process in clinical trials: costs simulation study. Contemp Clin Trials 2009; 30: pp. 300-316.
11. Kupzyk K.A., Cohen M.Z.: Data validation and other strategies for data entry. West J Nurs Res 2014;
12. Paul J., Seib R., Prescott T.: The Internet and clinical trials: background, online resources, examples and issues. J Med Internet Res 2005; 7: pp. e5.
13. Rangel S.J., Narasimhan B., Geraghty N., et. al.: Development of an internet-based protocol to facilitate randomized clinical trials in pediatric surgery. J Pediatr Surg 2002; 37: pp. 990-994. discussion -4
14. Marks R., Bristol H., Conlon M., et. al.: Enhancing clinical trials on the internet: lessons from INVEST. Clin Cardiol 2001; 24: pp. V17-V23.
15. Lallas C.D., Preminger G.M., Pearle M.S., et. al.: Internet based multi-institutional clinical research: a convenient and secure option. J Urol 2004; 171: pp. 1880-1885.
16. Harris P.A., Taylor R., Thielke R., et. al.: Research electronic data capture (REDCap)—a metadata-driven methodology and workflow process for providing translational research informatics support. J Biomed Inform 2009; 42: pp. 377-381.
17. Kandel S., Heer J., Plaisant C., et. al.: Research directions in data wrangling: visualizations and transformations for usable and credible data. Inform Visual 2011; 10: pp. 271-288.
18. Nash J.C.: Spreadsheets in statistical practice—another look. Am Stat 2006; 60: pp. 287-289.