
Rationale and Objectives
Acoustic radiation force impulse imaging (ARFI) is a newly developed technique for the evaluation of tissue stiffness. It has been applied to evaluate liver fibrosis, but only limited data for liver lesions are available. The aim of this study was to evaluate the tissue stiffness of liver lesions by using ARFI to differentiate benign from malignant liver lesions.
Materials and Methods
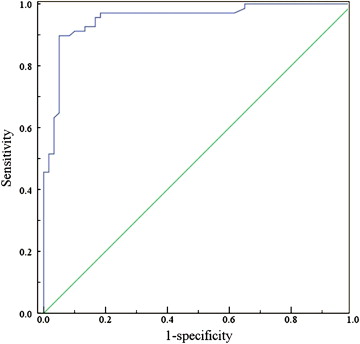
ARFI was performed in 116 consecutive patients who had 128 liver lesions (60 benign, 68 malignant). The elastographic images of virtual touch tissue imaging (VTI) and the values of virtual touch tissue quantification (VTQ) were obtained and analyzed. The area under the curve and cutoff value for VTQ value, both of which were obtained by using a receiver operating characteristic curve analysis, were used to assess diagnostic performance.
Results
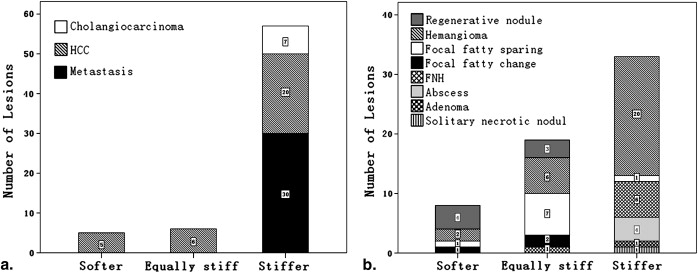
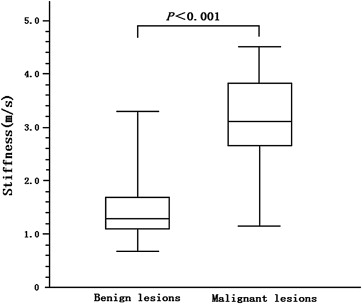
On the elastographic images of VTI, 57 (83.8%) malignant liver lesions and 33 (55.0%) benign liver lesions appeared stiffer compared with the surrounding liver parenchyma. There were statistical differences between malignant and benign liver lesions ( P < .05). The VTQ median value of malignant and benign liver lesions were 3.14 m/sec (average value 3.16 ± 0.80 m/sec, range 1.17‒4.45 m/sec) and 1.35 m/sec (average value 1.47 ± 0.53 m/sec, range 0.74‒3.26 m/sec), respectively ( P < .001). With a cutoff value of 2.22 m/sec for VTQ value, the sensitivity, specificity, and accuracy for malignancy were 89.7%, 95.0%, and 92.2%, respectively.
Conclusions
ARFI can provide the elastographic images and elastographic values of liver lesions by VTI and VTQ, which is helpful in the differentiation between benign and malignant liver lesions and might become the imaging modality of the future.
Since Ophir et al first used the term “elastography” to describe the method of quantitative imaging of the distribution of biological tissue strains and elastic modulus in 1991, it has obtained wide attention and been developed for potential clinical imaging modalities. Unlike conventional B-mode ultrasonography, which shows the diversity of anatomical structure organization according to the acoustic impedance difference of tissue, elastography can get the relative information such as tissue deformation and elastic modulus through the displacements of a small strain on tissue. It is now widely used in ultrasound (US) diagnosis of diseases of superficial parts such as breast , prostate , thyroid , and neck vessels . Clinical practice confirms that elastography is helpful in identification of benign and malignant solid tumors of superficial organs, evaluation of physical properties of intravascular plaque and diagnosis of tendon disease .
Because of rib obstruct and high-frequency probe cause, elastography in the diagnosis of liver disease is limited. Many studies in the liver diseases field are focusing on some liver tumors located in the wall or nearby gastrointestinal tract, which can be visualized and characterized by endoscopic US elastography and intraoperative US elastography . Acoustic radiation force impulse imaging (ARFI) is a new US elastographic imaging methods. Unlike the traditional compression elastography, a short-duration (0.03–0.4 ms), high-intensity acoustic “pushing pulse” (frequency 2.67 MHz) in ARFI imaging is transmitted to generate a internal tissue excitation (1–20 μm) in the region of interest (ROI) by the transducer, and followed by a series of diagnostic intensity pulses (frequency 3.08 MHz, pulse repetition frequency 3–12 KHz), which are used to track the displacement of the tissue caused by the pushing pulse. It is possible to display the quantitative shear wave velocity of ARFI displacement. Because the velocity of the shear wave depends on the tissue stiffness, it is possible to apply ARFI technology to evaluate the deep tissue stiffness.
Get Radiology Tree app to read full this article<
Materials and methods
Subjects
Get Radiology Tree app to read full this article<
Get Radiology Tree app to read full this article<
Table 1
Final Pathologic and Clinical Imaging Results of Liver Lesions
Pathology Number of lesions Malignant liver lesions 68 (53.1%) Hepatocellular carcinoma 31 (24.2%) Liver metastasis 30 (23.4%) Cholangiocarcinoma 7 (5.5%) Benign liver lesions 60 (46.9%) Hemangioma 28 (21.9%) Focal nodular hyperplasia 7 (5.5%) Regenerative nodule 7 (5.5%) Focal fatty sparing 9 (7.0%) Focal fatty change 3 (2.3%) Liver Abscess 4 (3.1%) Liver Adenoma 1 (0.8%) Solitary necrotic nodule 1 (0.8%)
Get Radiology Tree app to read full this article<
ARFI Technique
Get Radiology Tree app to read full this article<
VTI
Get Radiology Tree app to read full this article<
VTQ
Get Radiology Tree app to read full this article<
Get Radiology Tree app to read full this article<
Statistical Analysis
Get Radiology Tree app to read full this article<
Results
VTI Technique
Get Radiology Tree app to read full this article<
Get Radiology Tree app to read full this article<
VTQ Technique
Get Radiology Tree app to read full this article<
Get Radiology Tree app to read full this article<
Discussion
Get Radiology Tree app to read full this article<
Get Radiology Tree app to read full this article<
Get Radiology Tree app to read full this article<
Get Radiology Tree app to read full this article<
Get Radiology Tree app to read full this article<
Get Radiology Tree app to read full this article<
Get Radiology Tree app to read full this article<
Get Radiology Tree app to read full this article<
References
1. Ophir J., Cespedes I., Ponnekanti H., et. al.: Elastography: a quantitative method for imaging the elasticity of biological tissues. Ultrason Imaging 1991; 13: pp. 111-134.
2. Garra B.S., Cespedes E.I., Ophir J., et. al.: Elastography of breast lesions: initial clinical results. Radiology 1997; 202: pp. 79-86.
3. Lorenz A., Sommerfeld H.J., Garcia-Schurmann M., et. al.: A new system for the acquisition of ultrasonic multicompression strain images of the human prostate in vivo. IEEE Trans Ultrason Ferroelectr Freq Control 1999; 46: pp. 1147-1154.
4. Bae U., Dighe M., Dubinsky T., et. al.: Ultrasound thyroid elastography using carotid artery pulsation: preliminary study. J Ultrasound Med 2007; 26: pp. 797-805.
5. De Korte C.L., Pasterkamp G., van der Steen A.F.W., et. al.: Characterization of plaque components with intravascular ultrasound elastography in human femoral and coronary arteries in vitro. Circulation 2000; 102: pp. 617-623.
6. Drakonaki E.E., Allen G.M., Wilson D.J.: Real-time ultrasound elastography of the normal Achilles tendon: reproducibility and pattern description. Clin Radiol 2009; 64: pp. 1196-1202.
7. De Zordo T., Lill S.R., Fink C., et. al.: Real-time sonoelastography of lateral epicondylitis: comparison of findings between patients and healthy volunteers. AJR Am J Roentgenol 2009; 193: pp. 180-185.
8. De Zordo T., Fink C., Feuchtner G.M., et. al.: Real-time sonoelastography findings in healthy Achilles tendons. AJR Am J Roentgenol 2009; 193: pp. W134-W138.
9. Gheorghe L., Iacob S., Gheorghe C., et. al.: Ecoendoscopic elastography for the diagnosis of hepatocellular carcinoma in small cirrhotic nodules. Arch Balkan Med Union 2007; 42: pp. 186-188.
10. Rustemovic N., Hrstic I., Opacic M., et. al.: EUS elastography in the diagnosis of focal liver lesions. Gastrointest Endosc 2007; 66: pp. 823-824.
11. Inoue Y., Takahashi M., Arita J., et. al.: Intra-operative freehand real-time elastography for small focal liver lesions: “visual palpation” for non-palpable tumors. Surgery 2010; 148: pp. 1000-1011.
12. Kato K., Sugimoto H., Kanazumi N., et. al.: Intra-operative application of real-time tissue elastography for the diagnosis of liver tumours. Liver Int 2008; 28: pp. 1264-1271.
13. Takahashi H., Ono N., Eguchi Y., et. al.: Evaluation of acoustic radiation force impulse elastography for fibrosis staging of chronic liver disease: a pilot study. Liver Int 2010; 30: pp. 538-545.
14. Goertz R.S., Zopf Y., Jugl V., et. al.: Measurement of liver elasticity with acoustic radiation force impulse (ARFI) technology: an alternative noninvasive method for staging liver fibrosis in viral hepatitis. Ultraschall Med 2010; 31: pp. 151-155.
15. Fierbinteanu-Braticevici C., Andronescu D., Usvat R., et. al.: Acoustic radiation force imaging sonoelastography for noninvasive staging of liver fibrosis. World J Gastroenterol 2009; 15: pp. 5525-5532.
16. Friedrich-Rust M., Wunder K., Kriener S., et. al.: Liver fibrosis in viral hepatitis: noninvasive assessment with acoustic radiation force impulse imaging versus transient elastography. Radiology 2009; 252: pp. 595-604.
17. Fahey B.J., Nelson R.C., Bradway D.P., et. al.: In vivo visualization of abdominal malignancies with acoustic radiation force elastography. Phys Med Biol 2008; 53: pp. 279-293.
18. Cho S.H., Lee J.Y., Han J.K., et. al.: Acoustic radiation force impulse elastography for the evaluation of focal solid hepatic lesions: preliminary findings. Ultrasound Med Biol 2010; 36: pp. 202-208.
19. Yoo H.Y., Patt C.H., Geschwind J.F., et. al.: The outcome of liver transplantation in patients with hepatocellular carcinoma in the United States between 1988 and 2001:5-year survival has improved significantly with time. J CIin Oncol 2003; 21: 4329-4235
20. Bolondi L., Gaiani S., Celli N., et. al.: Characterization of small nodules in cirrhosis by assessment of vascularity: the problem of hypovascular hepatocellular carcinoma. Hepatology 2005; 42: pp. 27-34.
21. Kojiro M.: Focus on dysplastic nodules and early hepatocellular carcinoma: an Eastern point of view. Liver Transpl 2004; 10: pp. S3-S8.