
Rationale and Objectives
To prospectively evaluate perfusion computed tomography (CT) for assessment of changes in tumor vascularity after chemoradiation therapy (CRT) in locally advanced rectal cancer and to analyze the correlation between baseline perfusion parameters and tumor response.
Materials and Methods
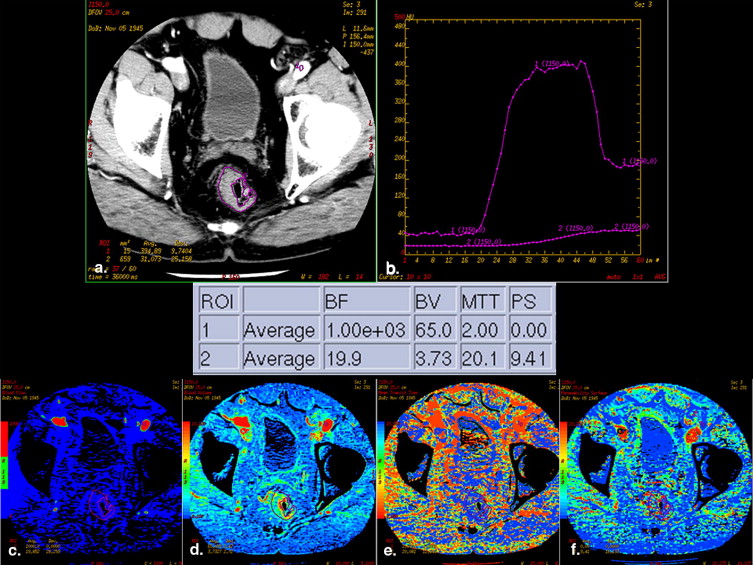
Twenty patients with rectal cancer underwent baseline perfusion CT before CRT, and in 11 an examination after CRT was also performed. For each tumor, blood flow (BF), blood volume (BV), mean transit time (MTT), and permeability-surface area product (PS) were quantified. The Mann-Whitney U test compared baseline perfusion parameters of responders and nonresponders and pre- and post-CRT measurements were compared by the Wilcoxon signed-rank test ( P < .05 statistically significant for both tests).
Results
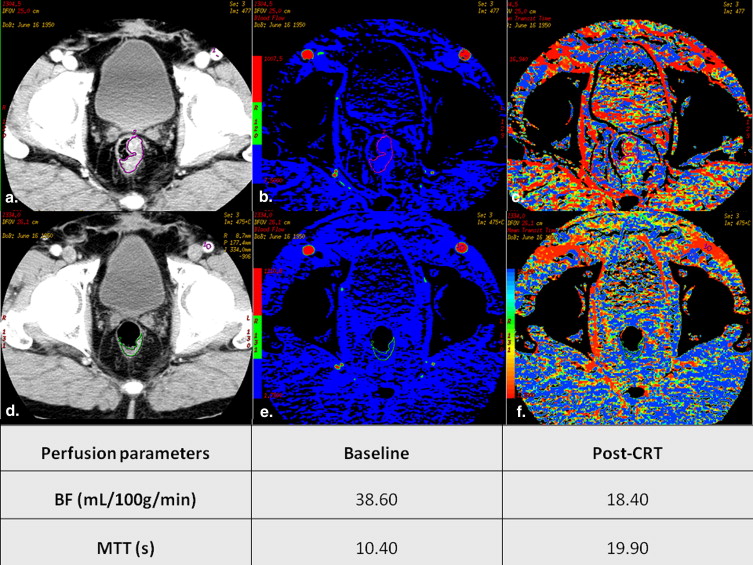
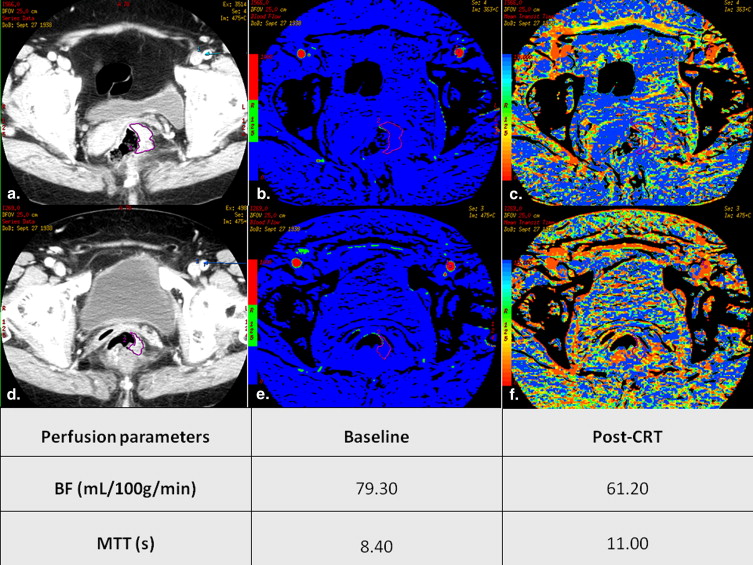
Baseline BF was significantly lower ( P = .013) and MTT was significantly higher ( P = .006) in responders. Both were able to discriminate responders from nonresponders with a sensitivity of 80% and 100% and a specificity of 73.3% and 86.7%, respectively, for BF and MTT. Baseline BV and PS were not significantly different in responders and nonresponders. Perfusion parameters changed significantly in post-CRT scans compared to baseline: BF ( P = .003), BV ( P = .003), and PS ( P = .008) decreased, whereas MTT increased ( P = .006).
Conclusion
Baseline BF and MTT can discriminate patients with a favorable response from those that fail to respond to CRT, potentially selecting high-risk patients with resistant tumors that may benefit from an aggressive preoperative treatment approach.
The multidisciplinary management of rectal cancer patients has been witnessing a progressive change in the therapeutic approach of locally advanced tumors toward preoperative chemoradiation therapy (CRT), which is useful for tumor downsizing and downstaging, facilitating curative resection, decreasing the local recurrence rate, and improving patient survival . Tumor downstaging may lead to a partial or complete tumor regression, but in many cases, even if the tumor cell density is significantly decreased, the pathologic stage remains the same. The histological tumor response to the preoperative treatment can be assessed by the tumor regression grade (TRG), which may be determined according to different grading systems. One of them, proposed by Dworak et al, was specifically designed for application in rectal cancer .
Predicting which tumors will respond well to this therapeutic approach remains a challenge because morphological imaging criteria are unreliable in this regard . As it is becoming increasingly important that preoperative imaging may noninvasively select high-risk patients who could truly benefit from more aggressive multimodality treatment approaches in the preoperative setting , there is a growing interest on functional imaging techniques that can help monitor treatment effects. Both magnetic resonance imaging (MRI) and computed tomography (CT) have shown potential to act as functional biomarkers . Perfusion CT is able to assess vascular physiology within tumors retrieving information about tumor blood flow (BF), blood volume (BV), mean transit time (MTT), and vascular permeability-surface area product (PS) . These parameters reflect vascular changes occurring in neoplastic tissue, ultimately related to the angiogenic process: BF reflects vascular supply to the lesion, BV reflects functional vascular volume, MTT reflects the time of blood through the tumor bed under the influence of vascular density, morphology and shunting, as well as interstitial pressure, and PS reflects leakiness of the microvasculature .
Get Radiology Tree app to read full this article<
Materials and methods
Patients
Get Radiology Tree app to read full this article<
Treatment
Get Radiology Tree app to read full this article<
CT Technique
Get Radiology Tree app to read full this article<
Image and Data Analysis
Get Radiology Tree app to read full this article<
Get Radiology Tree app to read full this article<
Get Radiology Tree app to read full this article<
Standard of Reference
Get Radiology Tree app to read full this article<
Statistical Analysis
Get Radiology Tree app to read full this article<
Results
Treatment Characteristics
Get Radiology Tree app to read full this article<
Histopathological Findings
Get Radiology Tree app to read full this article<
Interobserver Variability
Get Radiology Tree app to read full this article<
ROI Areas
Get Radiology Tree app to read full this article<
Perfusion Parameters for Assessment of Response
Get Radiology Tree app to read full this article<
Table 1
Baseline Perfusion Parameters Across All Levels of TRG and in Responders and Nonresponders to Combined Chemoradiation Therapy
TRG BF (mL/100 g/minute) BV (mL/100 g) MTT (s) PS (mL/100 g/minute) Nonresponders (n = 15) 0 94.50 (50.00–139.00) 5.63 (4.65–6.60) 8.09 (4.28–11.90) 6.59 (6.57–6.61) 1 82.95 (68.00–109.00) 4.85 (4.21–5.92) 5.11 (4.88–5.62) 12.10 (10.70–18.00) 2 63.70 (41.10–118.00) 5.05 (3.05–9.14) 8.33 (5.72–11.50) 12.50 (6.36–41.40) Total 68.00 (41.10–139.00) 5.00 (3.05–9.14) 6.82 (4.28–11.90) 11.40 (6.36–41.40) Responders (n = 5) 3 38.60 (25.00–58.00) 4.65 (3.58–4.76) 11.10 (10.20–22.50) 13.70 (4.70–20.30) 4 40.55 (20.10–61.00) 4.73 (4.28–5.17) 15.65 (11.40–20.90) 14.80 (11.90–17.70) Total 38.60 (20.10–61.00) 4.65 (3.58–5.17) 11.10 (10.20–22.50) 13.70 (4.70–20.30)P value (nonresponders vs. responders) 0.013 0.256 0.006 0.407
BF, blood flow; BV, blood volume; MTT, mean transit time; PS, permeability-surface area product; TRG, tumor regression grade.
Minimum and maximum values are provided between parentheses.
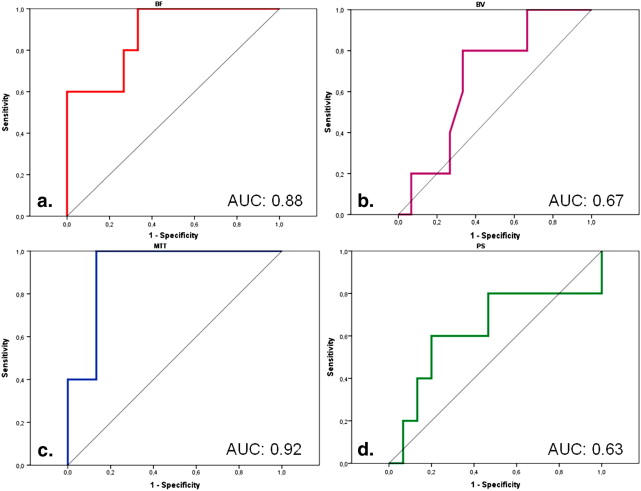
Table 2
Diagnostic Performance of Baseline Perfusion Measurements in Detecting a Good Response to CRT
Perfusion Parameters Sensitivity Specificity PPV NPV Cutoff Point BF 80.0% [4/5] (28–99) 73.3% [11/15] (44–92) 50.0% [4/8] (15–84) 91.7% [11/12] (61–99) 59.25 mL/100 g/minute BV 80.0% [4/5] (28–99) 66.7% [10/15] (38–88) 44.4% [4/9] (13–78) 90.9% [10/11] (58–99) 4.80 mL/100 g MTT 100% [5/5] (47–100) 86.7% [13/15] (59–98) 71,4% [5/7] (29–96) 100% [13/13] (75–100) 9.52 seconds PS 60.0% [3/5] (14–94) 80.0% [12/15] (51–95) 50.0% [3/6] (11–88) 85.7% [12/14] (57–98) 13.45 mL/100 g/minute
BF, blood flow; BV, blood volume; MTT, mean transit time; NPV, negative predictive value; PPV, positive predictive value; PS, permeability-surface area product.
Absolute numbers are given between brackets and 95% confidence intervals are provided between parentheses. Cutoff values were chosen according to the point nearest to the upper left corner in the receiver operating characteristic curves.
![Figure 3, Box-and-whisker plots showing baseline blood flow (BF) and mean transit time (MTT) values of responders (tumor regression grade [TRG] 3-4) and nonresponders (TRG 0-2). Boxes stretch from lower quartile to upper quartile (25th to 75th percentile); median is shown as a line across each bar; whiskers show sample minimum and maximum; O denotes outliers; red horizontal lines represent thresholds. Using a threshold value of 59.25 mL/100 g/minute for BF it is possible to differentiate responders from nonresponders with a sensitivity of 80.0% and a specificity of 73.3%. Regarding MTT, a threshold of 9.52 seconds allows distinction between responders and nonresponders with a sensitivity of 100% and a specificity of 86.7%.](https://storage.googleapis.com/dl.dentistrykey.com/clinical/UsefulnessofPerfusionCTtoAssessResponsetoNeoadjuvantCombinedChemoradiotherapyinPatientswithLocallyAdvancedRectalCancer/2_1s20S107663321100506X.jpg)
Get Radiology Tree app to read full this article<
Perfusion Parameters before and after CRT
Get Radiology Tree app to read full this article<
Get Radiology Tree app to read full this article<
Get Radiology Tree app to read full this article<
Table 3
Perfusion Measurements on a Patient-by-patient Basis
Patient Number BF (mL/100 g/mm 2 ) BV (mL/100 g) MTT (seconds) PS (mL/100 g/mm 2 ) TRG Pre-CRT Post-CRT Pre-CRT Post-CRT Pre-CRT Post-CRT Pre-CRT Post-CRT 1 86.60 20.20 4.86 2.00 4.88 13.00 18.00 13.50 1 2 84.80 23.60 5.08 1.85 6.15 11.00 8.55 8.99 2 3 38.60 18.40 4.65 3.21 11.10 21.00 20.30 7.89 3 4 51.30 19.00 5.23 2.24 8.63 16.00 12.50 9.51 2 5 41.10 60.80 3.05 3.38 8.80 9.70 10.90 7.20 2 6 65.20 9.22 5.05 3.05 8.33 27.00 16.60 11.10 2 7 79.30 52.90 4.84 2.80 5.62 4.50 12.80 11.90 1 8 25.00 9.08 3.58 2.61 22.50 24.00 13.70 9.00 3 9 68.00 53.00 4.21 3.50 5.19 9.90 11.40 11.10 1 10 20.10 20.10 4.28 4.26 20.90 23.00 11.90 11.80 4 11 47.80 NA 3.75 NA 8.83 NA 41.40 NA 2 12 79.70 NA 5.00 NA 6.82 NA 13.20 NA 2 13 60.50 NA 4.18 NA 7.24 NA 12.50 NA 2 14 118.00 NA 9.14 NA 5.72 NA 6.36 NA 2 15 109.00 NA 5.92 NA 5.02 NA 10.70 NA 1 16 50.00 NA 4.65 NA 11.90 NA 6.57 NA 0 17 139.00 NA 6.60 NA 4.28 NA 6.61 NA 0 18 58.00 NA 4.76 NA 10.20 NA 4.70 NA 3 19 63.70 NA 5.27 NA 11.50 NA 7.62 NA 2 20 61.00 7.73 5.17 1.64 10.40 20.00 17.70 3.71 4
BF, blood flow; BV, blood volume; CRT, chemoradiation therapy; MTT, mean transit time; NA, not applicable; PS, permeability-surface area product; TRG, tumor regression grade.
Get Radiology Tree app to read full this article<
Radiation Dose
Get Radiology Tree app to read full this article<
Discussion
Get Radiology Tree app to read full this article<
Get Radiology Tree app to read full this article<
Get Radiology Tree app to read full this article<
Table 4
Comparison of Findings from Previous Reports on Perfusion CT of Rectal Cancer with Results from the Present Study
Authors Year Number of Patients Technical Parameters Criteria for Response Results Prognostic Information Monitoring of Treatment Response Sahani et al 2005 15 (9 repeated after CRT) 4-row MDCT, 5-mm sections, 100–120 kVp, 200–240 mA, 125 mL of contrast (300 mg/mL), 45” acquisition T downstaging at pathologic analysis compared with pre-CRT endorectal US or MRI Cancers with high baseline BF and low MTT responded poorly to CRT Fall in BF and rise in MTT after CRT Bellomi et al 2007 25 (19 repeated after CRT) 16-row MDCT, 10-mm sections, 120 kVp, 300mA, 40 mL of contrast (370 mg/mL), 50” acquisition T or N downstaging at pathologic analysis compared with pre-CRT endorectal US Cancers with high baseline BF and BV showed good response to CRT Fall in BF, BV, and PS after CRT Curvo-Semedo et al 2011 20 (11 repeated after CRT) 64-row MDCT, 2.5-mm sections, 120 kVp, 300 mA, 100 mL of contrast (370 mg/mL), 60” acquisition Dworak’s TRG 3 or 4 Cancers with high baseline BF and low MTT responded poorly to CRT Fall in BF, BV, and PS and rise in MTT after CRT
BF, blood flow; BV, blood volume; CRT, chemoradiation therapy; MDCT, multidetector computed tomography; MTT, mean transit time; PS, permeability-surface area product; TRG, tumor regression grade.
Get Radiology Tree app to read full this article<
Get Radiology Tree app to read full this article<
Get Radiology Tree app to read full this article<
Get Radiology Tree app to read full this article<
Get Radiology Tree app to read full this article<
Get Radiology Tree app to read full this article<
Acknowledgments
Get Radiology Tree app to read full this article<
References
1. Pahlman L., Glimelius B.: The value of adjuvant radio(chemo)therapy for rectal cancer. Eur J Cancer 1995; 31A: pp. 1347-1350.
2. Kaminsky-Forrett M.C., Conroy T., Luporsi E., et. al.: Prognostic implications of downstaging following preoperative radiation therapy for operable T3-T4 rectal cancer. Int J Radiat Oncol Biol Phys 1998; 42: pp. 935-941.
3. Mohiuddin M., Hayne M., Regine W.F., et. al.: Prognostic significance of postchemoradiation stage following preoperative chemotherapy and radiation for advanced/recurrent rectal cancers. Int J Radiat Oncol Biol Phys 2000; 48: pp. 1075-1080.
4. Medich D., McGinty J., Parda D., et. al.: Preoperative chemoradiotherapy and radical surgery for locally advanced distal rectal adenocarcinoma. Dis Colon Rectum 2001; 44: pp. 1123-1128.
5. Janjan N.A., Crane C., Feig B.W., et. al.: Improved overall survival among responders to preoperative chemoradiation for locally advanced rectal cancer. Am J Clin Oncol 2001; 24: pp. 107-112.
6. Valentini V., Coco C., Picciocchi A., et. al.: Does downstaging predict improved outcome after preoperative chemoradiation for extraperitoneal locally advanced rectal cancer? A long-term analysis of 165 patients. Int J Radiat Oncol Biol Phys 2002; 53: pp. 664-674.
7. Theodoropoulos G., Wise W.E., Padmanabhan A., et. al.: T-level downstaging and complete pathologic response after preoperative chemoradiation for advanced rectal result in decreased recurrence and improved disease-free survival. Dis Colon Rectum 2002; 45: pp. 895-903.
8. Dworak O., Keilholz L., Hoffmann A.: Pathological features of rectal cancer after preoperative radiochemotherapy. Int J Colorectal Dis 1997; 12: pp. 19-23.
9. Chen C.C., Lee R.C., Lin J.K., et. al.: How accurate is magnetic resonance imaging in restaging rectal cancer in patients receiving preoperative combined chemoradiotherapy?. Dis Colon Rectum 2005; 48: pp. 722-728.
10. Huh J.W., Park Y.A., Jung E.J., et. al.: Accuracy of endorectal ultrasonography and computed tomography for restaging rectal cancer after preoperative chemoradiation. J Am Coll Surg 2008; 207: pp. 7-12.
11. Barbaro B., Vitale R., Leccisotti L., et. al.: Restaging locally advanced rectal cancer with MR imaging after chemoradiation therapy. RadioGraphics 2010; 30: pp. 699-716.
12. Barrett M.W.: Chemoradiation for rectal cancer: current methods. Semin Surg Oncol 1998; 15: pp. 114-119.
13. Colorectal Cancer Collaborative Group: Adjuvant radiotherapy for rectal cancer: a systematic overview of 8,507 patients from 22 randomised trials. Lancet 2001; 358: pp. 1291-1304.
14. Brasch R.C., Li K.C., Husband J.E., et. al.: In vivo monitoring of tumour angiogenesis with MR imaging. Acad Radiol 2000; 7: pp. 812-823.
15. Harvey C., Dooher A., Morgan J., et. al.: Imaging of tumour therapy responses by dynamic CT. Eur J Radiol 1999; 30: pp. 221-226.
16. Miles K.A., Charnsangavej C., Lee F.T., et. al.: Application of CT in the investigation of angiogenesis in oncology. Acad Radiol 2000; 7: pp. 840-850.
17. Dugdale P.E., Miles K.A., Bunce I., et. al.: CT measurement of perfusion and permeability within lymphoma masses and its ability to assess grade, activity, and chemotherapeutic response. J Comput Assist Tomogr 1999; 23: pp. 540-547.
18. Goh V., Halligan S., Daley F., et. al.: Colorectal tumor vascularity: quantitative assessment with multidetector CT—do tumor perfusion measurements reflect angiogenesis?. Radiology 2008; 249: pp. 510-517.
19. Kambadakone A.V., Sahani D.V.: Body perfusion CT: technique, clinical applications, and advances. Radiol Clin N Am 2009; 47: pp. 161-178.
20. Kan Z., Phongkitkarun S., Kobayashi S., et. al.: Functional CT for quantifying tumor perfusion in antiangiogenic therapy in a rat model. Radiology 2005; 237: pp. 151-158.
21. Bellomi M., Petralia G., Sonzogni A., et. al.: CT perfusion for the monitoring of neoadjuvant chemotherapy and radiation therapy in rectal carcinoma: initial experience. Radiology 2007; 244: pp. 486-493.
22. Goh V., Halligan S., Wellsted D.M., et. al.: Can perfusion CT assessment of primary colorectal adenocarcinoma blood flow at staging predict for subsequent metastatic disease? A pilot study. Eur Radiol 2009; 19: pp. 79-89.
23. Sahani D.V., Kalva S.P., Hamberg L.M., et. al.: Assessing tumor perfusion and treatment response in rectal cancer with multisection CT: initial observations. Radiology 2005; 234: pp. 785-792.
24. Johnson J.A., Wilson T.A.: A model for capillary exchange. Am J Physiol 1966; 210: pp. 1299-1303.
25. Lee T.Y., Purdie T.G., Stewart E.: CT imaging of angiogenesis. Q J Nucl Med 2003; 47: pp. 171-187.
26. St Lawrence K.S., Lee T.Y.: An adiabatic approximation to the tissue homogeneity model for water exchange in the brain. I. Theoretical derivation. J Cereb Blood Flow Metab 1998; 18: pp. 1365-1377.
27. Vliegen R.F., Beets G.L., Lammering G., et. al.: Mesorectal fascia invasion after neoadjuvant chemotherapy and radiation therapy for locally advanced rectal cancer: accuracy of MR imaging for prediction. Radiology 2008; 246: pp. 454-462.
28. Bouzourene H., Bosman F.T., Seelentag W., et. al.: Importance of tumor regression assessment in predicting the outcome in patients with locally advanced rectal carcinoma who are treated with preoperative radiotherapy. Cancer 2002; 94: pp. 1121-1130.
29. Losi L., Luppi G., Gavioli M., et. al.: Prognostic value of Dworak grade of regression (GR) in patients with rectal carcinoma treated with preoperative radiochemotherapy. Int J Colorectal Dis 2006; 21: pp. 645-651.
30. Brown J.M., Giaccia A.J.: The unique physiology of solid tumors: opportunities (and problems) for cancer therapy. Cancer Res 1998; 58: pp. 1408-1416.
31. Eddy H.A.: Alterations in tumor microvasculature during hyperthermia. Radiology 1980; 137: pp. 515-521.
32. Peters W., Teixeira M., Intaglietta M., et. al.: Microcirculation in rat mammary carcinoma. Proc Am Assoc Cancer Res 1980; 21: pp. 38.
33. Wheeler R.H., Ziessman H.A., Medvec B.R., et. al.: Tumor blood flow and systemic shunting in patients receiving intraarterial chemotherapy for head and neck cancer. Cancer Res 1986; 46: pp. 4200-4204.
34. Leek R.D., Landers R.J., Harris A.L., et. al.: Necrosis correlates with high vascular density and focal macrophage infiltration in invasive carcinoma of the breast. Br J Cancer 1999; 79: pp. 991-995.
35. Miles K.A.: Perfusion CT for the assessment of tumour vascularity: which protocol?. Br J Radiol 2003; 76: pp. S36-S42.
36. Goh V., Halligan S., Hugill J.A., et. al.: Quantitative colorectal cancer perfusion measurement using dynamic contrast-enhanced multidetector-row computed tomography: effect of acquisition time and implications for protocols. J Comput Assist Tomogr 2005; 29: pp. 59-63.
37. Chaplin D.J., Trotter M.J., Dougherty G.J.: Microregional tumor blood flow: heterogeneity and therapeutic significance.Bicknell R.Lewis C.E.Ferrara N.Tumor angiogenesis.1997.Oxford University PressOxford, UK:pp. 61-70.
38. De Vries A.F., Griebel J., Kremser C., et. al.: Tumor microcirculation evaluated by dynamic magnetic resonance imaging predicts therapy outcome for primary rectal carcinoma. Cancer Res 2001; 61: pp. 2513-2516.
39. Goh V., Bartram C., Halligan S.: Effect of intravenous contrast agent volume on colorectal cancer vascular parameters as measured by perfusion computed tomography. Clin Radiol 2009; 64: pp. 368-372.
40. Goh V., Halligan S., Hugill J.A., et. al.: Quantitative colorectal cancer perfusion measurements using MDCT: inter and intra-observer agreement. AJR Am J Roentogenol 2005; 185: pp. 225-231.
41. Goh V., Halligan S., Gharpuray A., et. al.: Quantitative assessment of colorectal cancer tumor vascular parameters by using perfusion influence of tumor region of interest. Radiology 2008; 247: pp. 726-732.
42. Kim Y.H., Kim D.Y., Kim T.H., et. al.: Usefulness of magnetic resonance volumetric evaluation in predicting response to preoperative concurrent chemoradiotherapy in patients with resectable rectal cancer. Int J Radiat Oncol Biol Phys 2005; 62: pp. 761-768.
43. Cuenod C.A., Fournier L., Balvay D., et. al.: Tumor angiogenesis: pathophysiology and implications for contrast-enhanced MRI and CT assessment. Abdom Imaging 2006; 31: pp. 188-193.