
Rationale and Objectives
The purposes of the present study were to investigate the impact of viewing size on soft-copy diagnosis for detecting abnormalities on digital chest radiographs and to verify the usefulness of reduced digital chest radiography.
Materials and Methods
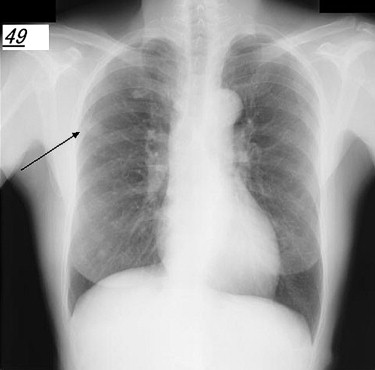
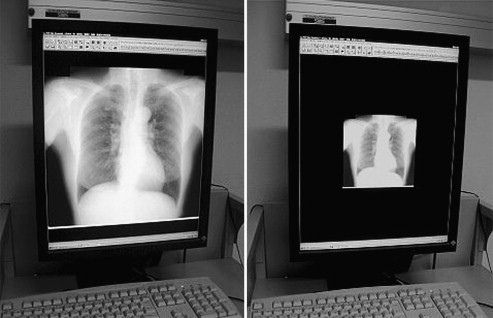
Receiver-operating characteristic (ROC) and localized ROC (LROC) analysis of clinical images was performed using the standard digital image database of the Japanese Radiation Technology Society. A total of 30 images with and 20 images without nodule samples were extracted randomly from the database and used for ROC analysis. A total of 100 images were prepared for observation of reduced and nonreduced images. Observers’ viewing images were adjusted as nonreduced size (large, 30 × 30 cm) and reduced size (small, 15 × 15 cm).
Results
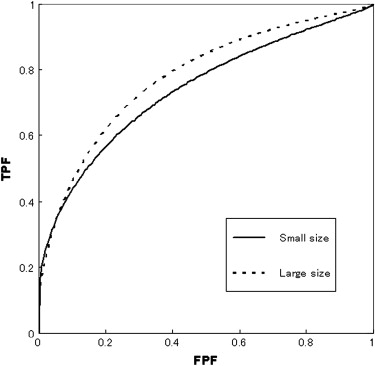
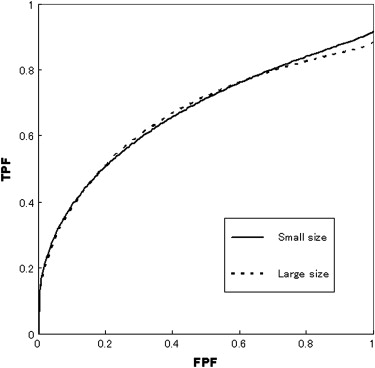
The estimated mean areas under the LROC curves were 0.665 ± 0.071 for large-size images and 0.669 ± 0.087 for small-size images. However, no statistically significant difference was found between the two groups ( P = .823). The viewing time of small-size images (1201.4 seconds) was significantly shorter than that of large-size images (1719.7 seconds). A statistically significant difference was also found in viewing times between reduced and nonreduced digital images with Wilcoxon’s signed-rank test ( P < .05).
Conclusion
This study provided important information that there was a statistically significant difference in viewing times between reduced and nonreduced digital chest radiographic images, whereas no significant difference was found in areas under the LROC curves for the accuracy of diagnosis between the two groups. However, the double-check method for chest x-ray screening would be done efficiently by changing the viewing size to improve the specificity of diagnosis.
Digital image acquisition and display technologies are undergoing rapid development as a replacement for hard-copy interpretation. Although image diagnosis with a radiograph viewed on a standard light box is still popular, viewing radiologic images from monitors has become common practice in medicine. In Japan, radiography and photofluorography have both been selectively used depending on the purpose of the imaging. Photofluorography has in the past provided an economical means for mass chest radiography and has been used extensively for tuberculosis surveys in Japan. However, this is not a common technique today because of recent digital innovation in radiology. On chest x-ray examination, photofluorography was first performed, and if necessary, radiography was then recommended as a follow-up. Although it is seldom used now, in our experience, reduced-size photofluorography was better for diagnostic accuracy for lung nodules than radiography. A few reports are available on observer performance of viewing size with hard copy to support the merits of reduced images . Nakano reported that the diagnostic accuracy of photofluorography was often better than that of radiography. Kobayashi et al reported that the detectability of these two methods was similar and that its degree depended largely on human visual system sensitivity or the films’ characteristics. On the other hand, Tanaka et al reported that radiologists often failed to identify lesions during chest photofluorography, because with this mode of imaging, the influence of reduced image size and the direction of viewing varied.
The diagnosis of chest diseases is often difficult for radiologists because lung lesions tend to be located over low-contrast structures, such as ribs and other bones, the diaphragm, or the mediastinum. Furthermore, false-positive diagnoses may occur. The chest x-ray has limitations; therefore, overall diagnostic tests (eg, computed tomography, positron emission tomography) should be performed to diagnose, for example, lung disease. Many manufacturers offer different viewing software for soft-copy reading in digital radiography. Almost all viewing software includes zoom tools for users to magnify and reduce the view of images, thereby facilitating easy viewing. Our previous phantom study showed that there was no significant difference between reduced and non-reduced image size, but there was a significant difference in the viewing time . If there is no significant difference in observer performance between reduced and nonreduced digital images, such as photofluorography and radiography, radiologists can diagnose quickly and decrease total viewing time using reduced digital images. The shortening of overall diagnostic viewing time also brings benefits of economy. The purposes of the present study were to investigate the impact of viewing size on soft-copy reading for detecting abnormalities on digital chest radiographs and to verify the usefulness of reduced digital chest radiography.
Materials and methods
Get Radiology Tree app to read full this article<
Get Radiology Tree app to read full this article<
Get Radiology Tree app to read full this article<
Table 1
Location and Degree of Subtlety of Samples With Nodules Used in the Study
Nodule location Lung Degree of Subtlety Right Left Heart, Diaphragm Total 1. Extremely subtle 3 3 2 8 2. Very subtle 4 3 1 8 3. Subtle 6 4 0 10 4. Relatively obvious 2 2 0 4 Total 15 12 3 30
Table 2
Subtlety and Newly Detected Solitary Pulmonary Nodules Diagnosed Pathologically ( n = 30)
Subtlety ∗ Nodule Size (mm) Location Diagnosis 4 18 Right Lung cancer 4 26 Right Adenocarcinoma 4 12 Right Lung cancer 4 12 Right Lung cancer 3 15 Left Adenocarcinoma 3 12 Right Lung cancer 3 10 Left Inflammatory pseudotumor 3 20 Right Adenocarcinoma 3 12 Left Lung cancer 3 20 Left Lung cancer 3 15 Right Tuberculosis 3 10 Right Adenocarcinoma 3 18 Right Lung cancer 3 15 Right Metastatic lung cancer 2 20 Left Adenocarcinoma 2 13 Left Lung cancer 2 10 Right Granuloma 2 15 Right Lung cancer 2 11 Right Inflammatory pseudotumor 2 21 Left Lung cancer 2 22 Right Lung cancer 2 16 Right Metastatic lung cancer 1 10 Right Tuberculosis 1 15 Right Sclerosing hemangioma 1 12 Right Tuberculosis 1 10 Right Granuloma 1 18 Left Organized pneumonia 1 15 Left Adenocarcinoma 1 14 Left Metastatic lung cancer 1 10 Left Lung cancer
Get Radiology Tree app to read full this article<
Get Radiology Tree app to read full this article<
Get Radiology Tree app to read full this article<
Get Radiology Tree app to read full this article<
Get Radiology Tree app to read full this article<
Get Radiology Tree app to read full this article<
Get Radiology Tree app to read full this article<
Get Radiology Tree app to read full this article<
Results
Get Radiology Tree app to read full this article<
Table 3
Areas Under the Curve for Seven Observers for the Two Image Sizes
Observer Small Size Large Size 1 0.784 0.817 2 0.605 0.698 3 0.738 0.802 40.811 0.793 5 0.675 0.798 6 0.718 0.737 70.860 0.827 Mean 0.742 0.782 Standard deviation 0.086 0.047
Boldface type indicates that the area under the curve for the small size is larger than that for the large size.
Get Radiology Tree app to read full this article<
Get Radiology Tree app to read full this article<
Table 4
True-Positive Rates for the Two Size Groups
Small Size Large Size Observer Right Wrong Right Wrong 1 19 11 (6) 20 10 (4) 2 11 19 (2) 11 19 (2) 3 20 10 (1) 18 12 (2) 4 13 17 (1) 22 8 (1) 5 20 10 (1) 21 9 (4) 6 12 18 (4) 13 17 (7) 7 21 9 (2) 19 11 (4) Total 116 94 (17) 124 86 (24)
Numbers in parentheses indicate nodules localized falsely.
Table 5
AUC LROC Values for Seven Observers for the Two Image Sizes
Small Size Large Size Observer Maximum TPF AUC LROC Maximum TPF AUC LROC 1 0.800 0.607 0.867 0.637 2 0.933 0.568 0.933 0.628 3 0.967 0.705 0.933 0.711 4 0.9670.768 0.967 0.764 5 0.967 0.654 0.867 0.675 6 0.8670.593 0.767 0.542 7 0.9330.790 0.867 0.695 Mean 0.9190.669 0.886 0.665 Standard deviation 0.063 0.087 0.066 0.071
AUC, area under the curve; LROC, localized receiver-operating characteristic; TPF, true-positive fraction.
Boldface type indicates that the AUC LROC value for the small size is larger than that for the large size.
Get Radiology Tree app to read full this article<
Get Radiology Tree app to read full this article<
Table 6
Viewing Times of the Two Size Groups
Observer Small size (s) Large size (s) 1 562 972 2 2520 3495 3 590 978 4 1329 999 5 1745 2667 6 572 702 7 1092 2225 Mean 1201.4 1719.7 ∗ Standard deviation 735.0 1077.7
Get Radiology Tree app to read full this article<
Get Radiology Tree app to read full this article<
Discussion
Get Radiology Tree app to read full this article<
Get Radiology Tree app to read full this article<
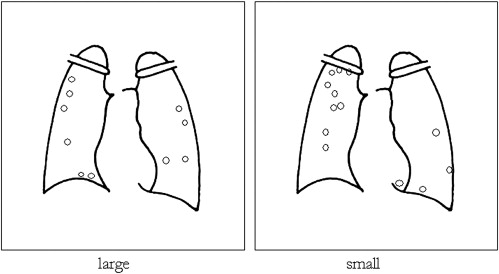
Table 7
Relationship Between Tumor Size and Frequency of Nondetection for Each of the Image Sizes Tested for Clinical Diagnosis
Image Size of Nodule (mm) Small Size Large Size p01 10 2 1 p02 102 p03 10 3 p04 10 12 p05 10 1 p06 10 1 1 p07 11 2 1 p08 12 12 p09 12 1 1 p10 12 2 1 p11 12 1 1 p12 12 2 p13 13 2 p14 14 2 1 p15 15 p16 15 1 1 p17 15 1 1 p18 15 23 p19 152 p20 15 1 p21 16 2 2 p22 18 2 p23 18 p24 18 1 1 p25 20 p26 20 23 p27 20 12 p28 211 p29 22 3 p30 26 2 Total 39 29
Boldface type indicates cases in which the number of nondetected tumors was greater in large-size images than in small-size images.
Get Radiology Tree app to read full this article<
Get Radiology Tree app to read full this article<
Get Radiology Tree app to read full this article<
Get Radiology Tree app to read full this article<
Get Radiology Tree app to read full this article<
Get Radiology Tree app to read full this article<
Get Radiology Tree app to read full this article<
Conclusion
Get Radiology Tree app to read full this article<
Acknowledgments
Get Radiology Tree app to read full this article<
References
1. Fuhrmann C.R., Gur D., Good B., et. al.: Storage phosphor radiographs vs conventional films: interpreters’ perception of diagnostic quality. AJR Am J Roentgenol 1988; 150: pp. 1011-1014.
2. Schaefer C.M., Prokop M., Oestmann J.W., et. al.: Impact of hard-copy size on observer performance in digital chest radiography. Radiology 1992; 184: pp. 77-81.
3. Nakano S.: Difference and characteristic between radiography and photofluorography [in Japanese]. Double-Barred Cross 1998; 264: pp. 16-18.
4. Kobayashi T., Takashima T., Kamimura R., et. al.: Prospective evaluation of ability of photofluorography for screening small peripheral pulmonary nodules compared with the film/screen method using ROC analysis. Jpn J Lung Cancer 1995; 35: pp. 295-300.
5. Tanaka T., Yuzuta K., Kobayashi Y., et. al.: Evaluation of false positive rate on lung cancer screening [in Japanese]. Jpn J Chest Dis 1984; 43: pp. 832-838.
6. Bessho Y., Fujita H., Yamaguchi M., et. al.: A fundamental study on image display size in soft-copy reading. Memoirs Osaka Kyoiku Univ Ser Nat Sci Appl Sci 2007; 55: pp. 1-10.
7. Shiraishi J., Katsuragawa S., Ikezoe J., et. al.: Development of a digital image database for chest radiographs with and without a lung nodule: receiver operating characteristics analysis of radiologists’ detection of pulmonary nodules. AJR Am J Roentgenol 2000; 174: pp. 71-74.
8. Shiraishi J.: Beginner’s guide for successful ROC analysis(Vol 1). Med Imaging Inform Sci 2001; 18: pp. 93-103.
9. Mets C.E.: Some practical issues of experimental design and data analysis in radiological ROC studies. Invest Radiol 1989; 24: pp. 234-245.
10. National Electrical Manufacturers Association: Digital Imaging and Communications in Medicine (DICOM) part 14: Grayscale Standard Display Function.1999.National Electrical Manufacturers AssociationRosslyn, VA
11. Tanaka H.: Guideline for quality assurance of medical imaging display monitors [in Japanese]. Jpn J Radiol Technol 2006; 62: pp. 508-511.
12. Dorfman D.D., Berbaum K.S., Metz C.E.: Receiver operating characteristic rating analysis: generalization to the population of readers and cases with the jackknife method. Invest Radiol 1992; 27: pp. 723-731.
13. Starr S.J., Metz C.E., Lusted L.B., et. al.: Visual detection and localization of radiographic images. Radiology 1975; 116: pp. 533-538.
14. Ueguchi T., Johkoh T., Tomiyama N., et. al.: Full-size digital storage phosphor chest radiography: effect of 4K versus 2K matrix size on observer performance in detection of subtle interstitial abnormalities. Radiat Med 2005; 23: pp. 170-174.
15. Fujita H., Yamaguchi M., Bessho Y., et. al.: Analysis of the display function on viewing monitors for the digital diagnostic imaging modality. Med Imaging Inform Sci 2005; 22: pp. 153-159.