
Rationale and Objectives
We evaluate utilizing convolutional neural networks (CNNs) to optimally fuse parenchymal complexity measurements generated by texture analysis into discriminative meta-features relevant for breast cancer risk prediction.
Materials and Methods
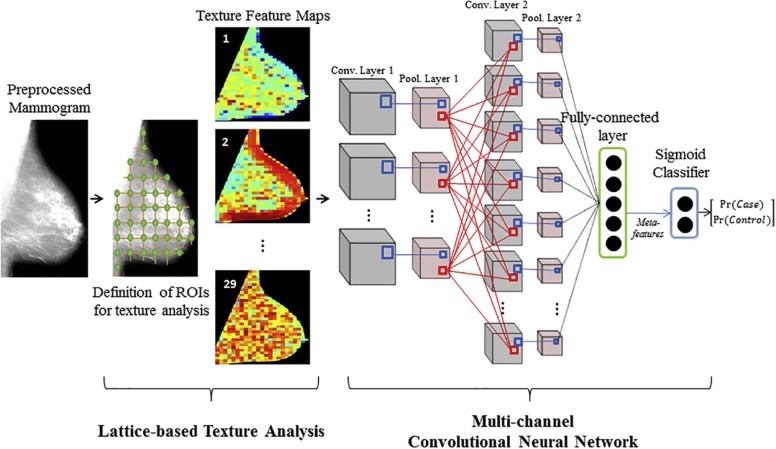
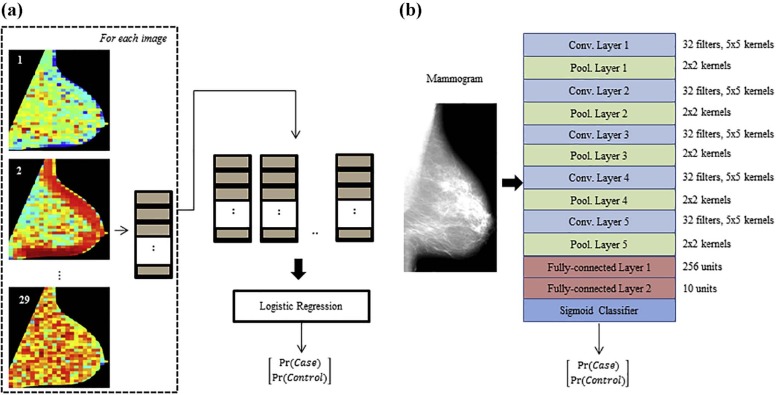
With Institutional Review Board approval and Health Insurance Portability and Accountability Act compliance, we retrospectively analyzed “For Processing” contralateral digital mammograms (GE Healthcare 2000D/DS) from 106 women with unilateral invasive breast cancer and 318 age-matched controls. We coupled established texture features (histogram, co-occurrence, run-length, structural), extracted using a previously validated lattice-based strategy, with a multichannel CNN into a hybrid framework in which a multitude of texture feature maps are reduced to meta-features predicting the case or control status. We evaluated the framework in a randomized split-sample setting, using the area under the curve (AUC) of the receiver operating characteristic (ROC) to assess case-control discriminatory capacity. We also compared the framework to CNNs directly fed with mammographic images, as well as to conventional texture analysis, where texture feature maps are summarized via simple statistical measures that are then used as inputs to a logistic regression model.
Results
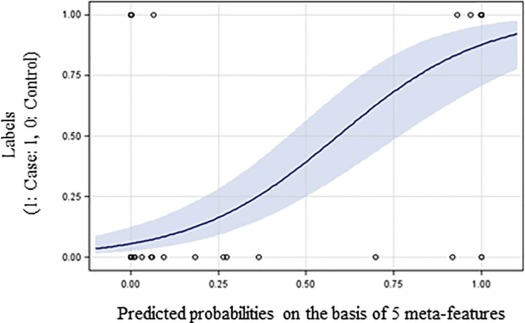
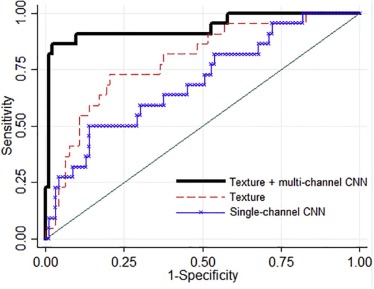
Strong case-control discriminatory capacity was demonstrated on the basis of the meta-features generated by the hybrid framework (AUC = 0.90), outperforming both CNNs applied directly to raw image data (AUC = 0.63, P < .05) and conventional texture analysis (AUC = 0.79, P < .05).
Conclusions
Our results suggest that informative interactions between patterns exist in texture feature maps derived from mammographic images, which can be extracted and summarized via a multichannel CNN architecture toward leveraging the associations of textural measurements to breast cancer risk.
Introduction
The stratification of breast cancer risk levels is becoming increasingly important and is rapidly evolving beyond the “one-size-fits-all” approach in breast cancer screening to personalized regimens tailored by individual risk profiling . Starting from the pioneering work of Wolfe , studies have consistently shown an association of the breast parenchymal complexity (ie, the distribution of fatty and dense tissues) on breast images with levels of breast cancer risk. In particular, full-field digital mammography (FFDM), which is routinely used for breast cancer screening , has demonstrated substantial potential in providing novel quantitative imaging biomarkers related to breast cancer risk. Mammographic density is one of the strongest risk factors for breast cancer , while studies increasingly support significant associations of breast cancer risk with mammographic texture descriptors , which reflect more refined, localized characteristics of the breast parenchymal pattern.
In early studies investigating the role of mammographic texture in breast cancer risk assessment , textural measurements have been estimated within a single region of interest (ROI) in the breast. In an attempt to provide more granular texture estimates, more recent studies have proposed sampling the parenchymal tissue through the entire breast for subsequent texture analysis . For instance, in a recently proposed lattice-based strategy , each texture descriptor is calculated within multiple nonoverlapping local square ROIs through the breast, and texture measurements are then averaged over the breast regions sampled by the lattice. In a preliminary case-control evaluation , the lattice-based texture features were shown to outperform state-of-the-art features extracted from the retroareolar or central breast region, thereby suggesting that enhanced capture of the heterogeneity in the parenchymal texture within the breast may also improve the associations of texture measures with breast cancer risk. However, by averaging regional texture values, important information about the overall parenchymal tissue complexity might be still missed and, therefore, an improved fusion approach, which retains richer information about texture variability over the breast, might leverage the potential of such granular texture measurements provided by multiple ROIs.
Get Radiology Tree app to read full this article<
Get Radiology Tree app to read full this article<
Materials and Methods
Study Dataset
Get Radiology Tree app to read full this article<
Image Acquisition
Get Radiology Tree app to read full this article<
Revealing Meta-features of Breast Parenchymal Complexity
Get Radiology Tree app to read full this article<
Get Radiology Tree app to read full this article<
Get Radiology Tree app to read full this article<
TABLE 1
Parenchymal Texture Feature Maps (TFMs) Extracted From Each Digital Mammogram of the Study Dataset
Gray-level histogram TFM1 5th Percentile TFM2 5th Mean TFM3 95th Percentile TFM4 95th Mean TFM5 Entropy TFM6 Kurtosis TFM7 Max TFM8 Mean TFM9 Min TFM10 Sigma TFM11 Skewness TFM12 Sum Co-occurrence TFM13 Contrast TFM14 Correlation TFM15 Homogeneity TFM16 Energy TFM17 Entropy TFM18 Inverse difference moment TFM19 Cluster shade Run-length TFM20 Short-run emphasis TFM21 Long-run emphasis TFM22 Gray-level nonuniformity TFM23 Run-length nonuniformity TFM24 Run percentage TFM25 Low gray-level run emphasis TFM26 High gray-level run emphasis Structural TFM27 Edge-enhancing index TFM28 Box-counting fractal dimension TFM29 Local binary pattern
Get Radiology Tree app to read full this article<
Get Radiology Tree app to read full this article<
Get Radiology Tree app to read full this article<
Get Radiology Tree app to read full this article<
Comparative Evaluation
Get Radiology Tree app to read full this article<
Get Radiology Tree app to read full this article<
Get Radiology Tree app to read full this article<
Get Radiology Tree app to read full this article<
Results
Get Radiology Tree app to read full this article<
Get Radiology Tree app to read full this article<
Get Radiology Tree app to read full this article<
TABLE 2
Texture Features Selected by Elastic Net Regression
b__P Value 95% CI TFM13_mean −0.59 .013 [−1.05, −0.12] TFM17_mean 0.03 .897 [−0.44, 0.50] TFM19_mean −0.69 .001 [−1.08, −0.29] TFM22_mean −1.31 .395 [−4.34, 1.71] TFM23_mean 0.76 .582 [−1.96, 3.48] TFM24_mean −0.14 .602 [−0.64, 0.37] TFM28_mean 1.07 .437 [−1.62, 3.75] TFM29_mean 0.05 .944 [−1.34, 1.44] TFM11_std 0.24 .642 [−0.79, 1.28] TFM15_std 0.52 .031 [0.05, 1.00] TFM22_std 0.14 .483 [−0.25, 0.53] TFM28_std −0.54 .002 [−0.87, −0.20]
For each feature, the logistic regression coefficient ( b ), the P value, and 95% confidence interval (CI) for b are provided.
Get Radiology Tree app to read full this article<
Discussion
Get Radiology Tree app to read full this article<
Get Radiology Tree app to read full this article<
Get Radiology Tree app to read full this article<
Get Radiology Tree app to read full this article<
Acknowledgments
Get Radiology Tree app to read full this article<
Appendix
Descriptions of Texture Features
Get Radiology Tree app to read full this article<
Get Radiology Tree app to read full this article<
Get Radiology Tree app to read full this article<
Get Radiology Tree app to read full this article<
References
1. Onega T., Beaber E.F., Sprague B.L., et. al.: Breast cancer screening in an era of personalized regimens: a conceptual model and National Cancer Institute initiative for risk-based and preference-based approaches at a population level. Cancer 2014; 120: pp. 2955-2964.
2. Siu A.L.: Screening for breast cancer: US Preventive Services Task Force recommendation statement. Ann Intern Med 2016; 164: pp. 279-296.
3. Wolfe J.N.: Breast patterns as an index for developing breast cancer. AJR Am J Roentgenol 1976; 126: pp. 1130-1137.
4. McDonald E.S., Clark A.S., Tchou J., et. al.: Clinical diagnosis and management of breast cancer. J Nucl Med 2016; 57: pp. 9S-16S.
5. Ng K.-H., Lau S.: Vision 20/20: mammographic breast density and its clinical applications. Med Phys 2015; 42: pp. 7059-7077.
6. McCormack V.A., dos Santos Silva I.: Breast density and parenchymal patterns as markers of breast cancer risk: a meta-analysis. Cancer Epidemiol Biomarkers Prev 2006; 15: pp. 1159-1169.
7. Gastounioti A., Conant E.F., Kontos D.: Beyond breast density: a review on the advancing role of parenchymal texture analysis in breast cancer risk assessment. Breast Cancer Res 2016; 18: pp. 91.
8. Wang C., Brentnall A.R., Cuzick J., et. al.: A novel and fully automated mammographic texture analysis for risk prediction: results from two case-control studies. Breast Cancer Res 2017; 19: pp. 114.
9. Winkel R.R., Nielsen M., Petersen K., et. al.: Mammographic density and structural features can individually and jointly contribute to breast cancer risk assessment in mammography screening: a case-control study. BMC Cancer 2016; 16: pp. 414.
10. Li H., Giger M.L., Lan L., et. al.: Comparative analysis of image-based phenotypes of mammographic density and parenchymal patterns in distinguishing between BRCA1/2 cases, unilateral cancer cases, and controls. J Med Imaging 2014; 1: pp. 031009.
11. Häberle L., Wagner F., Fasching P.A., et. al.: Characterizing mammographic images by using generic texture features. Breast Cancer Res 2012; 14: pp. R59.
12. Manduca A., Carston M.J., Heine J.J., et. al.: Texture features from mammographic images and risk of breast cancer. Cancer Epidemiol Biomarkers Prev 2009; 18: pp. 837-845. PubMed PMID 19258482
13. Li H., Giger M.L., Olopade O.I., et. al.: Computerized texture analysis of mammographic parenchymal patterns of digitized mammograms. Acad Radiol 2005; 12: pp. 863-873.
14. Torres-Mejia G., De Stavola B., Allen D.S., et. al.: Mammographic features and subsequent risk of breast cancer: a comparison of qualitative and quantitative evaluations in the Guernsey prospective studies. Cancer Epidemiol Biomarkers Prev 2005; 14: pp. 1052-1059. PubMed PMID 15894652
15. Zheng Y., Keller B.M., Ray S., et. al.: Parenchymal texture analysis in digital mammography: a fully automated pipeline for breast cancer risk assessment. Med Phys 2015; 42: pp. 4149-4160.
16. Sun W., Tseng T.-L.B., Qian W., et. al.: Using multiscale texture and density features for near-term breast cancer risk analysis. Med Phys 2015; 42: pp. 2853-2862.
17. Keller B.M., Oustimov A., Wang Y., et. al.: Parenchymal texture analysis in digital mammography: robust texture feature identification and equivalence across devices. J Med Imaging 2015; 2: pp. 024501.
18. LeCun Y., Bengio Y., Hinton G.: Deep learning. Nature 2015; 521: pp. 436-444.
19. Bengio Y.: Learning deep architectures for AI. Found Trends Mach Learn 2009; 2: pp. 1-127.
20. Shin H.-C., Roth H.R., Gao M., et. al.: Deep convolutional neural networks for computer-aided detection: CNN architectures, dataset characteristics and transfer learning. IEEE Trans Med Imaging 2016; 35: pp. 1285-1298.
21. Litjens G., Kooi T., Bejnordi B.E., et. al.: A survey on deep learning in medical image analysis. arXiv preprint arXiv:1702057472017.
22. Samala R.K., Chan H.P., Hadjiiski L., et. al.: Mass detection in digital breast tomosynthesis: deep convolutional neural network with transfer learning from mammography. Med Phys 2016; 43: pp. 6654-6666.
23. Kooi T., Litjens G., van Ginneken B., et. al.: Large scale deep learning for computer aided detection of mammographic lesions. Med Image Anal 2017; 35: pp. 303-312.
24. Huynh B.Q., Li H., Giger M.L.: Digital mammographic tumor classification using transfer learning from deep convolutional neural networks. J Med Imaging 2016; 3: pp. 034501.
25. Samala R.K., Chan H.-P., Hadjiiski L.M., et. al.: Multi-task transfer learning deep convolutional neural network: application to computer-aided diagnosis of breast cancer on mammograms. Phys Med Biol 2017; 62: pp. 8894-8908.
26. Kallenberg M., Petersen K., Nielsen M., et. al.: Unsupervised deep learning applied to breast density segmentation and mammographic risk scoring. IEEE Trans Med Imaging 2016; 35: pp. 1322-1331.
27. Li H., Giger M.L., Huynh B.Q., et. al.: Deep learning in breast cancer risk assessment: evaluation of convolutional neural networks on a clinical dataset of full-field digital mammograms. Journal of Medical Imaging 2017; 4: p.041304
28. Geras K.J., Wolfson S., Kim S., et. al.: High-resolution breast cancer screening with multi-view deep convolutional neural networks. arXiv preprint arXiv:1703070472017.
29. Keller B.M., Chen J., Daye D., et. al.: Preliminary evaluation of the publicly available Laboratory for Individualized Breast Radiodensity Assessment (LIBRA) software tool: comparison of fully automated area and volumetric density measures in a case-control study with digital mammography. Breast Cancer Res 2015; 17: pp. 1-17.
30. Chen X., Moschidis E., Taylor C., et. al.: Breast cancer risk analysis based on a novel segmentation framework for digital mammograms.Medical Image Computing and Computer-Assisted Intervention—MICCAI 2014.2014.SpringerCham:pp. 536-543.
31. Eng A., Gallant Z., Shepherd J., et. al.: Digital mammographic density and breast cancer risk: a case-control study of six alternative density assessment methods. Breast Cancer Res 2014; 16: pp. 439.
32. Keller B.M., Nathan D.L., Wang Y., et. al.: Estimation of breast percent density in raw and processed full field digital mammography images via adaptive fuzzy c-means clustering and support vector machine segmentation. Med Phys 2012; 39: pp. 4903-4917.
33. LeCun Y., Bottou L., Bengio Y., et. al.: Gradient-based learning applied to document recognition. P IEEE 1998; 86: pp. 2278-2324.
34. LeCun Y., Boser B., Denker J.S., et. al.: Backpropagation applied to handwritten zip code recognition. Neural Comput 1989; 1: pp. 541-551.
35. Prechelt L.: Early stopping—but when? Neural networks: tricks of the trade.2012.SpringerBerlin, Heidelbergpp. 53-67.
36. DeLong E.R., DeLong D.M., Clarke-Pearson D.L.: Comparing the areas under two or more correlated receiver operating characteristic curves: a nonparametric approach. Biometrics 1988; 44: pp. 837-845.
37. Zou H., Hastie T.: Regularization and variable selection via the elastic net. J R Stat Soc Series B Stat Methodol 2005; 67: pp. 301-320.
38. Dieleman S., Schlüter J., Raffel C., et. al.: Lasagne: a lightweight library to build and train neural networks in Theano. Available at https://lasagne.readthedocs.io/en/latest/
39. Glorot X., Bengio Y.: Understanding the difficulty of training deep feedforward neural networks.2010.AISTATSChia Laguna Resort, Sardinia, Italy
40. Gastounioti A., Oustimov A., Keller B.M., et. al.: Breast parenchymal patterns in processed versus raw digital mammograms: a large population study toward assessing differences in quantitative measures across image representations. Med Phys 2016; 43: pp. 5862-5877.
41. Bergstra J., Bengio Y.: Random search for hyper-parameter optimization. J Mach Learn Res 2012; 13: pp. 281-305.
42. Materka A., Strzelecki M.: Texture analysis methods—a review. Technical University of Lodz, Institute of Electronics, COST B11 report, Brussels1998. 9–11
43. Haralick R.M., Shanmugam K., Dinstein I.H.: Textural features for image classification. IEEE Trans Syst Man Cybern 1973; pp. 610-621.
44. Galloway M.M.: Texture analysis using gray level run lengths. Comput Graph Image Process 1975; 4: pp. 172-179.
45. Chu A., Sehgal C.M., Greenleaf J.F.: Use of gray value distribution of run lengths for texture analysis. Pattern Recognit Lett 1990; 11: pp. 415-419.
46. Weickert J.: Coherence-enhancing diffusion filtering. Int J Comput Vis 1999; 31: pp. 111-127.
47. Ojala T., Pietikäinen M., Mäenpää T.: Multiresolution gray-scale and rotation invariant texture classification with local binary patterns. IEEE Trans Pattern Anal Mach Intell 2002; 24: pp. 971-987.
48. Caldwell C.B., Stapleton S.J., Holdsworth D.W., et. al.: Characterisation of mammographic parenchymal pattern by fractal dimension. Phys Med Biol 1990; 35: pp. 235-247.