
Rationale and Objectives
Use data collected independently at three institutions to compare time to first fixate the true lesion in searching for cancers on mammograms. Examine the fit of the results to a holistic model of visual perception.
Materials and Methods
The time required to first fixate a cancer on a mammogram was extracted from 400 eye-tracking records collected independently from three institutions. The time was used as an indicator of the initial perception of cancer. The distribution of first fixation times was partitioned into two normally distributed components using mixture distribution analysis. The true-positive fraction of each component was calculated.
Results
About 57% of the cancers had a 95% chance of being fixated in the first second of viewing. The remainder took longer (range, 1.0 to 15.2 seconds). The true-positive fraction was larger for the lesions hit immediately for most of the readers (TPF = 0.63 vs. 0.52, F = 5.88, P = .02) in 68% (13/19) of the readers.
Conclusions
The initial detection occurs before visual scanning and, therefore, must be the result of a parallel “global” analysis of the image resulting in an initial holistic, gestalt-like perception. The development of expertise in medical image analysis may consist of a shift in the recognition mechanism from scan-look-detect to look-detect-scan.
A previous gaze-tracking study of mammographers, mammography fellows, and radiology residents searching mammograms for cancer showed that more than half of the cancers fixated by the observers were visually inspected within 1.1 seconds of the onset of viewing ( ). This result was attributed to a global response that synthesizes a complete perception and identifies perturbations in the image. The gaze is then directed to the perturbations, and local features are analyzed using input from the high-resolution central vision performing, what we term “checking fixations.” After a covert task-based decision is made about the nature of a perturbation (eg, is it a cancer or not), the eyes are either moved to another location based on information from the global response or begin a more general discovery scanning of the image. Discovery scanning can be cognitively determined. For example, a scan path can be geometric when the target abnormality is very small and seemingly randomly positioned like microcalcifications on a mammogram or it can be anatomic when the target is a rib fracture. During discovery scanning, there is continued input from the peripheral retina and the scan path can be interrupted by checking fixations. Additionally, perturbations that are considered to be target locations are revisited resulting in increased dwell time ( ) on locations that will be reported as positive and scored as either true or false positive. After discovery and checking is completed, overt decisions are made. As a result of the complicated search process, the decision time is usually longer than the discovery time and the total scan path can be very complicated and difficult to analyze.
The emphasis on global response as opposed to serial scanning with local feature analysis is the reason that this model for scene perception is characterized as gestalt-like or holistic. The controversy over the perceptual relationships between objects and their component features has a long history in psychology and philosophy that has been reviewed by Kimchi ( ). Search models were largely based on studies of response time ( ), but doubt was cast on the validity of the models by the development of practical methods for recording eye position during the performance of search tasks ( ).
Get Radiology Tree app to read full this article<
Get Radiology Tree app to read full this article<
Get Radiology Tree app to read full this article<
Materials and methods
The Three Eye Position Datasets
Get Radiology Tree app to read full this article<
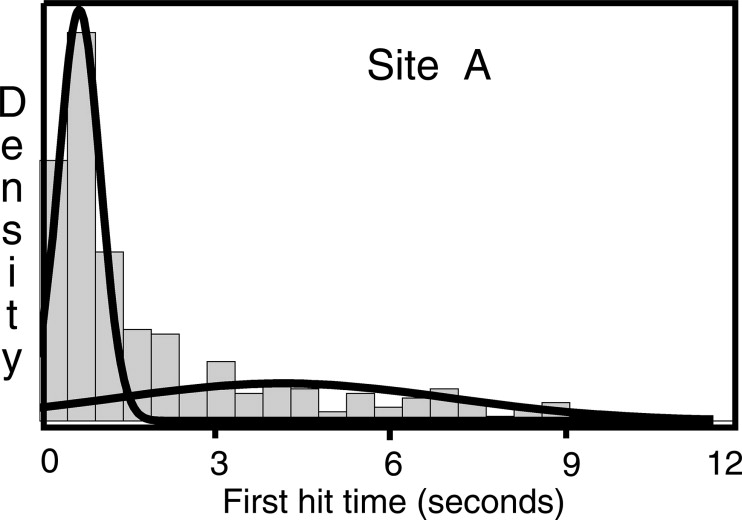
Site A
Get Radiology Tree app to read full this article<
Site B
Get Radiology Tree app to read full this article<
Site C
Get Radiology Tree app to read full this article<
Get Radiology Tree app to read full this article<
Table 1
The Composition of the Datasets Used in the Study
Performance Site A B C Total cancer cases in test set 20 9 30 Mammogram views CC and MLO CC or MLO CC and MLO Reader prompted to report Malignant only Benign and malignant Malignant only Readers 9 6 4 Available eye-position records 300 54 89 Total first fixation times used in the analysis 259 53 88
CC, craniocaudal; MLO, mediolateral oblique.
Get Radiology Tree app to read full this article<
Get Radiology Tree app to read full this article<
Get Radiology Tree app to read full this article<
Get Radiology Tree app to read full this article<
Get Radiology Tree app to read full this article<
e−(y−μ1)22σ21p12π√σ1+e−(y−μ2)22σ22p22π√σ2. e
-
(
y
-
μ
1
)
2
2
σ
1
2
p
1
2
π
σ
1
+
e
-
(
y
-
μ
2
)
2
2
σ
2
2
p
2
2
π
σ
2
.
The expectation maximization algorithm is used to find optimal values for the parameters (μ, σ, and p) of each component ( ). Starting values for each component distribution were estimated using the k-means clustering algorithm. The maximum number of iterations of the expectation maximization algorithm was set at 1,000, although each dataset converged in less than 200 iterations. The confidence intervals of the proportions were estimated using a bootstrap technique.
Get Radiology Tree app to read full this article<
Get Radiology Tree app to read full this article<
PctFx=CancersFirstFixatedTotalCancersinTestSet×100. P
c
t
F
x
=
C
a
n
c
e
r
s
F
i
r
s
t
F
i
x
a
t
e
d
T
o
t
a
l
C
a
n
c
e
r
s
i
n
T
e
s
t
S
e
t
×
100
.
The true-positive percentage (PctTP) in each component was calculated for each reader as
PctTPirs=TPirsTPirs+FNirs×100 P
c
t
T
P
i
r
s
=
T
P
i
r
s
T
P
i
r
s
+
F
N
i
r
s
×
100
where i is the component number (1 or 2) assigned to the trial by Emmix, r is the reader, and s is the site. The PctTP for each site was analyzed for readers and components using an analysis of variance.
Get Radiology Tree app to read full this article<
Results
Get Radiology Tree app to read full this article<
Table 2
The Results of the Mixture Distribution Analysis on the Time Required to First Fixate a Cancer
Fast Component 1 Slow Component 2 Site_n_ Mean time (95% CI) Proportion (95% CI) Mean time (95% CI) Proportion (95% CI) A 259 0.71 (0.65–0.76) 0.57 (0.50–0.65) 4.36 (3.81–4.90) 0.42 (0.35–0.50) B 53 0.62 (0.54–0.69) 0.64 (0.33–0.89) 1.44 (1.15–1.73) 0.36 (0.10–0.67) C 88 0.75 (0.62–0.88) 0.42 (0.26–0.54) 5.46 (4.73–6.18) 0.57 (0.46–0.74) All 400 0.72 (0.69–0.77) 0.57 (0.51–0.63) 4.75 (4.48–5.02) 0.42 (0.37–0.49)
CI, confidence interval.
The times are given in seconds.
Table 3
The Percentage of All Cancers First Fixated (PctFx) and the Percent of True Positives (PctTP) in Each Component Given as the Mean and 95% Confidence Intervals for the Readers at Each Performance Site and for All of the Readers Combined
Fast Component Slow Component Site Readers PctFx PctTP PctFx PctTP A 9 62 (60–63) 68 (63–74) 38 (37–40) 39 (34–44) B 6 67 (61–73) 68 (65–71) 33 (27–39) 63 (52–73) C 4 46 (38–56) 44 (32–56) 54 (44–64) 65 (62–68) All 19 60 (58–62) 63 (61–65) 40 (38–42) 52 (49–55)
Get Radiology Tree app to read full this article<
Discussion
Get Radiology Tree app to read full this article<
Get Radiology Tree app to read full this article<
Get Radiology Tree app to read full this article<
Get Radiology Tree app to read full this article<
References
1. Kundel H.L., Nodine C.F., Conant E.F., et. al.: Holistic component of image perception in mammogram interpretation: Gaze-tracking study. Radiology 2007; 242: pp. 396-402.
2. Krupinski E.A., Nodine C.F., Kundel H.L.: Enhancing recognition of lesions in radiographic images using perceptual feedback. Opt Engineer 1998; 37: pp. 813-818.
3. Kimchi R.: Relative dominance of holistic and component properties in the perceptual organization of visual objects.Peterson M.A.Rhodes G.Perception of faces, objects, and scenes: analytic and holistic processes.2003.Oxford University PressOxford:pp. 235-268.
4. Luce R.D.: Response times: their role in inferring elementary mental organization.1986.Oxford University PressNew York
5. Wolfe J.M.: What can 1 million trials tell us about visual search?. Psychol Sci 1998; 9: pp. 33-39.
6. Kundel H.L., Nodine C.F., Carmody D.P.: Visual scanning, pattern recognition, and decision making in pulmonary nodule detection. Invest Radiol 1978; 13: pp. 175-181.
7. Llewellyn-Thomas E.: Search behavior.Tuddenham W.J.Radiol Clin N Am.1969.WB SaundersPhiladelphia:pp. 403-417.
8. Chase W., Simon H.: Perception in chess. Cog Psych 1973; 4: pp. 55-81.
9. Kundel H.L., Nodine C.F.: Interpreting chest radiographs without visual search. Radiology 1975; 116: pp. 527-532.
10. Swensson R.G.: A two-stage detection model applied to skilled visual search by radiologists. Perception Psychophys 1980; 27: pp. 11-16.
11. Oestmann J.W., Greene R., Kushner D.C., et. al.: Lung lesions: correlation between viewing time and detection. Radiology 1988; 166: pp. 451-453.
12. Hu C.H., Kundel H.L., Nodine C.F., et. al.: Searching for bone fractures: a comparison with pulmonary nodule search. Acad Radiol 1994; 1: pp. 25-32.
13. Williams L.G.: Studies of extrafoveal discrimination and detection.Visual search.1973.National Academy of SciencesWashington, DC:pp. 77-92.
14. Nodine C.F., Kundel H.L., Toto L.C., et. al.: Recording and analyzing eye-position data using a microcomputer workstation. Beh Res Meth Inst Comp 1992; 24: pp. 475-485.
15. Krupinski E.A.: Visual search of mammographic images: influence of lesion subtlety. Acad Radiol 2005; 12: pp. 965-969.
16. Mello-Thoms C., Hardesty L., Sumkin J., et. al.: Effects of lesion conspicuity on visual search in mammogram reading. Acad Radiol 2005; 12: pp. 830-840.
17. Wolfram Research, Inc: Mathematica, Version 5.1.2004. Champaign, IL
18. The University of Queensland, Australia: EMMIX. http:// www.maths.uq.edu.au Accessed June 1, 2006
19. McLachlan G., Peel D.: Finite mixture models.2000.John Wiley & Sons, IncNew York
20. Yarbus A.L.: Eye movements and vision.1967.Plenum PressNew York
21. McConkie G.W., Underwood N.R., Zola D., et. al.: Some temporal characteristics of processing during reading. J Exp Psychol Hum Perc Perform 1985; 11: pp. 168-182.
22. Wallis G., Bulthoff H.: Learning to recognize objects. Trends Cog Sci 1999; 3: pp. 22-31.
23. Peterson M.A., Rhodes G.: Perception of faces, objects and scenes.2003.Oxford University PressOxford
24. Navon D.: Forest before trees: the precedence of global features in visual perception. Cog Psych 1977; 9: pp. 353-383.
25. Myles-Worsley M., Johnston W.A., Simons M.A.: The influence of expertise on X-ray image processing. J Exp Psychol Learn Mem Cogn 1988; 14: pp. 553-557.
26. Schyns P.D., Gosselin F.: Diagnostic use of scale information for componential and holistic recognition.Peterson M.A.Rhodes G.Perception of faces, objects and scenes.2003.Oxford University PressOxford:pp. 120-145.
27. Wood B.P.: Visual expertise. Radiology 1999; 211: pp. 1-3.
28. Sowden P.T., Davies I.R.L., Roling P.: Perceptual learning of the detection of features in X-ray image: a functional role for improvements in adults’ visual sensitivity?. J Exp Psychol Human Percept Performance 2000; 26: pp. 379-390.
29. Charness N., Krampe R., Mayr U.: The role of practice and coaching in entrepreneurial skill domains: an international comparison of life-span chess skill acquisition.Ericsson K.A.The road to excellence.1996.Lawrence Erlbaum AssociatesMahwah NJ:pp. 51-80.
30. Smith-Bindman R., Chu P., Miglioretti D.L., et. al.: Physician predictors of mammographic accuracy. J Nat Cancer Ins 2005; 97: pp. 358-367.